4056
Advanced CEST MRI processing pipeline in pilot study of Cognitively Impaired patients vs Normal Controls1Radiology, UT Southwestern Medical Center, Dallas, TX, United States, 2Advanced Imaging Research Center, UT Southwestern, Dallas, TX, United States, 3Neurology, UT Southwestern Medical Center, Dallas, TX, United States, 4Philips Healthcare, Gainsville, FL, United States, 5Philips Research, Hamburg, Germany
Synopsis
Keywords: Alzheimer's Disease, CEST & MT, Alzheimer's Disease
Motivation: Alzheimer's disease(AD) presents a major public health and economic challenge, necessitating reliable early detection of biomarkers such as tau and beta-amyloid protein accumulation.
Goal(s): Our primary aim was to establish a standardized neuro CEST MRI pipeline, integrating established neuroimaging tools with CEST processing, and applying it to differentiating cognitively impaired(CI) from normal control(NC).
Approach: A pilot study included nine CI and three NC individuals imaged with a mDixon CEST MRI and processed with a proposed pipeline.
Results: The pipeline effectively reduced erroneous signals in CEST maps and identified significant regional differences between CI and NC(p<0.05).
Impact: The successful implementation of CEST-MRI in AD patients could lead to more timely interventions, guide therapeutic strategies, improve patient outcomes, and decrease the overall cost.
Introduction
Alzheimer's disease (AD) presents a major public health and economic challenge1, necessitating reliable imaging biomarkers for tau and beta-amyloid protein accumulation. Early diagnosis and monitoring of AD are crucial for patient management and potential intervention. Current diagnostic methods, such as cerebrospinal fluid biomarker analysis and positron emission tomography, are invasive, expensive, or involve ionizing radiation. MRI could offer a non-invasive alternative. CEST MRI has demonstrated utility in brain tumors, especially focusing on amides at 3.5 ppm (APTw), and shown promise in neurodegeneration2,3. However, CEST-MRI still faces obstacles for full clinical translation and integration4. Specifically, application of CEST-MRI to AD is in its early stages5-9. In this pilot study, we developed a CEST processing pipeline offering a standardized approach to region-of-interest (ROI) definition, and applied it in biomarker-confirmed AD patients. Our preliminary results highlight improvements achieved, as well as the potential to differentiate mild cognitively impaired (CI) patients from cognitively normal (NC) individuals.Methods
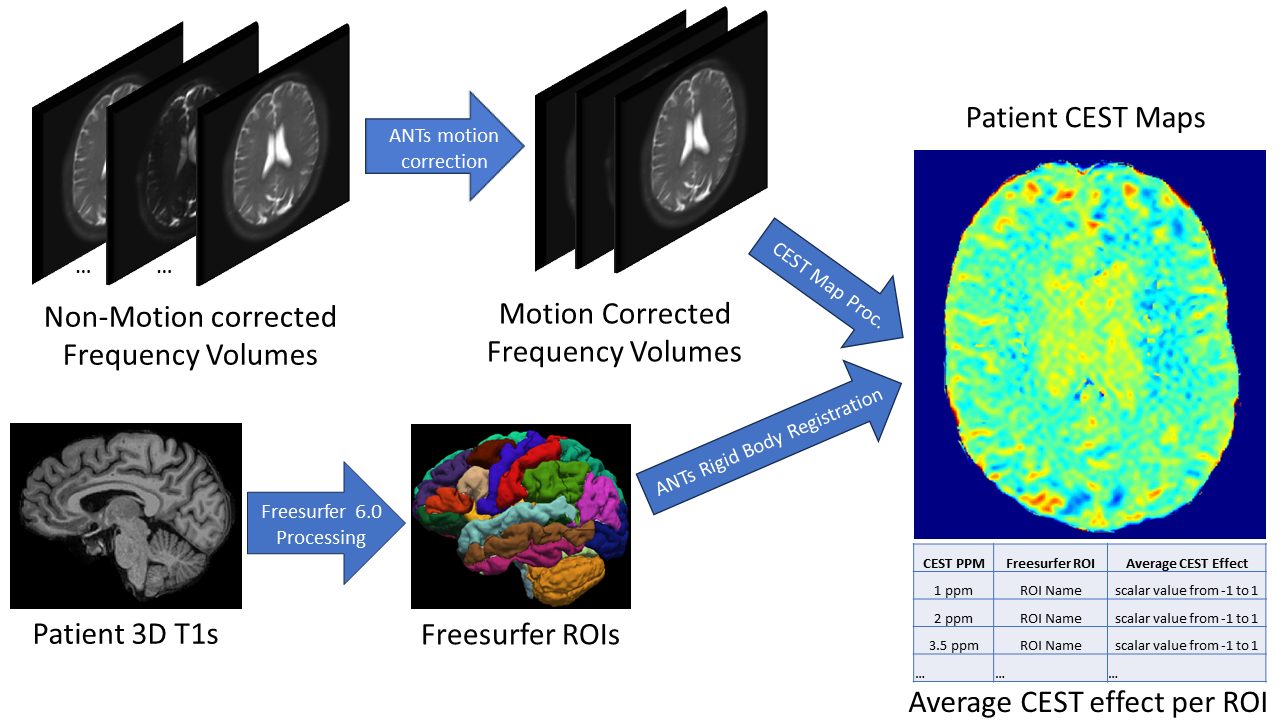
Nine CI patients and three age-matched NC individuals were recruited under an IRB-approved protocol and scanned using a 3T scanner (Philips Ingenia, NL). Multi-slice CEST GRE mDixon sequence2 was acquired with in-plane resolution=2x2 mm2, slice thickness=5mm, 10 slices. CEST parameters were: 40x50 ms hyperbolic secant pulses (total saturation length of 2 sec), B1rms=1.17 μT, enabled by alternated parallel transmission10, and 23 points in the Z-spectrum(±6 ppm) plus reference image, with a total scan time of 12 min. Water-only images were rigidly motion corrected using Advanced Normalization Tools (ANTs)11 (Figure 1). Custom MATLAB routines were used for voxelwise CEST processing, including Z-spectra generation, B0 correction and MTRasym curve calculation. Three frequencies (1ppm, 2ppm and 3.5ppm) were used to generate MTRasym maps. 3D-T1w images were processed with Freesurfer 6.0 to generate ROIs common to all subjects12. ANTs was used to co-register the ROIs to the CEST data. Between-group CEST effects (CI vs NC) across each ROI for every MTRasym maps were evaluated.Results
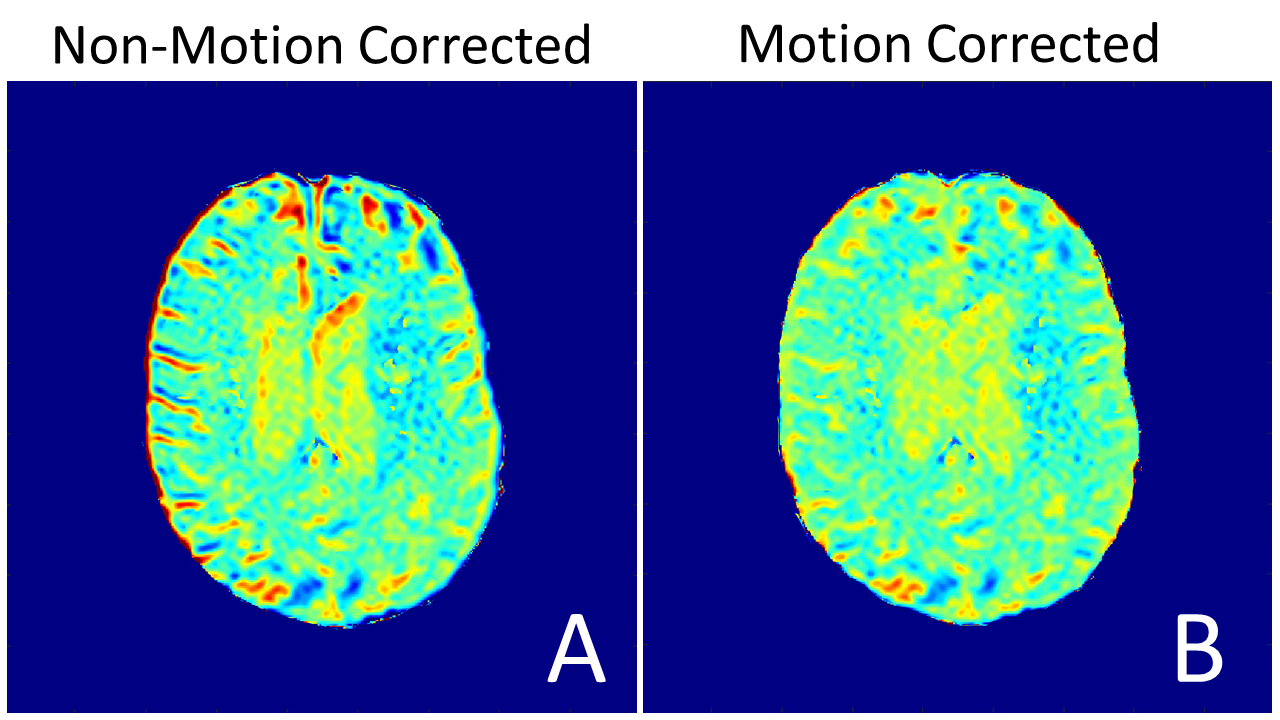
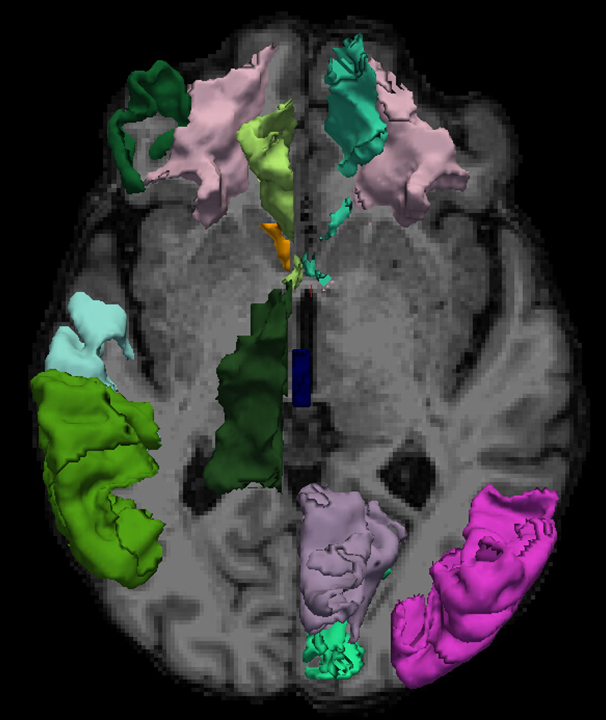
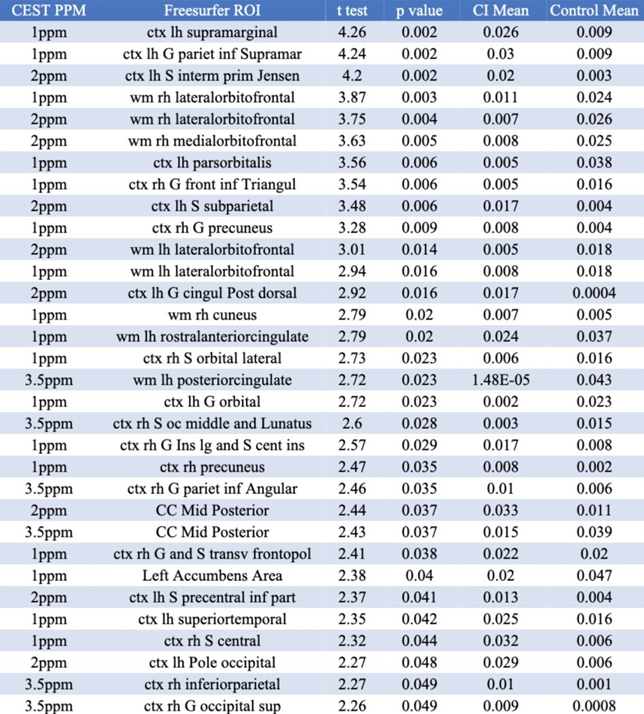
Figure 2 displays ANTs motion-corrected vs. non-corrected MTRasym(3.5 ppm) maps of a representative CI patient, with evident reductions in erroneous signal along gyral borders. Figure 3 demonstrates multiple cortical and white matter ROIs that demonstrated significant differences between CI and NC(p <0.05) The significant regions identified included known AD-involved regions such as the supramarginal gyrus13, orbitofrontal regions14, and precuneus15 (Figure 4/Table 1).Discussion
Herein, we propose a standardized CEST processing pipeline that incorporates rigid motion correction and the generation of MTRasym maps at multiple frequency offsets. Other, more advanced analysis tools, e.g. multi-peak Lorentzian fit, could be incorporated in the future. Notably, statistically significant differences between CI and NC groups were observed at 1ppm and 2ppm. These observations indicate the importance of acquiring the full Z-spectrum, exploring chemical groups beyond amides. The implementation of standard neuroimaging motion correction is noteworthy as it led to a reduction of erroneous signals along gyral borders (Figure 2). Motion artifacts can compromise the accuracy of CEST data. This refined processing pipeline allows for more robust data analysis, enhancing the potential for clinical translation of CEST MRI.Additionally, we identified several cortical and white matter regions that demonstrated significant differences between CI and NC groups. Notably, these significant regions included areas known to be involved in AD pathology, such as the supramarginal gyrus, orbitofrontal regions, and the precuneus13-15. The ability to detect differences in these regions is a promising step toward using CEST MRI as a biomarker for AD.
It is important to acknowledge limitations of our study. First, the brain coverage was incomplete and required additional processing steps. A different acquisition protocol, e.g. utilizing accelerated techniques and allowing full brain coverage16, would enhance robustness and is currently being explored. In addition, the small sample size limits the generalizability of the findings. Future studies should involve larger cohorts to ensure the reproducibility and accuracy of the CEST in AD. Additionally, the lack of longitudinal data precludes the assessment of the utility of CEST for tracking disease progression.
Conclusion
We established a CEST processing pipeline incorporating standardized neuroimaging tools and applied it in a pilot study of AD. The results indicate statistically significant CEST differences between CI and NC groups in multiple brain regions, several previously implicated in AD. The detection of changes in specific brain regions associated with AD supports the notion that CEST may offer a sensitive and specific disease biomarker.Acknowledgements
The work is supported in part by the Texas Alzheimer's Research & Care Consortium Junior Investigator Grant and NIH R01CA252281 grants. Salary for ARA Supported in part by a T32-EB028093.References
1. Wong, W. (2020). Economic burden of Alzheimer disease and managed care considerations. The American journal of managed care, 26(8 Suppl), S177-S183.
2. Zhang, S., Seiler, S., Wang, X., Madhuranthakam, A. J., Keupp, J., Knippa, E. E., ... & Vinogradov, E. (2018). CEST‐Dixon for human breast lesion characterization at 3 T: A preliminary study. Magnetic resonance in medicine, 80(3), 895-903.
3. Zhou, J., Heo, H. Y., Knutsson, L., van Zijl, P. C., & Jiang, S. (2019). APT‐weighted MRI: techniques, current neuro applications, and challenging issues. Journal of Magnetic Resonance Imaging, 50(2), 347-364.
4. Zhang, Y., Zu, T., Liu, R., & Zhou, J. (2022). Acquisition sequences and reconstruction methods for fast chemical exchange saturation transfer imaging. NMR in Biomedicine, e4699.
5. Orzyłowska, A., & Oakden, W. (2021). Saturation Transfer MRI for Detection of Metabolic and Microstructural Impairments Underlying Neurodegeneration in Alzheimer’s Disease. Brain Sciences, 12(1), 53.
6. Rhee, H. Y., & Park, K. C. (2019). Molecular imaging of Alzheimer's disease dementia by chemical exchange saturation transfer MRI. Journal of the Neurological Sciences, 405, 115.
7. Yu, F., Bell, N., Davenport, E., Bowen, S., Kelley, B. J., Dimitrov, I., Keupp, J., & Vinogradov, E. (2022, May 7). Development of CEST MRI for the characterization of lzheimer’s disease. (ISMRM 2022) Development of CEST MRI for the characterization of Alzheimer’s Disease. https://archive.ismrm.org/2022/2088.html
8. Liu, Y., Li, J., Ji, H., & Zhuang, J. (2022). Comparisons of Glutamate in the Brains of Alzheimer’s Disease Mice Under Chemical Exchange Saturation Transfer Imaging Based on Machine Learning Analysis. Frontiers in Neuroscience, 16, 838157.
9. Zhuang, C., Chen, B., Chen, Y., Zhang, X., & Wu, R. (2023). Pathophysiology of Alzheimer’s disease revealed by chemical exchange saturation transfer MRI. Radiology Science, 2(1), 56-70.
10. Keupp J, Baltes C, Harvey PR, van den Brink J. Parallel RF Transmission based MRI Technique for Highly Sensitive Detection of Amide Proton Transfer in the Human Brain at 3T. Proceedings of the 19th Annual Meeting of ISMRM; 2011; Montréal, Canada. p. 710.
11. Avants, B. B., Epstein, C. L., Grossman, M., & Gee, J. C. (2008). Symmetric diffeomorphic image registration with cross-correlation: evaluating automated labeling of elderly and neurodegenerative brain. Medical image analysis, 12(1), 26-41.
12. Salat, D. H., Greve, D. N., Pacheco, J. L., Quinn, B. T., Helmer, K. G., Buckner, R. L., & Fischl, B. (2009). Regional white matter volume differences in nondemented aging and Alzheimer's disease. Neuroimage, 44(4), 1247-1258.
13. Desikan, R. S., Cabral, H. J., Hess, C. P., Dillon, W. P., Glastonbury, C. M., Weiner, M. W., ... & Alzheimer's Disease Neuroimaging Initiative. (2009). Automated MRI measures identify individuals with mild cognitive impairment and Alzheimer's disease. Brain, 132(8), 2048-2057.
14. Van Hoesen, G. W., Parvizi, J., & Chu, C. C. (2000). Orbitofrontal cortex pathology in Alzheimer's disease. Cerebral Cortex, 10(3), 243-251.
15. Karas, G., Scheltens, P., Rombouts, S., Van Schijndel, R., Klein, M., Jones, B., ... & Barkhof, F. (2007). Precuneus atrophy in early-onset Alzheimer’s disease: a morphometric structural MRI study. Neuroradiology, 49, 967-976.
16. Sui, R., Chen, L., Li, Y., Huang, J., Chan, K. W., Xu, X., ... & Xu, J. (2021). Whole‐brain amide CEST imaging at 3T with a steady‐state radial MRI acquisition. Magnetic resonance in medicine, 86(2), 893-906.
Figures