4055
Gray-White Matter Boundary Z-Score and Its Volume as Imaging Biomarkers of Alzheimer’s Disease1Radiology, Kyung Hee University Hospital at Gangdong, Seoul, Korea, Republic of, 2Kyung Hee University, Seoul, Korea, Republic of, 3Radiology, Kyung Hee University Hospital, Seoul, Korea, Republic of, 4Neurology, Kyung Hee University Hospital at Gangdong, Seoul, Korea, Republic of
Synopsis
Keywords: Alzheimer's Disease, Alzheimer's Disease, gray-white matter boundary
Motivation: Alzheimer's disease (AD) presents typically gray matter atrophy and white matter abnormalities in neuroimaging.
Goal(s): Exploring gray-white matter boundary Z-score (gwBZ) and its tissue volume (gwBTV) between patients with Alzheimer’s disease (AD), amnestic mild cognitive impairment (MCI), and cognitively normal (CN) elderly participants.
Approach: Three-dimensional T1-weight images of a total of 227 participants were acquired to calculate gwBZ and gwBTV, prospectively.
Results: Both gwBZ and gwBTV were reduced in AD, were positively correlated with cognitive function, and could accurately discriminate AD from CN .
Impact: gwBZ and gwBTV could be a useful tool for monitoring AD progression and diagnosis.
Background and Purpose
Alzheimer's disease (AD) presents typically gray matter atrophy and white matter abnormalities in neuroimaging, suggesting that the gray-white matter boundary could be altered in individuals with AD. Previous studies have shown a link between neurocognitive dysfunction and the gray-white matter interface (1,2).The purpose of this study was to explore differences in gray-white matter boundary Z-score (gwBZ) and its tissue volume (gwBTV) between patients with AD, amnestic mild cognitive impairment (MCI), and cognitively normal (CN) elderly participants. We also examined relationships of gray-white matter boundary (gwB) and its tissue volume (gwBTV) with neurocognitive function as well as the diagnostic accuracy of gwB for differentiating AD from others. We hypothesized that gwB would be more blurred in MCI and AD than in CN and that gwB blurring would correlate with cognitive impairment and brain atrophy. We also expected that gwB would be a useful biomarker for identifying AD patients.
Method
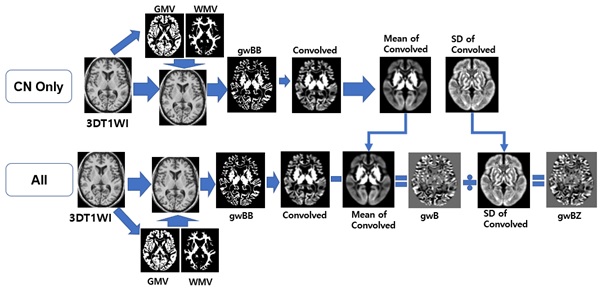
Three-dimensional T1-weight images of a total of 227 participants were prospectively obtained from our institute from 2006 to 2022 to map gwBZ and gwBTV on images using a 3-T MR system (Achieva or Ingenia, Philips Medical Systems, Best, The Netherlands). We used local MATLAB programming with Statistical Parametric Mapping version 12 (SPM12) software (Welcome Department of Imaging Neuroscience, University College, London, UK) to calculate gwB. We followed the method for constructing gwB proposed in a previous study (3) and optimized the processing pipeline to map gwB (Figure 1). In addition, we obtained a gray-white matter boundary tissue volume (gwBTV), which was the boundary tissue volume of gray matter and white matter. Before performing voxel-based statistical analyses, we applied Gaussian smoothing with an 8 mm isotropic full-width at half maximum (FWHM) to all maps. We performed both voxel-based and region-of-interest (ROI) analyses to evaluate the group differences, correlation with cognition or age, and receiver operating characteristic (ROC) curve analysis.Results
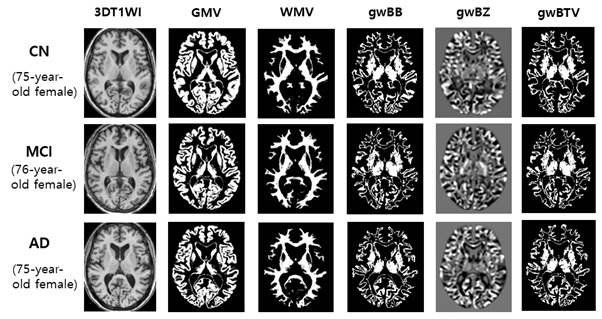
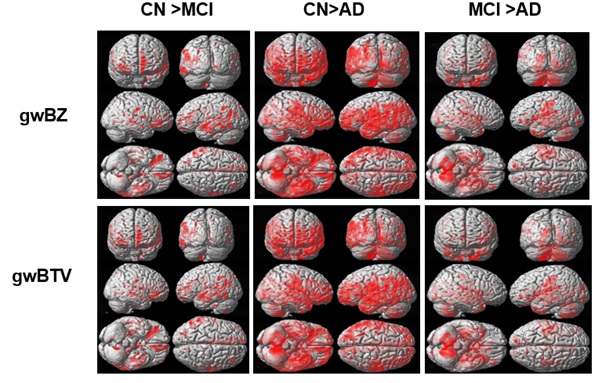
Figure 2 shows representative maps of gwBZ and gwBTV obtained from one CN participant (a 75-year-old), one MCI participant (a 76-year-old), and one AD participant (a 75-year-old) who were females of a similar age. Bright regions in the boundary map indicate cortical areas and the transition zone between gray and white matter. Compared to CN and MCI, gwBZ of AD had less bright regions, especially in the bilateral occipital lobe, hippocampus area, and insula. This study included 62 CN participants (71.8 ± 4.8 years, 20 males, 42 females), 72 MCI participants (72.6 ± 5.1 years, 23 males, 49 females), and 93 AD participants (73.6 ± 7.7 years, 22 males, 71 females). Figure 3 shows voxel-based analysis results of gwBZ maps and gwBTV maps among participant groups. It was found that gwBZ and gwBTV were lower in AD than in CN or MCI and lower in MCI than in CN. The AD group had lower gwBZ and gwBTV than the CN and MCI groups. K-MMSE showed positive correlations with gwBZ and gwBTV whereas age showed negative correlations with gwBZ and gwBTV. The combination of gwBZ or gwBTV with K-MMSE had a high accuracy in classifying AD from CN in the hippocampus with an area under curve (AUC) value of 0.972 for both.Conclusion
gwBZ and gwBTV were reduced in AD. They were correlated with cognitive function and age. Moreover, gwBZ or gwBTV combined with K-MMSE had a high accuracy in differentiating AD from CN in the hippocampus. These findings suggest that evaluating gwBZ and gwBTV in the AD brain could be a useful tool for monitoring AD progression and diagnosis.Acknowledgements
This research was supported by a grant of the Korea Dementia Research Project through the Korea Dementia Research Center (KDRC), funded by the Ministry of Health & Welfare and Ministry of Science and ICT, Republic of Korea (HU21C0086, G.H.J.) and by the National Research Foundation of Korea (NRF) grants funded by Ministry of Science and ICT (2020R1A2C1004749, G.H.J.), Republic of Korea.References
1. Alisafaei F, et al.. Mechanisms of Local Stress Amplification in Axons near the Gray-White Matter Interface. Biophys J 2020;119(7):1290-1300.
2. Blackmon K, et al. Cortical gray-white matter blurring and declarative memory impairment in MRI-negative temporal lobe epilepsy. Epilepsy Behav 2019;97:34-43.
3. Huppertz HJ, et al.. Voxel-based 3D MRI analysis helps to detect subtle forms of subcortical band heterotopia. Epilepsia 2008;49(5):772-785.
Figures