4051
In vivo tau and diffusion correlation in Alzheimer’s disease1Cortechs Labs, Inc, San Diego, CA, United States, 2Institute of Biomedical Engineering, Bogazici University, Istanbul, Turkey, 3University of Canterbury, Christchurch, New Zealand
Synopsis
Keywords: Alzheimer's Disease, Aging
Motivation: To investigate the microstructural changes caused by tau deposits in Alzheimer's disease.
Goal(s): Use diffusion imaging in vivo to detect microstructural changes related to tau deposits.
Approach: We used MR diffusion and PET tau images in conjunction with native space segmentation maps from T1-weighted images to explore correlations between tau deposits and diffusion maps in a group of patients with Alzheimer’s disease.
Results: There is decreased diffusion in gray matter with increasing tau deposits in Alzheimer's patients which may be used for non-invasive monitoring of disease progression.
Impact: Diffusion MRI may provide a proxy measure of tau deposits in gray matter and may decrease the need for repeated radioactive tracer use for monitoring Alzheimer's disease progression.
Introduction
Alzheimer’s disease is pathologically characterized by amyloid beta plaques and neurofibrillary tangles of tau protein in addition to atrophy. With the advent of relevant PET tracers, the pathological disease progress of these deposits can be visualized in vivo. These deposits change the microstructural environment. MR diffusion imaging, with its sensitivity to tissue microstructure, may be sensitive to these deposits. Prior animal [1] and human [2,3] studies have explored Alzheimer's disease neuropathology using diffusion imaging. An animal model was used to determine relationships between diffusion indices and tau pathology [1] in a multi-compartment diffusion model.Methods
In this study, 41 subjects with Alzheimer’s disease were included from the ADNI database [4]. The patients had an MRI study including a 3D T1-weighted and a diffusion tensor imaging series. In addition to MRI, these patients also underwent PET imaging with a tau tracer (flortaucipir 18F). The T1-weighted images were segmented using a clinical segmentation tool (NeuroQuant. Cortechs Labs, Inc. San Diego) in the native space of the patients. The diffusion images were processed using a tensor model and mean diffusion constant maps were calculated. The diffusion images and PET images are registered to the native T1-space of the individual subjects. The segmentation maps obtained from T1-weighted images were carried over to the diffusion and tau images. SUVr maps were calculated by dividing the tau raw values by the means of the tau volume from the entire brain. The mean values for different brain regions for both mean diffusion maps and tau SUVr maps were calculated and plotted for all subjects.Results
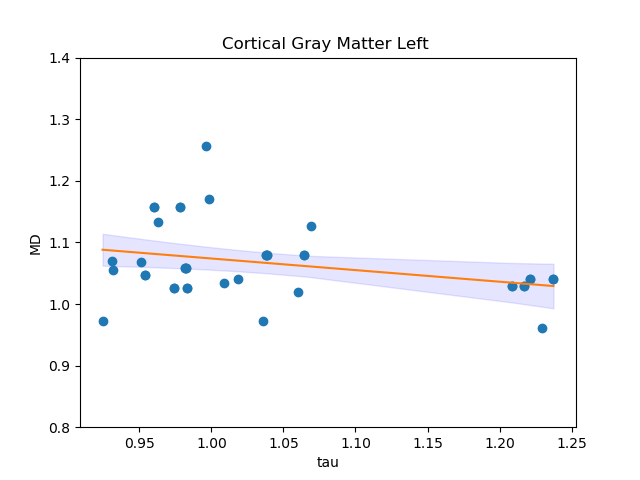
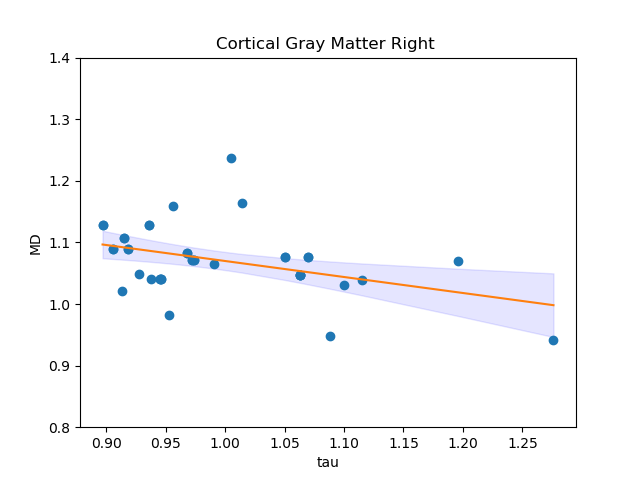
We found that in cortical gray matter, there is decreased mean diffusion with increasing tau SUVr. This small but significant correlation (p < 0.05 left hemisphere, p < 0.01 right hemisphere) suggests that the tau deposits alter the intra-cellular space causing additional hindrance to water diffusion. In Figure 1 mean diffusion is plotted against the tau SUVr values in the left hemisphere. Figure 2 shows the right hemisphere.Discussion
The tau tangles in the intra-cellular space hinder the diffusion of water molecules with the measured diffusion decreasing with increasing tau tangles. We found that in a diffusion tensor model this effect is observable in gray matter. Better harmonization of diffusion protocols would increase the accuracy of diffusion quantitation and may increase the correlation between measured MD and tau SUVr. Increased atrophy with the disease progression may increase the partial volume effects in small brain regions causing an increase in the measured diffusion constants. It may be difficult to detect tau deposits with diffusion in small regions such as the hippocampus which is prone to partial volume effects in diffusion imaging.Conclusions
The correlation between diffusion and tau suggests that the tau deposits alter the intra-cellular space due to the additional hindrance to water diffusion. It may be possible to use this information from MR diffusion imaging as a proxy measure for tau deposits without a need for a longitudinal PET study. We expect that the use of multi-compartment diffusion models would increase the sensitivity of detecting the tau hindrance of water diffusion in the extra-cellular space.Acknowledgements
Research reported in this publication was supported by the National Institute On Aging of the National Institutes of Health under Award Numbers R44AG076194 and R44AG060798.
Data collection and sharing for this project was funded by the Alzheimer's Disease Neuroimaging Initiative (ADNI) (National Institutes of Health Grant U01 AG024904) and DOD ADNI (Department of Defense award number W81XWH-12-2-0012). ADNI is funded by the National Institute on Aging, the National Institute of Biomedical Imaging and Bioengineering, and through generous contributions from multiple companies.
References
[1] Colgan N, Siow B, O'Callaghan JM, Harrison IF, Wells JA, Holmes HE, Ismail O, Richardson S, Alexander DC, Collins EC, Fisher EM, Johnson R, Schwarz AJ, Ahmed Z, O'Neill MJ, Murray TK, Zhang H, Lythgoe MF. Application of neurite orientation dispersion and density imaging (NODDI) to a tau pathology model of Alzheimer's disease. Neuroimage. 2016 Jan 15;125:739-744. doi: 10.1016/j.neuroimage.2015.10.043. Epub 2015 Oct 23. PMID: 26505297; PMCID: PMC4692518.
[2] Sone D, Shigemoto Y, Ogawa M, Maikusa N, Okita K, Takano H, Kato K, Sato N, Matsuda H. Association between neurite metrics and tau/inflammatory pathology in Alzheimer's disease. Alzheimers Dement (Amst). 2020 Nov 11;12(1):e12125. doi: 10.1002/dad2.12125. PMID: 33204813; PMCID: PMC7656172.
[3] Torso M, Ridgway GR, Valotti M, Hardingham I, Chance SA; National Alzheimer’s Coordinating Center; Alzheimer’s Disease Neuroimaging Initiative. In vivo cortical diffusion imaging relates to Alzheimer's disease neuropathology. Alzheimers Res Ther. 2023 Oct 4;15(1):165. doi: 10.1186/s13195-023-01309-3. PMID: 37794477; PMCID: PMC10548768.
[4] Data used in preparation of this article were obtained from the Alzheimer's Disease Neuroimaging Initiative (ADNI) database (adni.loni.usc.edu).
Figures