4050
In Vivo Measurement of Regional Brain Nicotinamide Adenine Dinucleotide (NAD) by 31P MR Spectroscopic Imaging at 1.5 T1Britton Chance Laboratory of Redox Imaging, Radiology, Perelman School of Medicine, University of Pennsylvania, Philadelphia, PA, United States, 2Molecular Imaging Section, Radiology, Perelman School of Medicine, University of Pennsylvania, Philadelphia, PA, United States, 3Advanced Imaging Research, Inc., Cleveland, OH, United States
Synopsis
Keywords: Alzheimer's Disease, Alzheimer's Disease, MR Spectroscopy, NAD indices
Motivation: Our incentive is to validate the clinical translation of the nicotinamide adenine dinucleotide (NAD) indices as biomarkers in aging and neurodegenerative diseases in clinically accessible 1.5T MR scanners.
Goal(s): We aimed to demonstrate the feasibility of the noninvasive assessment of the NAD indices in the human brain using 31P magnetic resonance spectroscopic imaging at 1.5 T.
Approach: We used advanced data processing, including principal component analysis, and performed simulations to support quantifying the brain NAD indices using low magnetic fields.
Results: Our results demonstrate that total NAD is reliably measured under our conditions, making it a potential metabolic biomarker for aging and neurodegeneration.
Impact: Brain nicotinamide adenine dinucleotide is a potential biomarker and therapeutic target in aging and neurodegeneration. Its noninvasive measurement by 31P magnetic resonance spectroscopic imaging on highly accessible 1.5T clinical scanners will facilitate its biomarker development and treatment utility.
Introduction
Nicotinamide adenine dinucleotide (NAD) supports essential cellular functions (e.g., bioenergetics, redox balance, gene expression, and DNA repair).1-3 Brain NAD deficiency alters these functions, producing inflammation and neuronal damage in aging and neurodegenerative diseases.2,4,5 Furthermore, in neurodegenerative models, NAD supplementation mitigates neuropathology and restores cognition, making NAD a potential biomarker for disease progression and theragnosis.6-8 Therefore, the knowledge of the spatiotemporal changes of brain NAD indices is essential for evaluating their significance in neurodegenerative diseases. Reports of brain NAD assessment using phosphorous-31 magnetic resonance spectroscopy (31P MRS) mainly use high-field scanners (≥ 3T) and surface radiofrequency (RF) coil or single-volume localization.9-14 In this report, we evaluate the feasibility of measuring the brain NAD distribution in healthy subjects using multivolume 31P MR spectroscopic imaging (31P-MRSI) at 1.5 tesla.Materials & Methods
Using a dual-tuned (1H/31P) volume RF coil, a stringent B0-field shimming, maximizing the 31P signal strength by 1H-irradiation, and employing the chemical shift imaging (CSI) algorithm for optimal localization, we noninvasively obtained 3D 31P-MRSI data from brains of human subjects, as described.15 Using our proprietary software 3DiCSI,16 we processed the spectral data, visualized its spatial distribution and minimized the frequency, phase, and line-shape variations using principal component analysis (PCA).17,18 We subsequently use PCA reconstruction of the spectra to improve the signal-to-noise ratio (SNR),19 correct the baseline, and reduce the contribution of tissues surrounding the brain. We used a customized MATLAB algorithm to quantify phosphocreatine (PCr), the α and β signals of adenosine triphosphate (αATP and βATP), and the oxidized (NAD+) and reduced (NADH) forms of NAD and calculated total NAD (tNAD = NAD++NADH). Moreover, we performed MATLAB simulations of the αATP spectral region to determine the accuracy of the spectral quantification.Results
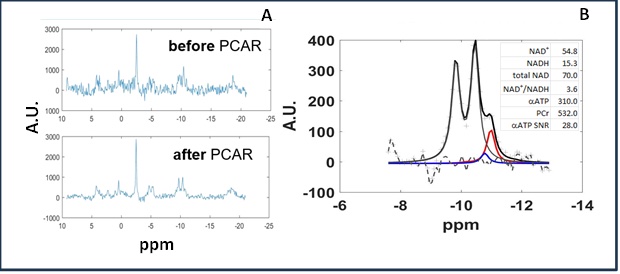
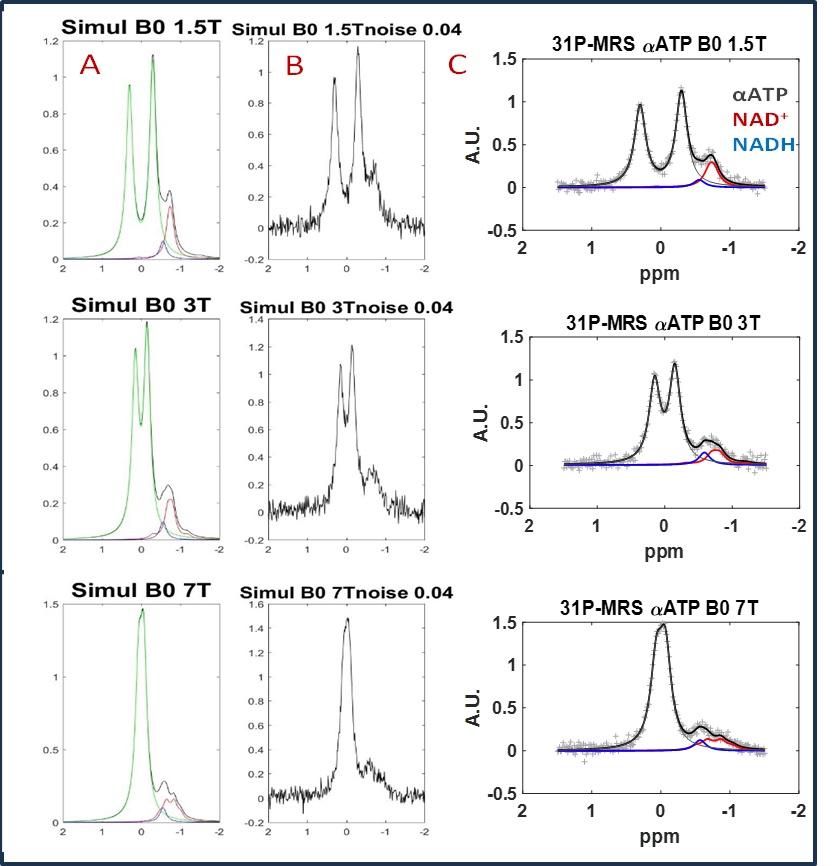
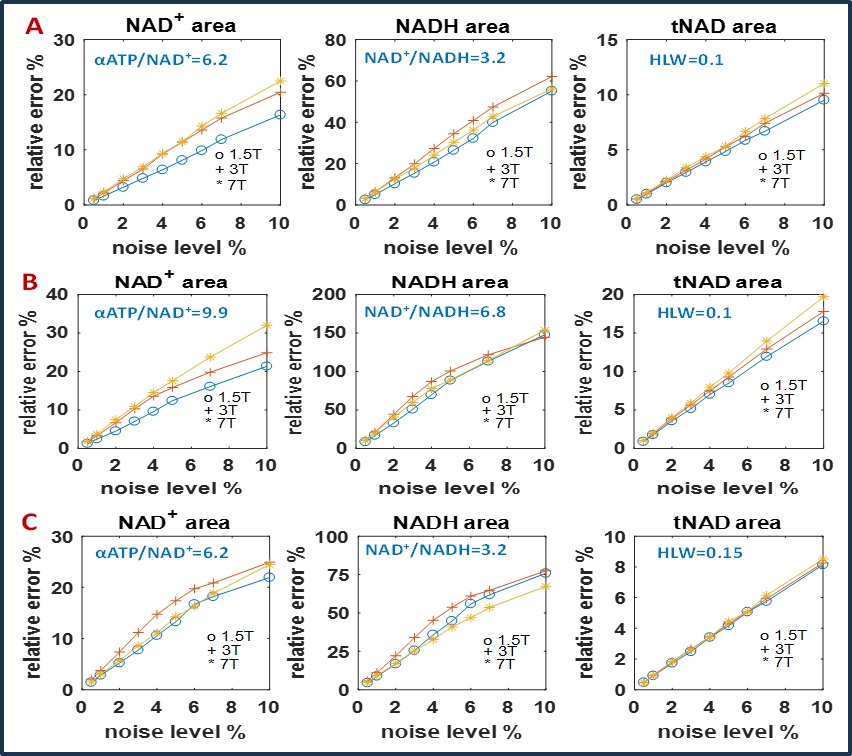
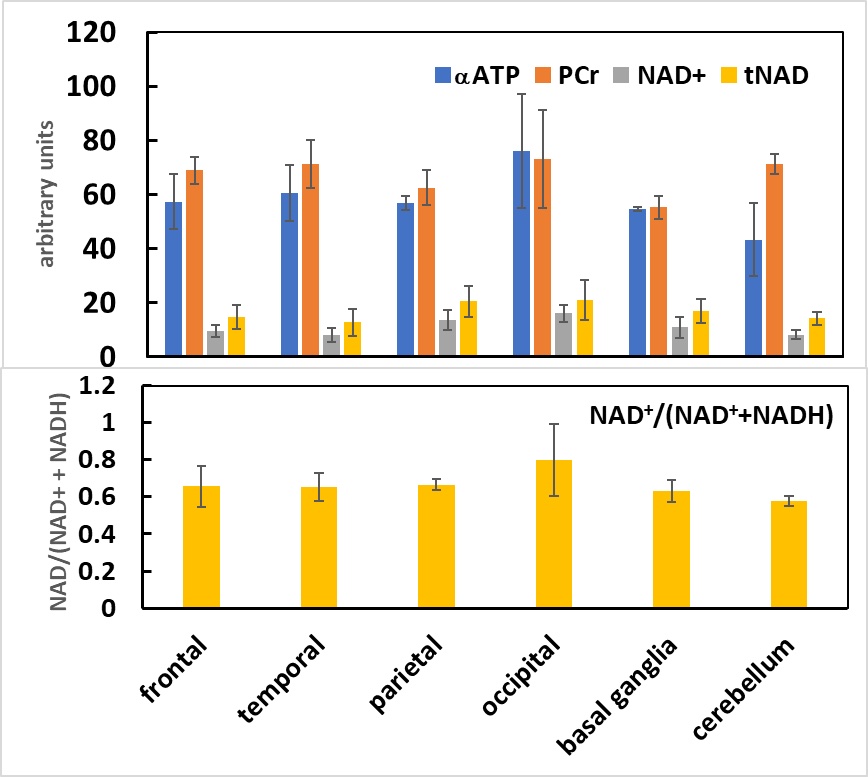
Figure 1(A) shows a localized 31P MR spectrum from an 11.4 mL brain voxel before and after PCA reconstruction (PCAR). An arrow marks the upfield shoulder of αATP containing the NAD indices, visible in both panels but significantly improved by PCAR. Fig. 1(B) shows the αATP region peak fitting results of a similar voxel in the hippocampus. Figure 2 shows simulated αATP region spectra before (A) and after noise addition (B) and the peak fitting results (C) at three field strengths (rows). As shown, the overlap of the two central resonances of the NAD+ quartet decreases at 1.5T, making them sharper and more apparent and improving their quantification. Figure 3 depicts the relative percentage errors simulation at three field strengths for NAD+, NADH, and tNAD (rows) varying noise, linewidths, and the αATP/NAD+ and NAD+/NADH values. An adequate quantification of the three NAD indices was achieved at the lowest noise level (≤1%) under all conditions despite the relative error increase due to noise. Again, this simulation indicates a better quantification accuracy of the NAD indices at 1.5T when SNR is similar across the three fields. However, higher SNR is expected at higher magnetic fields. Interestingly, tNAD can be quantified with <10% error under different fields, linewidths, and ratios of αATP, NAD+, and NADH when its noise level is ≤5% (SNR≥40 for the αATP doublet). We believe this improved accuracy for tNAD is due to cancellations of fitting errors for NAD+ and NADH. Figure 4 shows the metabolic indices distribution in three healthy subjects (male, 23, 35, and 47 years old). Spectra from the frontal, parietal, temporal, and occipital lobes, basal nuclei, and cerebellum were summed to obtain one spectrum per region. The standard deviations of the frontal, temporal, and parietal lobes indices and the basal nuclei are about 10% of their mean value, suggesting adequate measurement accuracy. The more extensive value spread of the indices in the occipital lobe and cerebellum could be due to variations in their positioning within the coil profile, as they are the most caudal regions of the brain.Discussion & Conclusions
We investigated the feasibility of measuring the NAD indices' regional distribution in healthy brains using 3D 31P-MRSI at 1.5 T under optimal acquisition and PCAR postprocessing. Our simulations demonstrate that the tNAD error is significantly lower than NAD+ and NADH and nearly field-strength independent, thus making tNAD clinically accurate at all field strengths, including 1.5T. Therefore, tNAD could be an attractive and reliable metabolic biomarker for aging and neurodegenerative diseases known to have NAD deficiency. Given this, our next goal is to assess the biomarker value of tNAD in human subjects with aging and neurodegenerative diseases.Acknowledgements
This work was supported by US NIH Grants R01CA118559 and R21CA152858 (PI: F. Arias-Mendoza) for the data acquisition and US NIH Grants R01CA191207 and R01CA277037 (PI: L. Z. Li) for the data analysis.References
1. Cuenoud B, Ipek O, Shevlyakova M, Beaumont M, Cunnane SC, Gruetter R, Xin L. Brain NAD Is Associated With ATP Energy Production and Membrane Phospholipid Turnover in Humans. Front Aging Neurosci. 2020;12:609517. Epub 2021/01/05. doi: 10.3389/fnagi.2020.609517. PubMed PMID: 33390929; PMCID: PMC7772416.
2. Skupienski R, Do KQ, Xin L. In vivo (31)P magnetic resonance spectroscopy study of mouse cerebral NAD content and redox state during neurodevelopment. Sci Rep. 2020;10(1):15623. Epub 2020/09/26. doi: 10.1038/s41598-020-72492-8. PubMed PMID: 32973277; PMCID: PMC7519085.
3. Belenky P, Bogan KL, Brenner C. NAD+ metabolism in health and disease. Trends Biochem Sci. 2007;32(1):12-9. Epub 20061211. doi: 10.1016/j.tibs.2006.11.006. PubMed PMID: 17161604.
4. Zhu XH, Lu M, Lee BY, Ugurbil K, Chen W. In vivo NAD assay reveals the intracellular NAD contents and redox state in healthy human brain and their age dependences. Proc Natl Acad Sci U S A. 2015;112(9):2876-81. Epub 2015/03/03. doi: 10.1073/pnas.1417921112. PubMed PMID: 25730862; PMCID: PMC4352772.
5. Kim SY, Cohen BM, Chen X, Lukas SE, Shinn AK, Yuksel AC, Li T, Du F, Ongur D. Redox Dysregulation in Schizophrenia Revealed by in vivo NAD+/NADH Measurement. Schizophr Bull. 2017;43(1):197-204. Epub 2016/09/25. doi: 10.1093/schbul/sbw129. PubMed PMID: 27665001; PMCID: PMC5216857.
6. Hou Y, Lautrup S, Cordonnier S, Wang Y, Croteau DL, Zavala E, Zhang Y, Moritoh K, O'Connell JF, Baptiste BA, Stevnsner TV, Mattson MP, Bohr VA. NAD(+) supplementation normalizes key Alzheimer's features and DNA damage responses in a new AD mouse model with introduced DNA repair deficiency. Proc Natl Acad Sci U S A. 2018;115(8):E1876-E85. Epub 2018/02/13. doi: 10.1073/pnas.1718819115. PubMed PMID: 29432159; PMCID: PMC5828618.
7. Chandrasekaran K, Choi J, Arvas MI, Salimian M, Singh S, Xu S, Gullapalli RP, Kristian T, Russell JW. Nicotinamide Mononucleotide Administration Prevents Experimental Diabetes-Induced Cognitive Impairment and Loss of Hippocampal Neurons. Int J Mol Sci. 2020;21(11). Epub 2020/05/30. doi: 10.3390/ijms21113756. PubMed PMID: 32466541; PMCID: PMC7313029.
8. Chouinard VA, Kim SY, Valeri L, Yuksel C, Ryan KP, Chouinard G, Cohen BM, Du F, Ongur D. Brain bioenergetics and redox state measured by (31)P magnetic resonance spectroscopy in unaffected siblings of patients with psychotic disorders. Schizophr Res. 2017;187:11-6. Epub 2017/03/05. doi: 10.1016/j.schres.2017.02.024. PubMed PMID: 28258794; PMCID: PMC5581291.
9. Ren J, Malloy CR, Sherry AD. Quantitative measurement of redox state in human brain by (31) P MRS at 7T with spectral simplification and inclusion of multiple nucleotide sugar components in data analysis. Magn Reson Med. 2020;84(5):2338-51. Epub 2020/05/10. doi: 10.1002/mrm.28306. PubMed PMID: 32385936; PMCID: PMC7396304.
10. Lu M, Zhu XH, Zhang Y, Chen W. Intracellular redox state revealed by in vivo (31) P MRS measurement of NAD(+) and NADH contents in brains. Magn Reson Med. 2014;71(6):1959-72. Epub 2013/07/12. doi: 10.1002/mrm.24859. PubMed PMID: 23843330; PMCID: PMC4384818.
11. Lu M, Zhu XH, Chen W. In vivo (31) P MRS assessment of intracellular NAD metabolites and NAD(+) /NADH redox state in human brain at 4 T. NMR Biomed. 2016;29(7):1010-7. Epub 2016/06/04. doi: 10.1002/nbm.3559. PubMed PMID: 27257783; PMCID: PMC4909585.
12. de Graaf RA, Behar KL. Detection of cerebral NAD(+) by in vivo (1)H NMR spectroscopy. NMR Biomed. 2014;27(7):802-9. Epub 2014/05/17. doi: 10.1002/nbm.3121. PubMed PMID: 24831866; PMCID: PMC4459131.
13. de Graaf RA, De Feyter HM, Brown PB, Nixon TW, Rothman DL, Behar KL. Detection of cerebral NAD(+) in humans at 7T. Magn Reson Med. 2017;78(3):828-35. Epub 2016/09/28. doi: 10.1002/mrm.26465. PubMed PMID: 27670385; PMCID: PMC5366282.
14. Bagga P, Hariharan H, Wilson NE, Beer JC, Shinohara RT, Elliott MA, Baur JA, Marincola FM, Witschey WR, Haris M, Detre JA, Reddy R. Single-Voxel (1) H MR spectroscopy of cerebral nicotinamide adenine dinucleotide (NAD(+) ) in humans at 7T using a 32-channel volume coil. Magn Reson Med. 2020;83(3):806-14. Epub 2019/09/11. doi: 10.1002/mrm.27971. PubMed PMID: 31502710; PMCID: PMC6879788.
15. Vigneron DB, Nelson SJ, Murphy-Boesch J, Kelley DA, Kessler HB, Brown TR, Taylor JS. Chemical shift imaging of human brain: axial, sagittal, and coronal P-31 metabolite images. Radiology. 1990;177(3):643-9. PubMed PMID: 2243963.
16. Zhao Q, Patriotis P, Arias-Mendoza F, Stoyanova R, Brown TR. An interactive software for 3D chemical shift imaging data analysis and real time spectral localization and quantification. Proc Experimental NMR Conference; Asilomar, CA, USA. p. 1262004. p. 126.
17. Stoyanova R, Brown TR. NMR spectral quantitation by principal component analysis. NMR Biomed. 2001;14(4):271-7. PubMed PMID: 11410945.
18. Stoyanova R, Brown TR. NMR spectral quantitation by principal component analysis. III. A generalized procedure for determination of lineshape variations. J Magn Reson. 2002;154(2):163-75. PubMed PMID: 11846573.
19. Abdoli A, Stoyanova R, Maudsley AA. Denoising of MR spectroscopic imaging data using statistical selection of principal components. MAGMA. 2016;29(6):811-22. Epub 20160603. doi: 10.1007/s10334-016-0566-z. PubMed PMID: 27260664; PMCID: PMC5699222.
Figures