4049
Longitudinal brain MRI and tauPET provide novel insights for Alzheimer’s Disease trial planning1Translational Imaging, Merck & Co., Inc., West Point, PA, United States, 2Department of Medical Physics, University of Wisconsin-Madison School of Medicine and Public Health, Madison, WI, United States, 3Department of Medicine, University of Wisconsin-Madison School of Medicine and Public Health, Madison, WI, United States, 4Department of Nuclear Medicine and Centre for PET, Austin Health, Heidelberg, Australia
Synopsis
Keywords: Alzheimer's Disease, Alzheimer's Disease, Drug Discovery
Motivation: Anatomical MRI plays an important role in Alzheimer’s Disease drug trials, yet the information it provides may not be fully utilized.
Goal(s): Regional brain volume and its atrophy in conjunction with amyloid- and tau-PET can provide valuable information about disease progression and treatment response.
Approach: Local brain atrophy was quantified and correlated with PET biomarkers.
Results: Significant correlation was reported between atrophy and baseline tau-PET in the medial-temporal region as well as robust associations with disease stage and amyloid burden. These findings can be used to understand disease development and therefore capture modulation in pathology with anti-tau and other therapies in trials.
Impact: Understanding the relationships between brain volumetrics, disease severity and tau burden, including significant correlation between medial-temporal atrophy and tauPET presented in this study allows for efficient measurement of treatment response in AD trials.
Introduction
Anatomical MRI of the brain is an integral part of the screening and follow-up in Alzheimer’s Disease (AD) clinical trials, offering longitudinal insights into regional brain volume and radiographic evidence of disease progression. Local atrophy as quantified by MRI has previously been linked with tau protein burden and disease stage, yet larger cohort studies and those incorporating a spectrum of cognitively normal and diseased population are lacking. Better understanding of brain atrophy dynamics and relationships with amyloid and tau markers is needed for longitudinal MRI to be efficiently used in screening and as endpoints for AD clinical trials.Methods
Baseline and follow-up anatomical T1-weighted MRI scans were acquired as part of a longitudinal MK-6240 tau-PET [1] study. Anonymized MRI data was available from n=173 subjects (144/18/11 Cognitive normal (CN)/mild cognitive impairment (MCI)/AD) including matched amyloid PET status (54/110/9 positive/negative/na); [18F]MK-6240 tauPET was available for n=20. Automated image processing pipeline was built in MATLAB, using SPM and CAT12 [2] toolboxes including orientation, normalization, segmentation and volume quantification of regions most relevant in AD, e.g., Braak 1-6 [3] and medial temporal (MT) regions were used for tauPET quantification. Logistic regression models for stage prediction were trained and tested in randomly (70/30) split data. Statistical analysis was performed in R (v4.2.2).Results
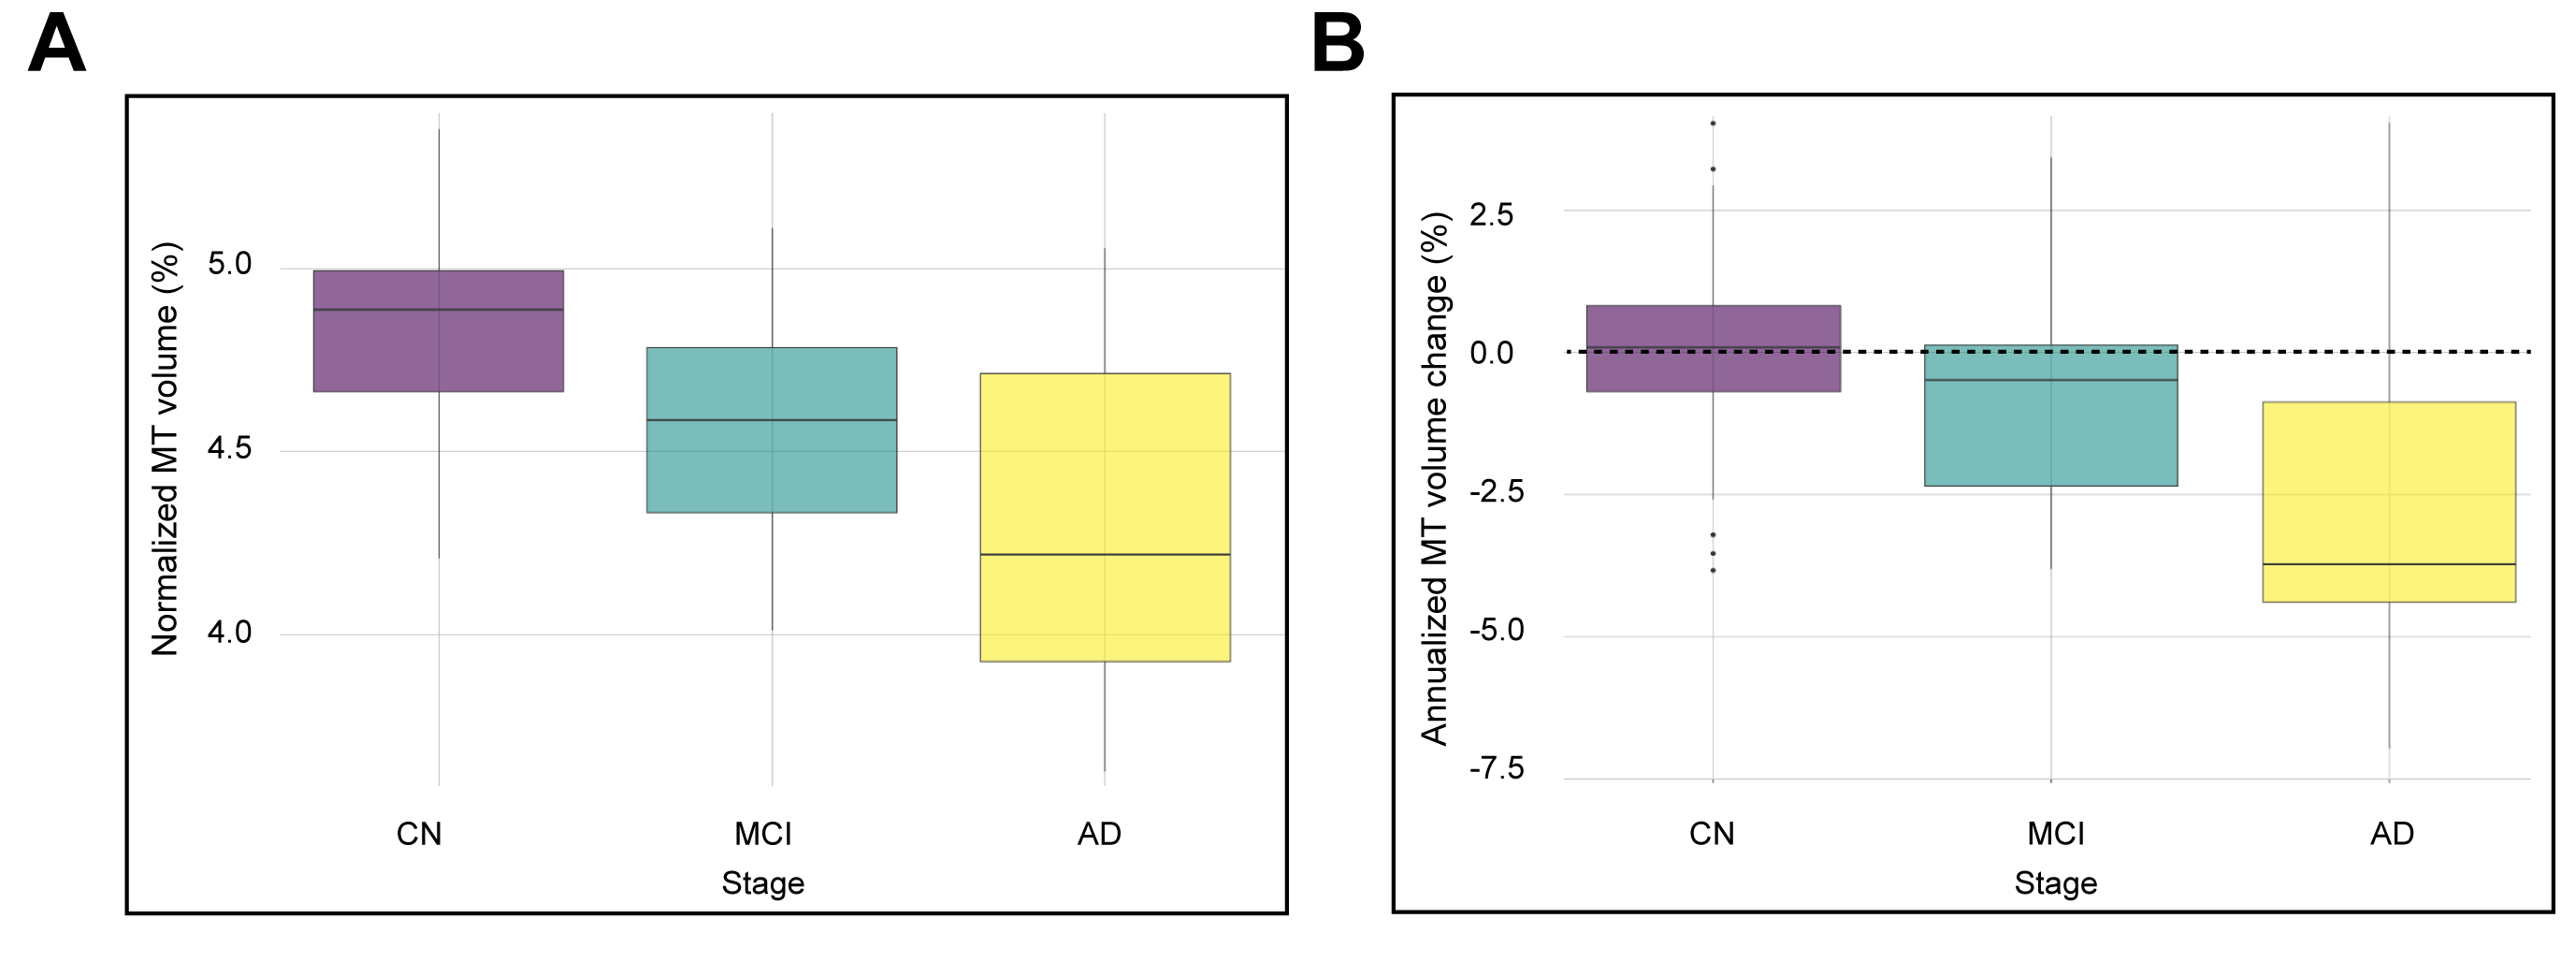
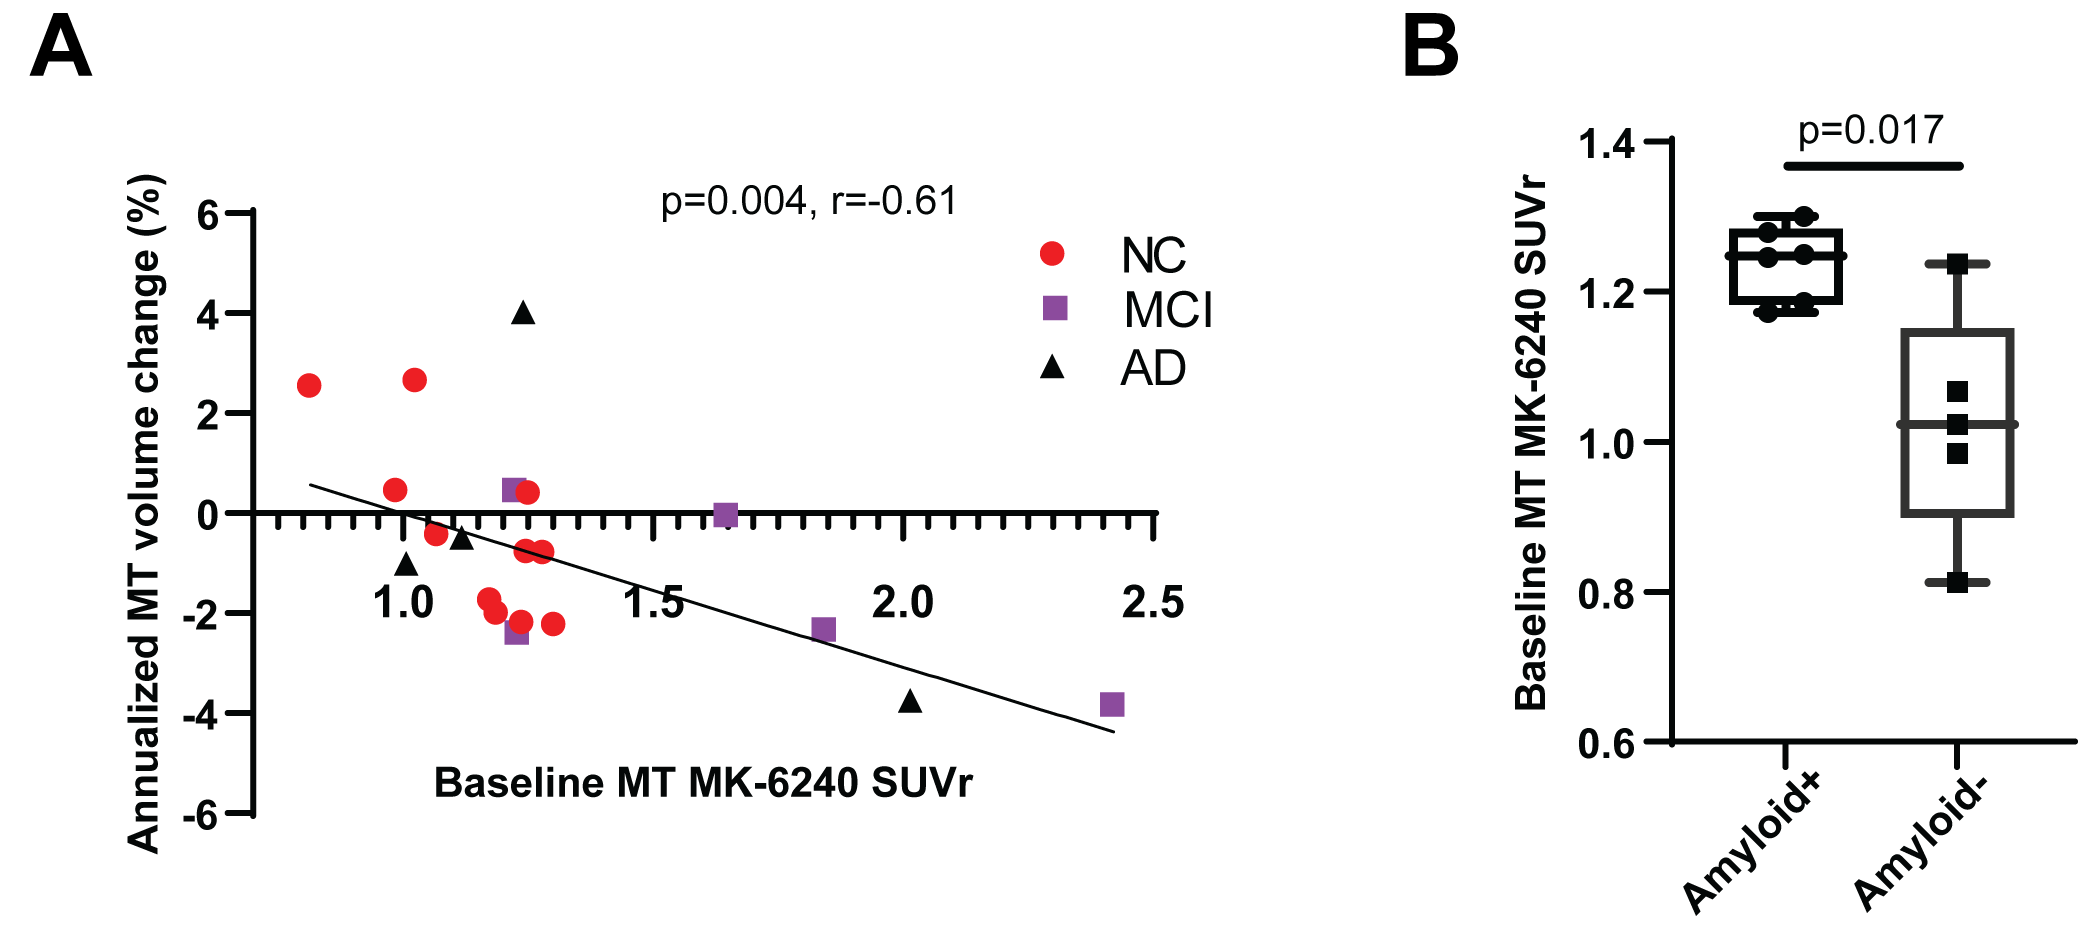
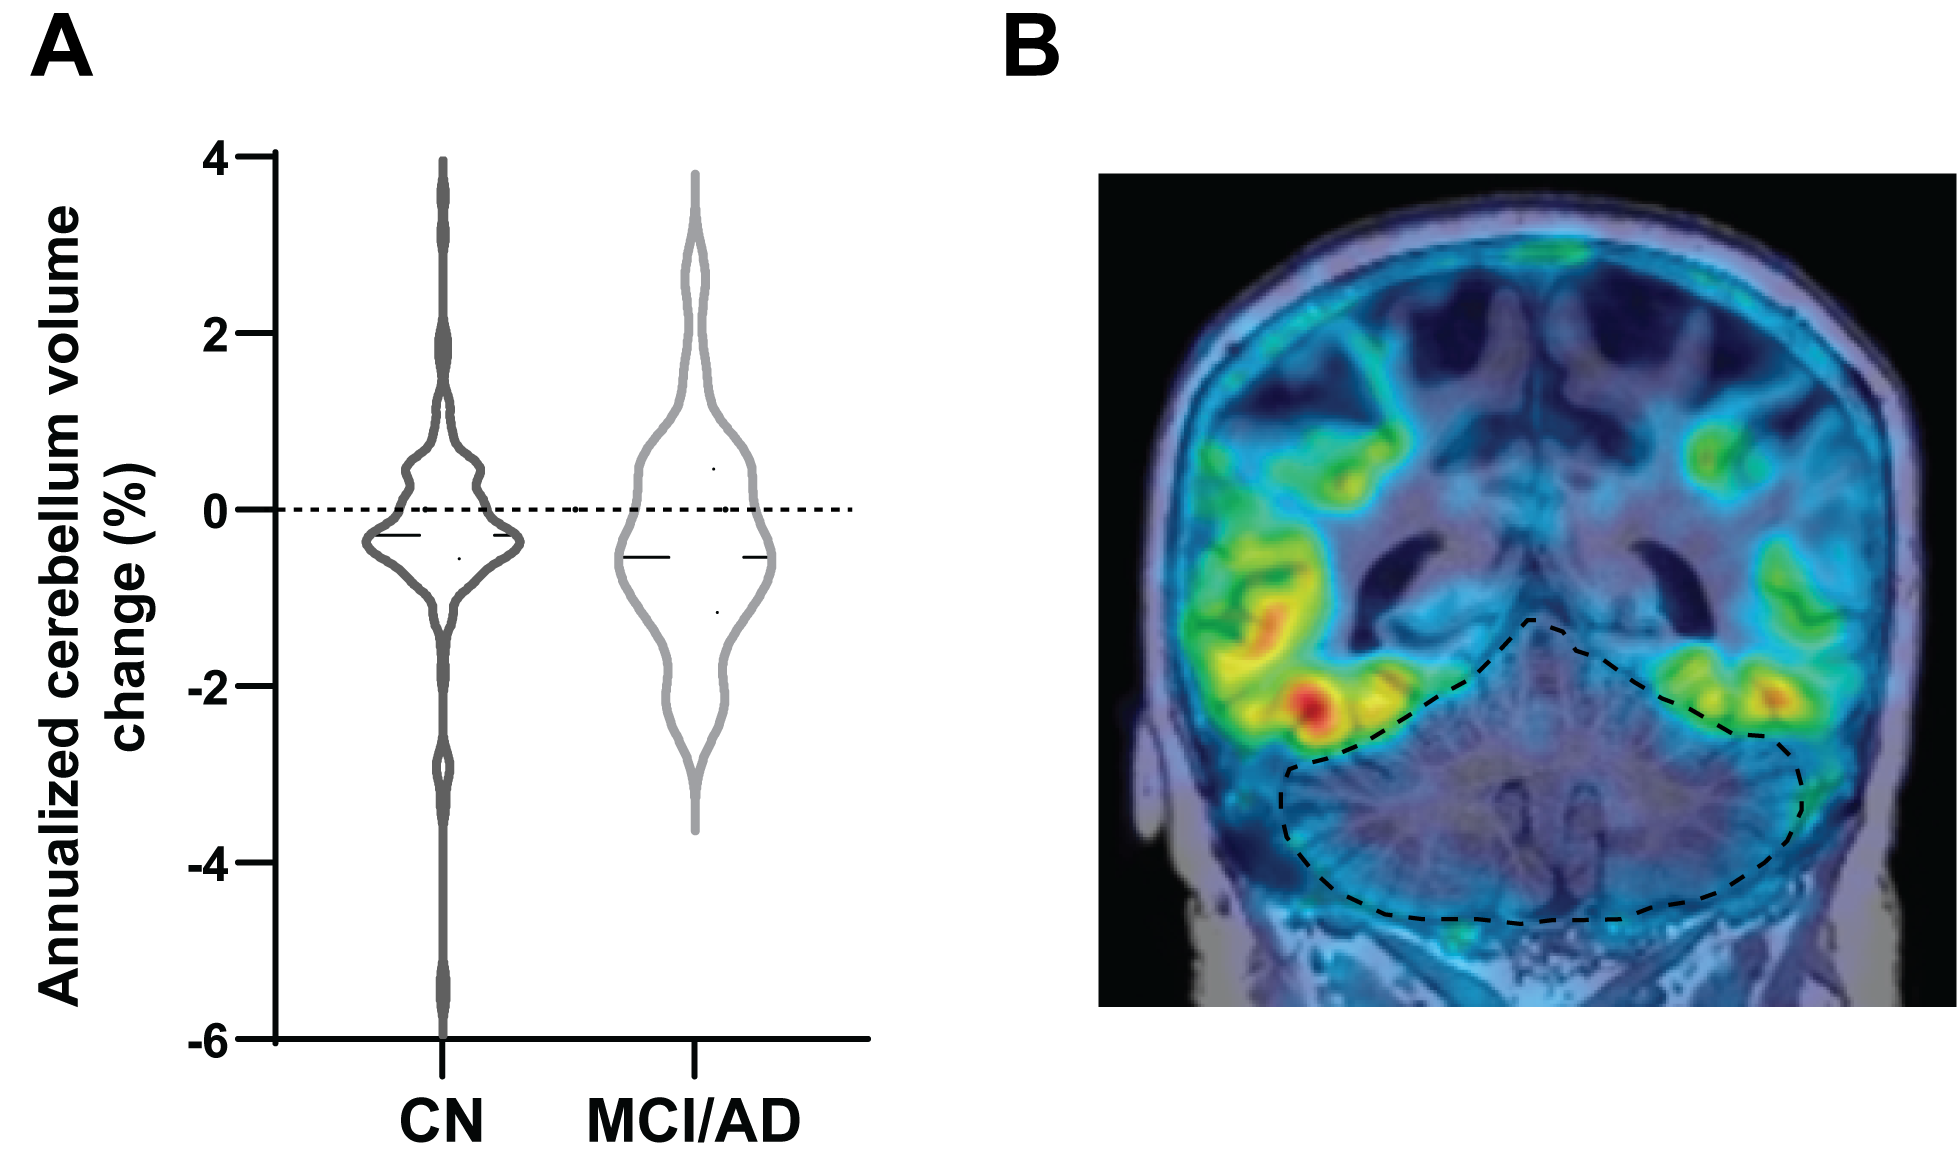
Association between baseline regional volume and AD stage was investigated. While no relationships were observed for raw gray matter (GM) volume for any of the regions considered, significant associations were shown following normalization by total brain volume. The normalization removed the confounding effect of overall brain size, correlated with gender (p<10-11) and other covariates. Notably, a highly significant (ANOVA p=1.1x10⁻⁷) decrease in normalized MT GM between CN-MCI-AD subjects (Figure 1A) was observed, holding also in the amyloid positive (n=34/12/9 CN/MCI/AD subjects) sub-cohort (p=0.0003), translating to AUC=0.79 in test set for prediction of CN status. Annualized MT atrophy (dMT) was significantly associated with disease stage (Figure 1B, p=1.1x10⁻⁵/0.01 all/amyloid+). Combining baseline MT and dMT lead to improved AUC=0.86 for CN status prediction in test set, while the variables were not correlated (Pearson r=-0.30), suggesting they provide complementary insight. Importantly, significant quantitative correlation was observed between MT annualized atrophy and baseline tauPET SUVr (Figure 2A, r=-0.61, p=0.004), driven largely by the MCI and AD subjects. Separate analysis was aimed at understanding the signature of amyloid positivity in CN subjects. Significantly higher baseline MT tauPET SUVr was observed in amyloid+ (Figure 2B, 1.24±0.02 vs. 1.02±0.07, p=0.017), coupled with lower normalized MT volume (amyloid+:0.0482±0.0005 vs. Amyloid-:0.0497±0.0003, p=0.015) suggesting early pathology emerging in amyloid+ subjects. Relevant for the use of MRI in tauPET quantification, we considered the atrophy in the cerebellum, a common tauPET reference region. While normally assumed to be mostly constant in size, heterogeneous changes in size of as much as 3%/year were observed in our analysis, mostly in AD and MCI, but also in CN subjects (Figure 3A). Partial volume effects at the edges of the cerebellum in a representative tauPET map (Figure 3B), highlighting the importance of accurate region segmentation.Discussion & Conclusions
Recent developments in AD therapeutic landscape, especially ongoing interest in anti-tau therapy, require detailed understanding of relationship between neurodegeneration, disease pathology and cognition, and robust methods to measure these associations in clinical trials. In this study a fast, automated pipeline suitable for this application was developed and applied in a large subject population, revealing how novel analysis of routine anatomical MRI can provide potential additional insight into disease status and amyloid pathology. Medial-temporal GM volume and its atrophy together and separately predict disease stage, hence showing promise for measurement of treatment induced disease modification during trial. The notable correlation shown between MT atrophy and tauPET SUVr further strengthens these observations, reinforcing the value of baseline tauPET screening in AD trials as more informative proxy for expected neurodegeneration than diagnosis alone, as well as providing the baseline expected neurodegeneration trajectory for potential interim treatment response monitoring through atrophy measurement. Additionally, Both MRI and tauPET were also found to be associated with amyloid status in cognitively healthy patients, offering potential insight into early AD pathology. Further studies planned in a large CN cohort will explore therapeutic implications of these findings. Furthermore, importance of longitudinal MRI, often captured independent of PET analysis in trials, needs to be recognized in context of tauPET quantification. Significant and heterogeneous changes observed in volume of cerebellum, reference region for MK-6240 quantifications, will affect quantification if not accounted for. Ongoing work will explore spatial relationships between longitudinal MRI and tauPET patterns.Acknowledgements
The contributions of the following institutions to data collection and curation are acknowledged:
Austin Health, Heidelberg, Victoria, Australia; Biogen Inc., Cambridge, MA, USA; Columbia University, New York City, NY, USA; University of Wisconsin, Madison, WI, USA.
References
[1] E. Hostetler et al., "Preclinical Characterization of 18F-MK-6240, a Promising PET Tracer for In Vivo Quantification of Human Neurofibrillary Tangles," Journal of nuclear medicine : official publication, Society of Nuclear Medicine, vol. 57, no. 10, 2016 Oct 2016, doi: 10.2967/jnumed.115.171678.
[2] C. Gaser, R. Dahnke, P. Thompson, F. Kurth, and E. Luders, "CAT – A Computational Anatomy Toolbox for the Analysis of Structural MRI Data," (in en), bioRxiv, 2022-06-13 2022, doi: 10.1101/2022.06.11.495736. [3] H. Braak, A. I, A. T, K. H, and D. T. K, "Staging of Alzheimer disease-associated neurofibrillary pathology using paraffin sections and immunocytochemistry," Acta neuropathologica, vol. 112, no. 4, 2006 Oct 2006, doi: 10.1007/s00401-006-0127-z. [2] C. Gaser, R. Dahnke, P. Thompson, F. Kurth, and E. Luders, "CAT – A Computational Anatomy Toolbox for the Analysis of Structural MRI Data," (in en), bioRxiv, 2022-06-13 2022, doi: 10.1101/2022.06.11.495736.
[3] H. Braak, A. I, A. T, K. H, and D. T. K, "Staging of Alzheimer disease-associated neurofibrillary pathology using paraffin sections and immunocytochemistry," Acta neuropathologica, vol. 112, no. 4, 2006 Oct 2006, doi: 10.1007/s00401-006-0127-z.
Figures