4046
Imaging of microvascular pulsatility using Fourier velocity encoding1University of California, San Diego, La Jolla, CA, United States
Synopsis
Keywords: Alzheimer's Disease, Velocity & Flow
Motivation: Vascular pulsatility has been hypothesized to be an important component in the etiology of microvascular damage in dementia. There are currently no well established methods for non-invasive mapping of pulsatility at the microvascular scale.
Goal(s): To provide a simple and robust means of mapping microvascular pulsatility in the brain.
Approach: We use Fourier velocity encoding to measure the velocity spectrum in each voxel, with retrospective gating to the cardiac cycle, producing quantitative metrics of pulsatility.
Results: Our preliminary data shows a clear modulation of microvascular flow across the cardiac cycle, with a spatial distribution that is consistent with vascular geometry.
Impact: In this work we demonstrate a simple and robust method for imaging vascular pulsatility in the brain. This provides a new metric for studying the role of pulsatility in dementia, and a potential new biomarker for microvascular damage.
Introduction
Vascular pulsatility is thought to contribute to the etiology of microvascular damage in dementia (1). In order to provide a means to study this hypothesis as well as potential biomarkers, non-invasive techniques for measuring pulsatility and the related metric of vascular compliance have been sought. These include phase contrast (2) and ASL (3,4) based methods for macrovascular compliance, and Velocity Selective ASL for microvascular pulsatility (5). We demonstrate here a simple imaging method that can in principle map pulsatility spanning from large vessels to spatially unresolved micro vessels, using Fourier Velocity Encoding (FVE) (6,7).Methods
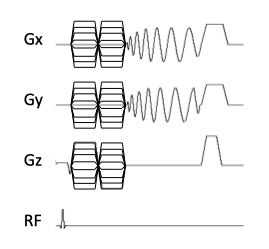
The pulse sequence used is shown in Figure 1. FVE was used with a gradient echo single shot spiral readout and 3.75 x 3.75 x 10mm resolution. The flip angle was 25°, TR was 100ms, and 64 velocity encodes were used with a velocity FOV and resolution of 16cm/s and 0.5cm/s, respectively. 0.5cm/s corresponds to arterioles in the 20-50μm range. 20 samples of each Kv encode were acquired in a single axial slice for a total of 1280 images in 128s. Retrospective gating was applied using a pulse oximeter signal and gridding to 10 cardiac phases using a triangular convolution kernel. Images were then Fourier transformed along Kv to obtain velocity spectra in each voxel.Results
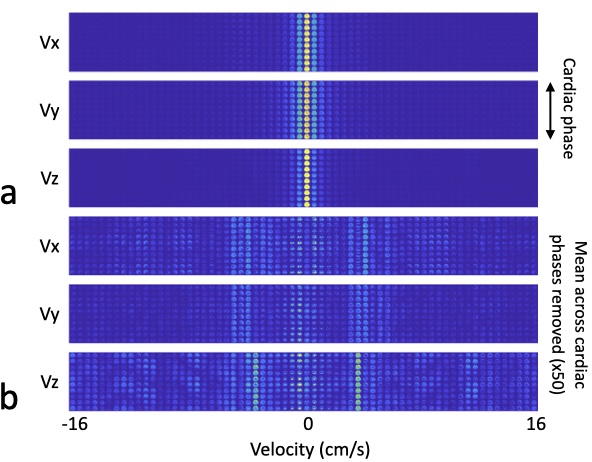
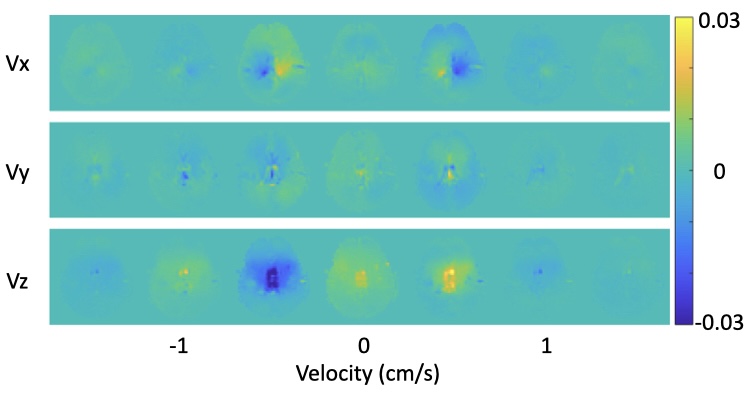
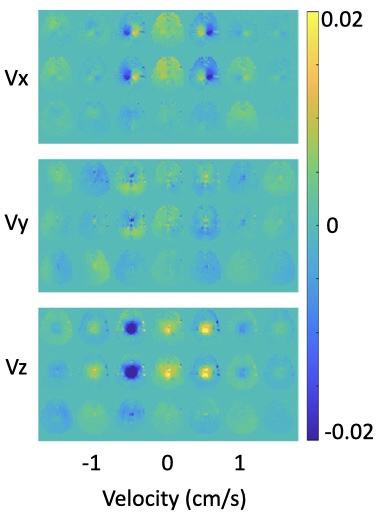
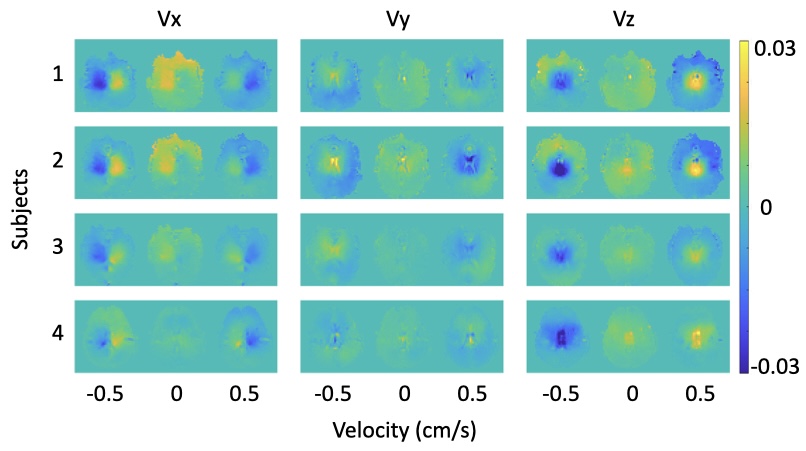
Velocity spectra for X, Y, and Z velocity encoding are shown in Figure 2a, displayed as images across the velocity spectrum and across cardiac phases. The magnitude of the signals in the 0.5cm/s velocity bin were too large to be true measurements of blood volume in those bins, as they were on the order of 30% of the signal in the V=0 bin, which should represent the static tissue. The same spectra are shown in Figure 2b with the mean across the cardiac phases removed. Many of the signals at high velocity appear to be artifactual, as they are relatively uniform across the entire brain. The source of these artifacts is under investigation. However, in the velocity bins between -2cm/s and 2cm/s there are signals that have a spatial distribution that appear to be physiological. These are shown in greater detail in Figure 3, and demonstrate antisymmetrical flow pulsatility across the midline in the X (left/right) flow direction, a more symmetrical distribution for Y (anterior/posterior) flow, and central flow in the superior direction for Z encoded flow. Test-retest repeatability is shown in Figure 4 from a different scan session, and yielded qualitatively good repeatability in low velocity ranges. Data across 4 subjects is shown in Figure 5.Discussion
These preliminary data show that a simple retrospectively gated FVE imaging method can provide data on vascular pulsatility in vessels that are not spatially resolved. This allows for the investigation of vascular pulsatility throughout the vascular tree, with the possibility of identifying ranges of velocity and vessel size that are of particular relevance to the development of pathology. While these preliminary data are promising, there are at least two types of artefact that contaminate the data. One is the spurious signals at high velocity noted above, and another is a phase distortion across Kv that is likely due to eddy currents. This results in a blurring of the V=0 peak in the spectrum that contaminates the neighboring low velocity bins, though it probably does not grossly affect the measurements of absolute pulsatility shown here. This artifact occurs in stationary phantoms, and may be addressable using eddy current insensitive velocity encoding gradients, or removed in post processing, since it is a static effect.Acknowledgements
No acknowledgement found.References
1. Avolio A, Kim MO, Adji A, Gangoda S, Avadhanam B, Tan I, Butlin M. Cerebral Haemodynamics: Effects of Systemic Arterial Pulsatile Function and Hypertension. Curr Hypertens Rep. 2018 Mar 19;20(3):20.
2. Heidari Pahlavian S, Cen SY, Bi X, Wang DJJ, Chui HC, Yan L. Assessment of carotid stiffness by measuring carotid pulse wave velocity using a single-slice oblique-sagittal phase-contrast MRI. Magn Reson Med. 2021 Jul;86(1):442-455.
3. Yan L, Liu CY, Smith RX, Jog M, Langham M, Krasileva K, Chen Y, Ringman JM, Wang DJJ. Assessing intracranial vascular compliance using dynamic arterial spin labeling. Neuroimage. 2016 Jan 1;124(Pt A):433-441.
4. Warnert EA, Murphy K, Hall JE, Wise RG. Noninvasive assessment of arterial compliance of human cerebral arteries with short inversion time arterial spin labeling. J Cereb Blood Flow Metab. 2015 Mar;35(3):461-8.
5. Chen, C., Barnes, R.A., Wong, E.C., Liu, T.T., Bolar, D.S., 2023. Measuring Microvascular Pulsatility with Short Bolus Duration (τ) VSASL, in: Proceedings of the 32nd Annual Scientific Meeting of the ISMRM, Toronto. p. 2757.
6. Moran PR. A flow velocity zeugmatographic interlace for NMR imaging in humans. Magn Reson Imaging. 1982;1(4):197-203.
7. Carvalho JL, Nayak KS. Rapid quantitation of cardiovascular flow using slice-selective fourier velocity encoding with spiral readouts. Magn Reson Med. 2007 Apr;57(4):639-46.
Figures