4044
Large-scale dynamic functional connectivity alterations in subjective cognitive decline: a rs-fMRI study on 5T MRI1Department of Radiology, The Affiliated Drum Tower Hospital of Nanjing University Medical School, Nanjing, China, 2Paul C. Lauterbur Research Center for Biomedical Imaging, Shenzhen Institute of Advanced Technology, Chinese Academy of Sciences, Shenzhen, China, 3Department of Radiology, Peking University Shenzhen Hospital, Shenzhen, China
Synopsis
Keywords: Alzheimer's Disease, Alzheimer's Disease, 5TMRI, Dynamic Functional Connectivity, Independent Component Analysis
Motivation: Subjective cognitive decline (SCD) is considered to be the best window period for early diagnosis and intervention of Alzheimer’s disease (AD). However, large-scale dynamic functional connectivity (DFC) alterations in this stage remain unclear.
Goal(s): To assess alterations in large-scale DFC in SCD patients on 5T MRI.
Approach: With a sliding-window approach and k-means clustering based on independent component analysis, rs-fMRI of high spatial-temporal dimension was used to evaluate large-scale DFC properties in SCD and normal control (NC) on 5T MRI.
Results: Four distinct functional states were identified. DFC properties were statistically significantly different between SCD and NC in state 2 and state 3.
Impact: Our study is the first successful attempt in fMRI of high spatio-temporal dimension on 5T MRI datasets. Altered temporal properties in large-scale DFC may serve as sensitive neuroimaging biomarkers for the preclinical detection of individuals with incipient AD.
Introduction and Motivation
Alzheimer's disease (AD) is a global public health concern [1]. Subjective cognitive decline (SCD) is the preclinical stage of AD, which is considered to be the best window for early diagnosis and intervention of AD[2]. Resting-state fMRI (rs-fMRI) is an effective non-invasive method for exploring the neural mechanisms of neurological diseases[3]. Dynamic functional connectivity (DFC) based on rs-fMRI is a new concept focusing on the dynamic features and patterns of brain networks, which provides a powerful tool for gaining novel insight into neurological diseases[4]. A new paradigm is emerging in cognitive neuroscience that emphasizes instead the conjoint function of brain areas working together as large-scale networks[5]. Recently, 5T MRI systems have been developed providing higher spatial and temporal resolution[6]. However, large-scale dynamic functional connectivity alterations in SCD remain unclear. The purpose of this work is to assess alterations in large-scale DFC properties of high spatial-temporal dimension in SCD on 5T MRI.Methods
Participants: A total of 34 SCD subjects and 42 NC subjects recruited from the community were included in this study. The written informed consent was obtained from each participant.Neuropsychological Assessment: All subjects underwent a standardized neuropsychological test battery performed by an experienced psychologist shown in Table 1.
Image Acquisition: MRI examination was performed with a 5.0-Tesla MRI scanner (uMR Jupiter, United Imaging Healthcare, Shanghai, China) with a 48-channel phased-array coil. The detailed fMRI parameters were as follows: slice thickness = 2 mm, the field of view (FOV) = 208 × 208 mm2, echo time (TE) = 26.5 ms, repetition time (TR) = 1000 ms, number of slices =52, voxel size = 2mm×2mm×2mm with no gap. In total, 460 volumes were obtained. High-resolution 3DT1-weighted structural images were acquired with the following parameters: 560 sagittal slices, FOV = 256 mm × 256 mm, slice thickness = 0.5mm, TR=9.9ms, TE=3.40ms, and voxel size=0.5 mm×0.5mm×0.5 mm.
rs-fMRI data preprocessing: Preprocessing of the rs-fMRI data was performed using the advanced version of rs-fMRI Data Processing Assistant (DPARSFA, version 5.3, http://www.restfmri.net) based on the MATLAB platform (The Math Works, Inc., Natick, MA, USA)[7].
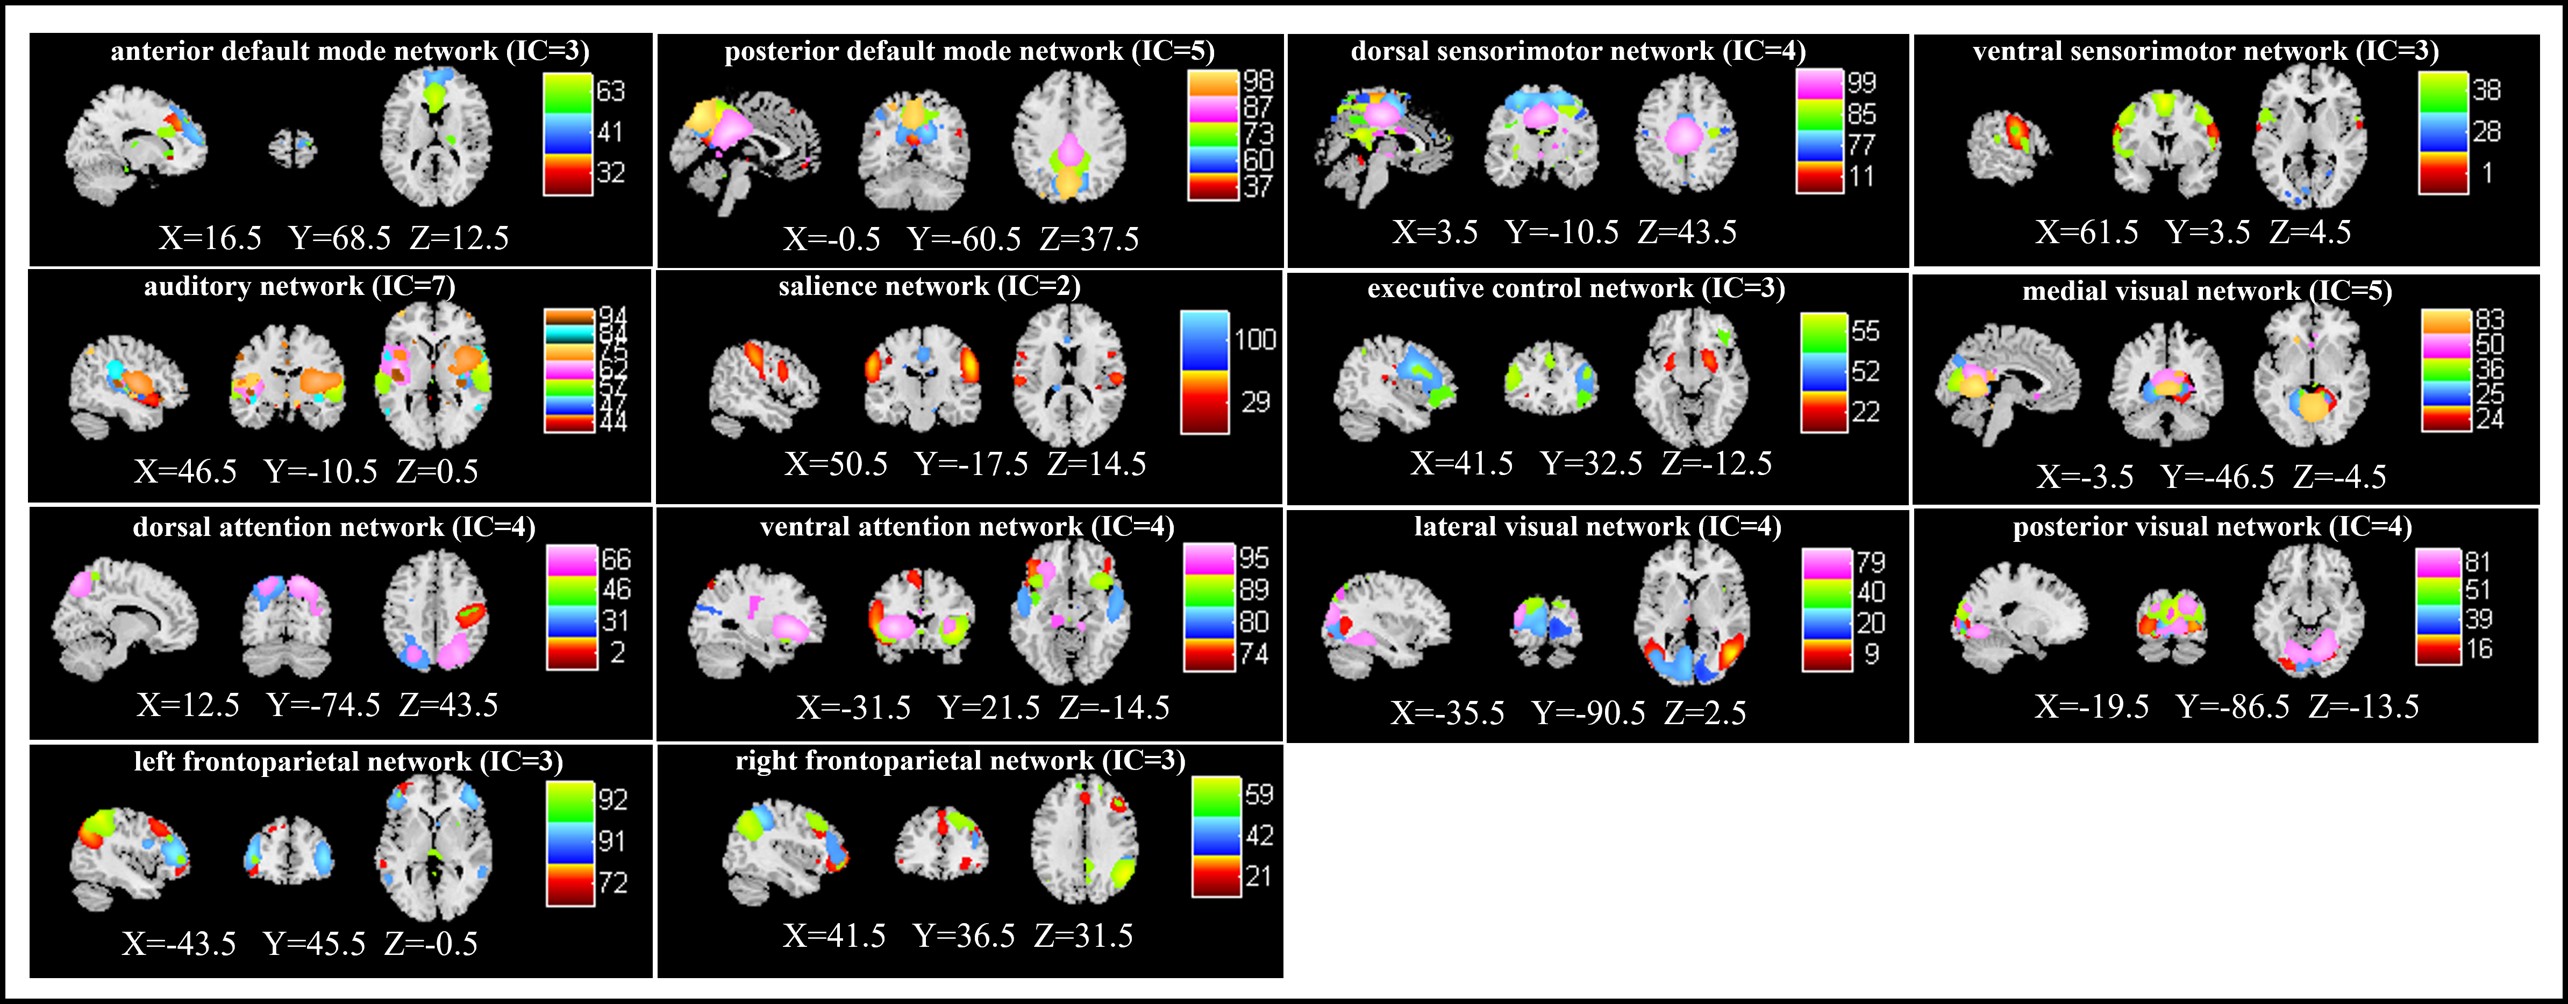
Group Independent Component Analysis: After rs-fMRI data preprocessing, spatial ICA was conducted to parcellate the data of all subjects with Group ICA of fMRI Toolbox (GIFT) (mialab.mrn.org/software/gift/)[8]. The participant data were decomposed into 14 functional networks exhibiting unique time course profiles. This was achieved by using subject-specific and group-level data reduction steps. Based on the spatial correlation values between the components and the network template[9], the remaining 54 ICs were sorted and rearranged into 14 functional networks shown in Figure 1.
Dynamic Functional Connectivity Analysis: The DFC analysis process was implemented using the DFC network toolbox in GIFT with the sliding window approach. The rs-fMRI data were divided into windows of 44 TR(44s) size with Gaussianσ= 6 TRs and the step long was 2 TR size[10].
Clustering Analysis and Calculation of Temporal Properties and FC Strength: We used all window FC matrices across all participants to estimate DFC states. The k-means cluster analysis was repeated 100 times, and the Euclidean distance was used to measure the similarity between the FC matrices and regroup them into different clusters. We investigated the temporal properties of DFC states by calculating the following parameters: “mean dwell time”, “fractional windows” and “number of transitions”.
Statistical Analysis: Clinical data were statistically analyzed using SPSS software version 26.0 (Statistical Programme for the Social Sciences, SPSS Inc., Chicago, IL). Two-sample t-tests were used to compare age, years of education, and cognitive scores, while gender and risk factors were calculated using chi-square tests. We also calculated the partial correlations between the altered DFC temporal properties and cognitive performances.
Results
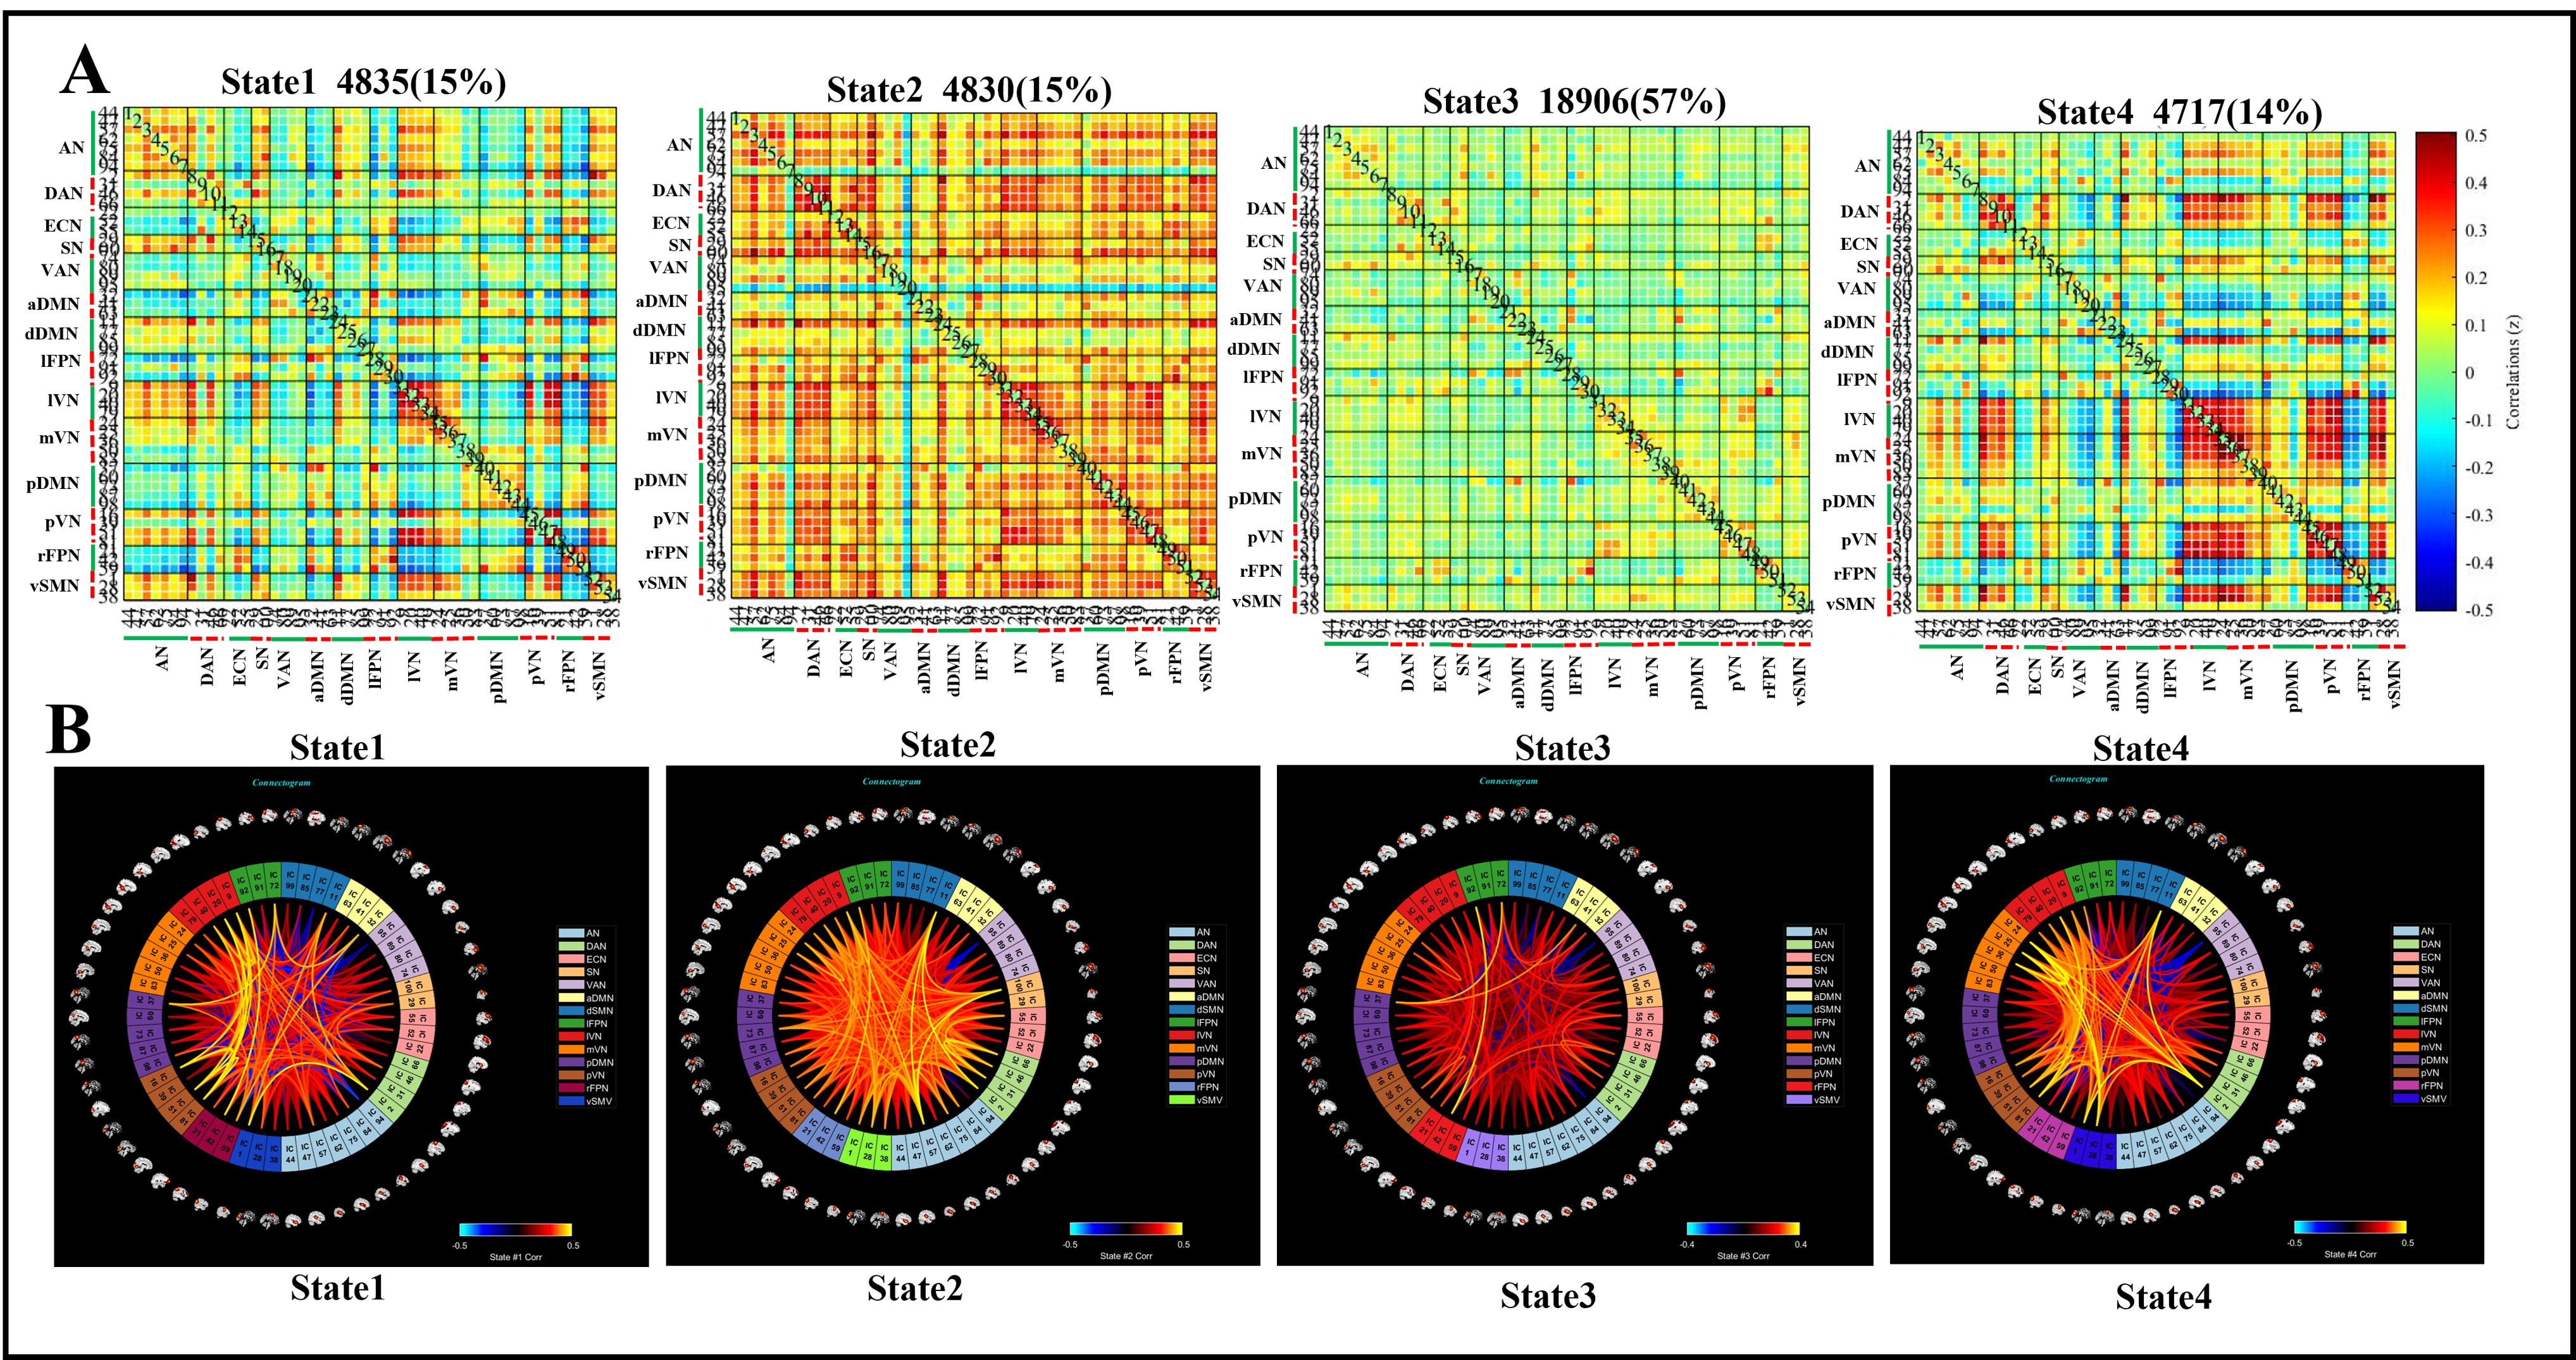
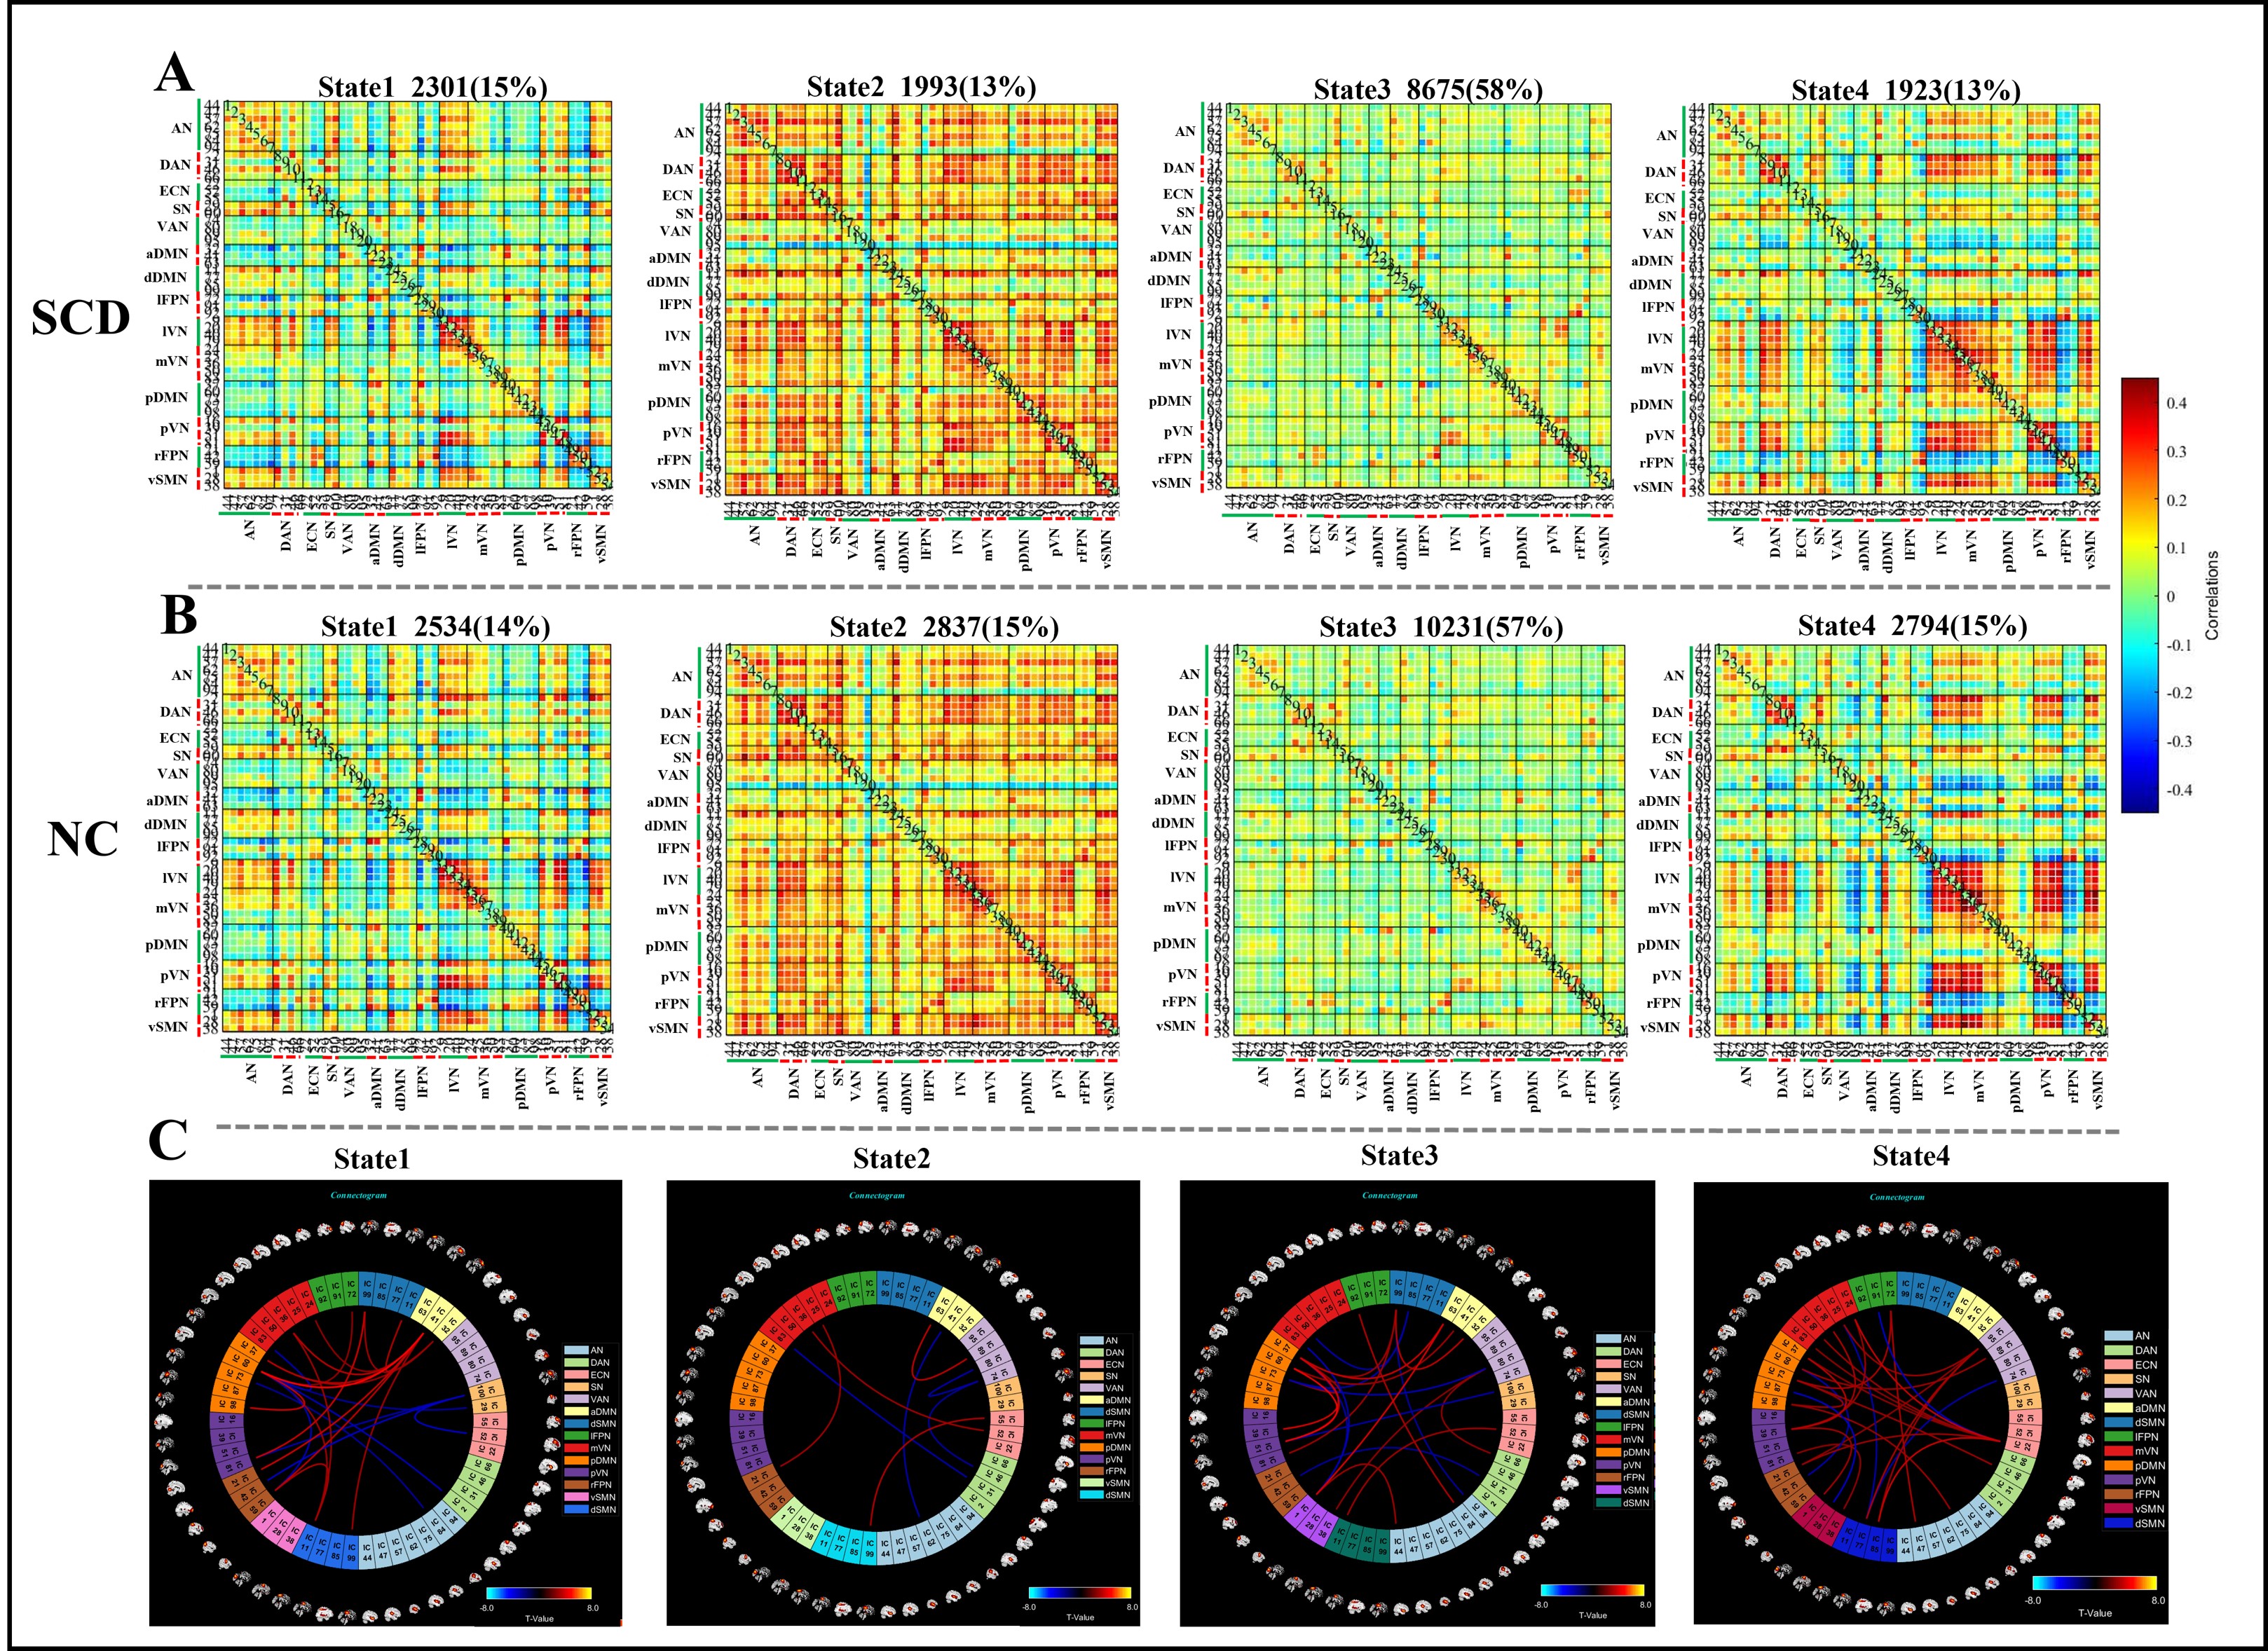
A dynamic analysis of all included subjects suggested four distinct functional connectivity states shown in Figure 2. Compared with the NC group, the SCD group had fewer fractional windows and shorter mean dwell times in State 2 and State 3. The number of transitions between state1 and state3 was significantly reduced and between state2 and state4 was significantly increased in the SCD group compared to the NC group shown in Figure 3 and Table 2. Moreover, there was a significant difference in the FC strength between the two groups, and the altered temporal properties of DFC were significantly related to cognitive performance shown in Table 3.Conclusion
Our findings indicated that 5TMRI can provide fMRI data with high spatial-temporal dimensions. The large-scale DFC network reconfiguration in the SCD stage, may underlie the early cognitive decline in SCD subjects and serve as sensitive neuroimaging biomarkers for the preclinical detection of individuals with incipient AD.Acknowledgements
The study was partially supported by the National Science and Technology Innovation 2030-Major program of "Brain Science and Brain-Like Research" (2022ZD0211800), the National Natural Science Foundation of China (82330059), the Key Laboratory for Magnetic Resonance and Multimodality Imaging of Guangdong Province(2023B1212060052) and Shenzhen Science and Technology Program (KCXFZ20211020163408012).References
[1] Dubois B, Villain N, Frisoni GB, et al. Clinical diagnosis of Alzheimer's disease: recommendations of the International Working Group. Lancet Neurol. 2021;20(6):484-496. doi:10.1016/S1474-4422(21)00066-1IF: 48.0 Q1 .
[2] Scheltens P, De Strooper B, Kivipelto M, et al. Alzheimer's disease. Lancet. 2021;397(10284):1577-1590. doi:10.1016/S0140-6736(20)32205-4IF: 168.9 Q1 .
[3] Guerra-Carrillo B, Mackey AP, Bunge SA. Resting-state fMRI: a window into human brain plasticity. Neuroscientist. 2014; 20(5): 522-533.doi:10.1177/1073858414524442IF: 5.6 Q1 .
[4] Dautricourt S, Gonneaud J, Landeau B, et al. Dynamic functional connectivity patterns associated with dementia risk. Alzheimers Res Ther. 2022;14(1):72. Published 2022 May 23. doi:10.1186/s13195-022-01006-7IF: 9.0 Q1 .
[5] Bressler SL, Menon V. Large-scale brain networks in cognition: emerging methods and principles. Trends Cogn Sci. 2010;14(6):277-290. doi:10.1016/j.tics.2010.04.004IF: 19.9 Q1 .
[6] Shi Z, Zhao X, Zhu S, et al. Time-of-Flight Intracranial MRA at 3 T versus 5 T versus 7 T: Visualization of Distal Small Cerebral Arteries [published correction appears in Radiology. 2022 Dec;305(3):E72]. Radiology. 2023;306(1):207-217.
[7] Yan CG, Wang XD, Zuo XN, Zang YF. DPABI: Data Processing & Analysis for (Resting-State) Brain Imaging. Neuroinformatics. 2016;14(3):339-351. doi:10.1007/s12021-016-9299-4IF: 3.0 Q3 doi:10.1148/radiol.220114IF: 19.7 Q1 .
[8] Erhardt EB, Rachakonda S, Bedrick EJ, Allen EA, Adali T, Calhoun VD. Comparison of multi-subject ICA methods for analysis of fMRI data. Hum Brain Mapp. 2011;32(12):2075-2095. doi:10.1002/hbm.21170IF: 4.8 Q1 .
[9] Shirer WR, Ryali S, Rykhlevskaia E, Menon V, Greicius MD. Decoding subject-driven cognitive states with whole-brain connectivity patterns. Cereb Cortex. 2012;22(1):158-165. doi:10.1093/cercor/bhr099IF: 3.7 Q2 .
[10] Fiorenzato E, Strafella AP, Kim J, et al. Dynamic functional connectivity changes associated with dementia in Parkinson's disease. Brain. 2019;142(9):2860-2872. doi:10.1093/brain/awz192IF: 14.5 Q1 .
Figures

TABLE 1: Demographic and clinical data

TABLE 2: Dynamic functional connectivity temporal properties
TABLE 3: Significant correlations between dynamic functional connectivity temporal properties and neuropsychological characteristics