4040
CSF Mimicking Phantom based Evaluation of CSF Flow using Phase Contrast and Diffusion Imaging on a Highly Efficient Head Only Gradient System1Medical Physics, University of Wisconsin-Madison, Madison, WI, United States, 2Mechanical Engineering, University of Wisconsin-Madison, Madison, WI, United States, 3Medical Physics, Alzheimer's Disease Research Center, University of Wisconsin-Madison, Madison, WI, United States, 4Mechanical Engineering, Radiology, University of Wisconsin-Madison, Madison, WI, United States, 5Medical Physics, Radiology, University of Wisconsin-Madison, Madison, WI, United States
Synopsis
Keywords: Alzheimer's Disease, Velocity & Flow, cerebrospinal fluid, low-venc
Motivation: Accurate characterization of CSF flow dynamics is necessary for understanding of brain metabolite clearance pathways.
Goal(s): To compare PC and DWI techniques for slow CSF flow velocity at 3T in a clinical scanner and a heald-only high performance gradient system using high fidelity ventricle phantoms.
Approach: Flow pump experiments were performed on silicone phantom at each of the scanners using varying Vencs.
Results: Greater velocity-to-noise ratio (VNR) gains and diffusion sensitivity were observed from scans collected on the high performance gradient system
Impact: Generating physiologically realistic cerebral ventricles phantom and leveraging high performance gradient systems can enable low CSF flow assessment for studying brain waste clearance pathways.
Introduction
Cerebrospinal fluid (CSF) flow is recognized to play an important role in brain metabolite waste clearance pathways, and is hypothesized to be impaired in proteinopathies such as Alzheimer's and Parkinson's disease1.Therefore, thorough characterization of CSF flow dynamics is essential for improved diagnostics and disease understanding. Unfortunately, typical CSF flow assessment using phase contrast (PC) MRI is limited to relatively fast CSF velocities (e.g. 5-20 cm/s) typically along major flow conduits. However, expected velocities associated with brain clearance pathways are much lower (<5cm/s) and in regions of interest with variable structure (e.g. subarachnoid space, perivascular spaces). Low velocity CSF flow with PC MRI is limited by hardware gradient strengths and slew rates when designing the desired velocity encoding gradients. To address this, CSF diffusion weighted imaging has been proposed but the relationship between diffusion and flow is complex. In this work, we compared PC and DWI techniques in 3T scanners including a clinical scanner and a high performance, head only gradient system (MAGNUS2), utilizing a novel ventricle phantom to study vascular and CSF flow coupling at very low CSF flow velocities.Methods
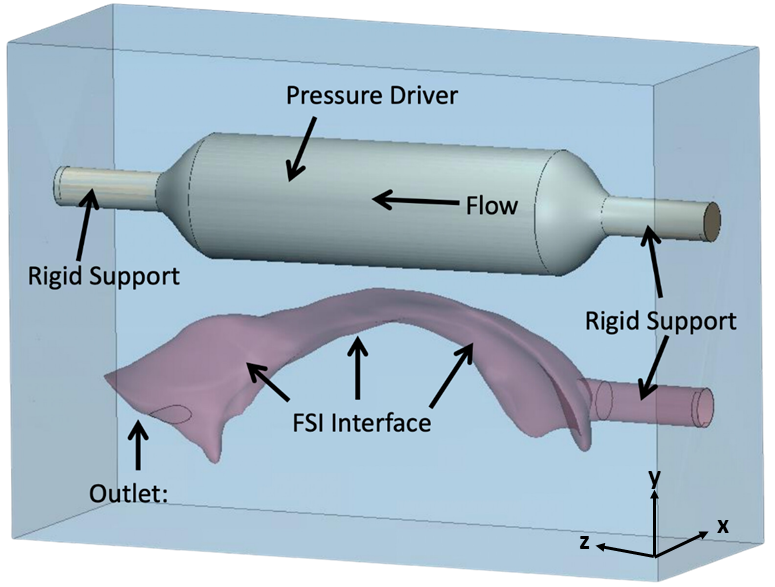
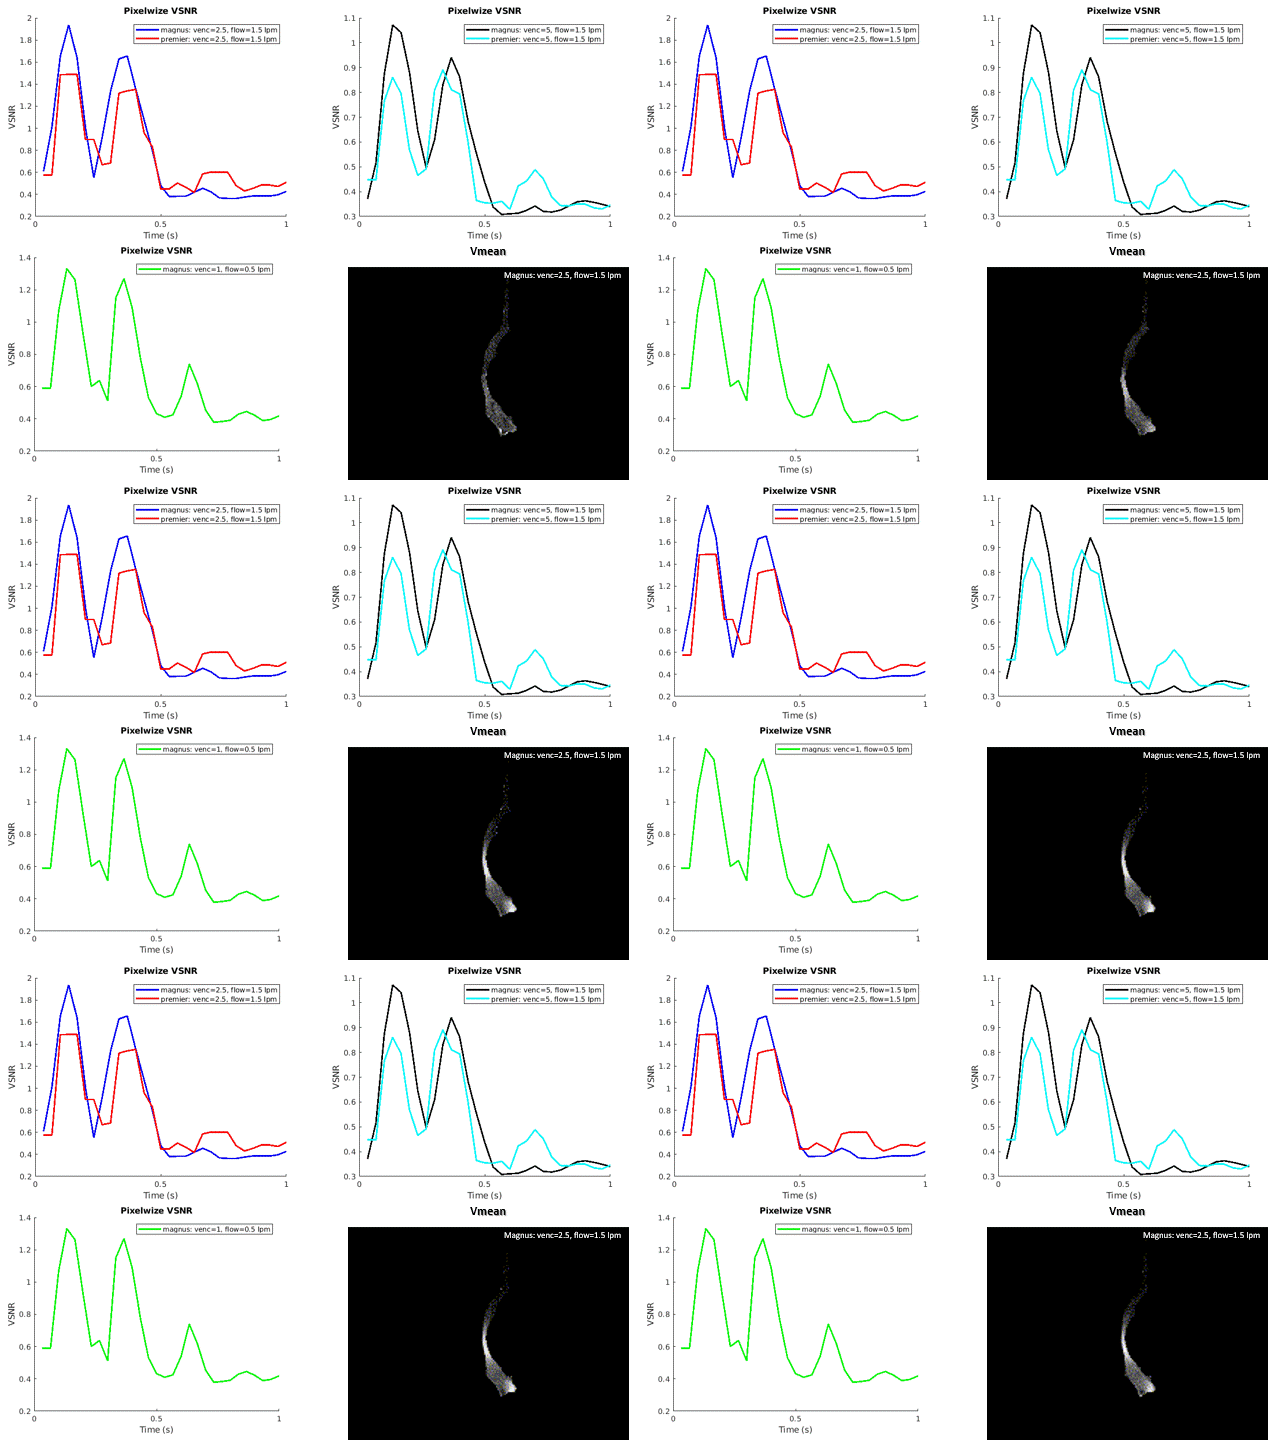
CSF mimicking flow was generated using a flow phantom (Fig.1.) consisting of a pressure driver and passive 3D printed ventricle, embedded in a block of silicon. Flow in the pressure driver is imparted using a pump (BDC PD-1100,BCD Laboratories, Wheat Ridge, CO) and an input 35% modulated sinusoidal waveform with an average flow rate of 1.5 L/min or 0.5 L/min is played with a period of 1s (to mimic a heart rate of 60bpm). Water travels from the pump located outside the scan room to the phantom, where it enters a high pressure driver to drive flow in the adjacent passive ventricle. 2D, three directional PC images were acquired on 3T systems (Signa Premier and MAGNUS, GE Healthcare) for Vencs of 5cm/s, 2cm/s, 0.5 cm/s (MAGNUS only). PC images were captured in ~80s per scan, 2mm in plane resolution, 4mm slice thickness, and 30 frames/cardiac cycle. For the clinical scan, this resulted in PC-MRI scans with TE/TR (Venc) of 6.4/10 (5cm/s) and 7.9/14.3 (2.5cm/s) for each Venc.The TE/TRs on the MAGNUS scanner were much lower with TE/TR = 4.2/6.8 (5cm/s), 5.1/7.8 (2.5cm/s), and 6.7/9.4 (1cm/s). Scans were repeated 10x, where the repetitions were used to calculate a pixel-wise velocity-to-noise (VNR) for each time frame.Cardiac gated diffusion images were acquired on both scanners and were repeated 3x to create standard deviations to use as normalization, leading to a relative signal measure over time. Relevant parameters include: b-value = 50s/mm², TE/TR = 43/2010ms, 1.25mm in plane resolution. Oscillatory velocities using PC were measured with respect to the simulated cardiac cycle along the 3D printed ventricle. This spatial dependence on fluid velocity was compared to a diffusion sequence, where the signal varies across the simulated cardiac cycle.Results
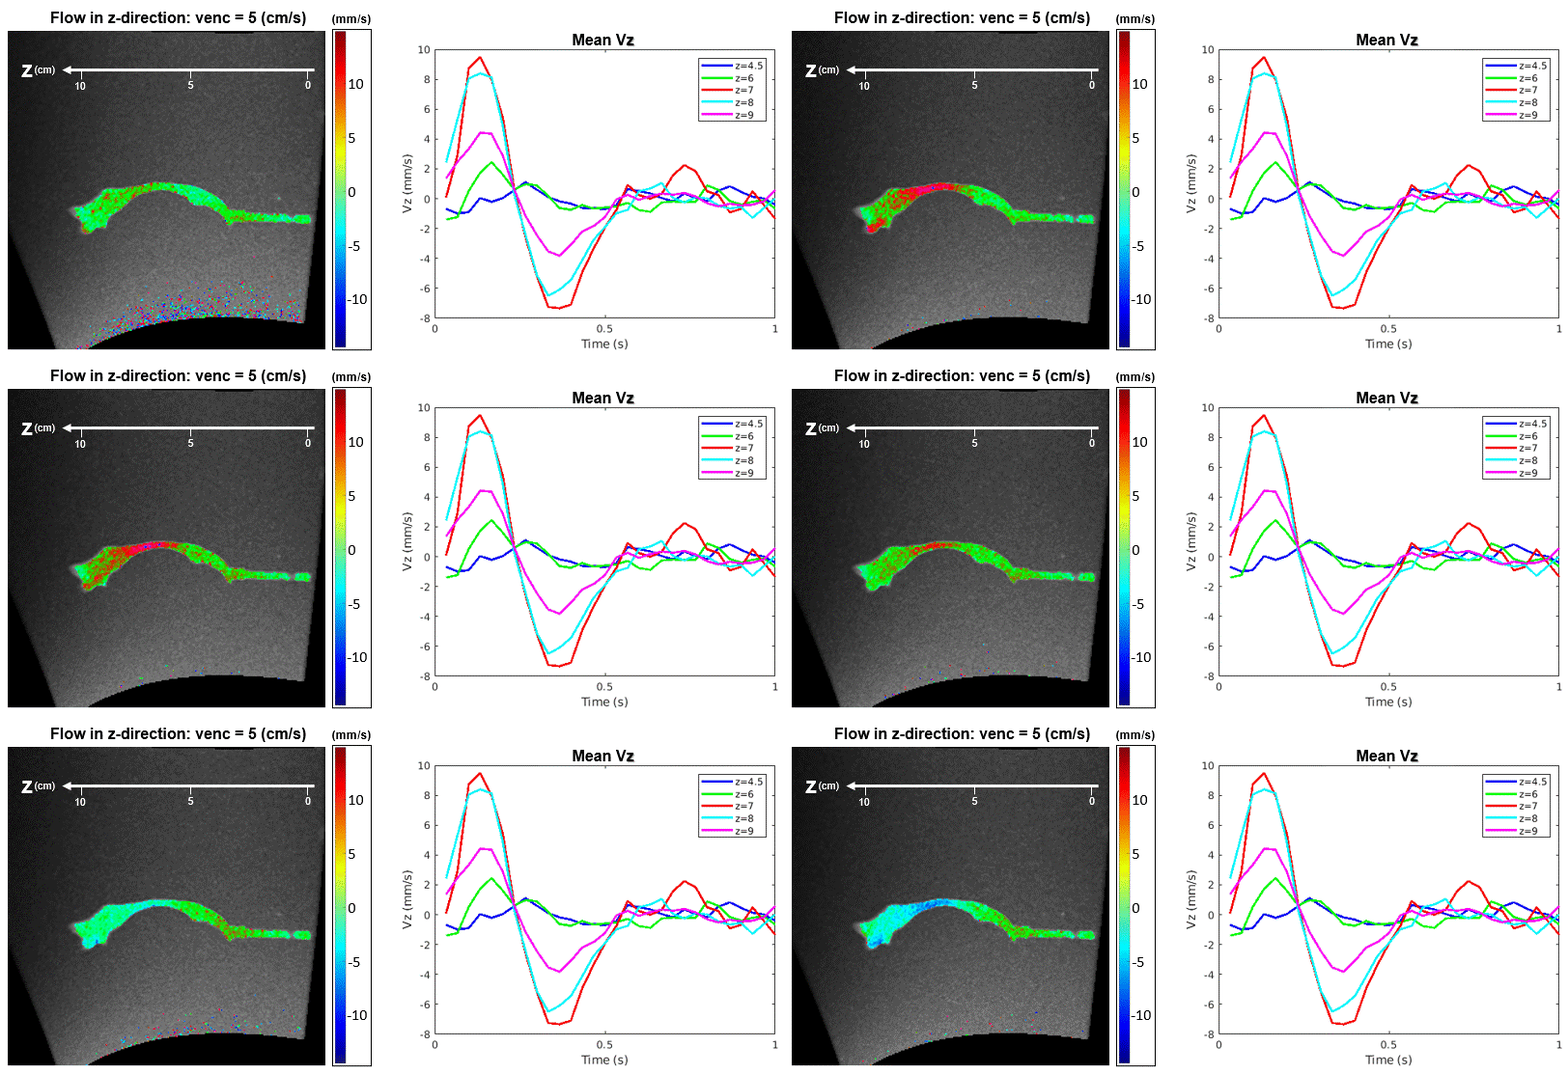
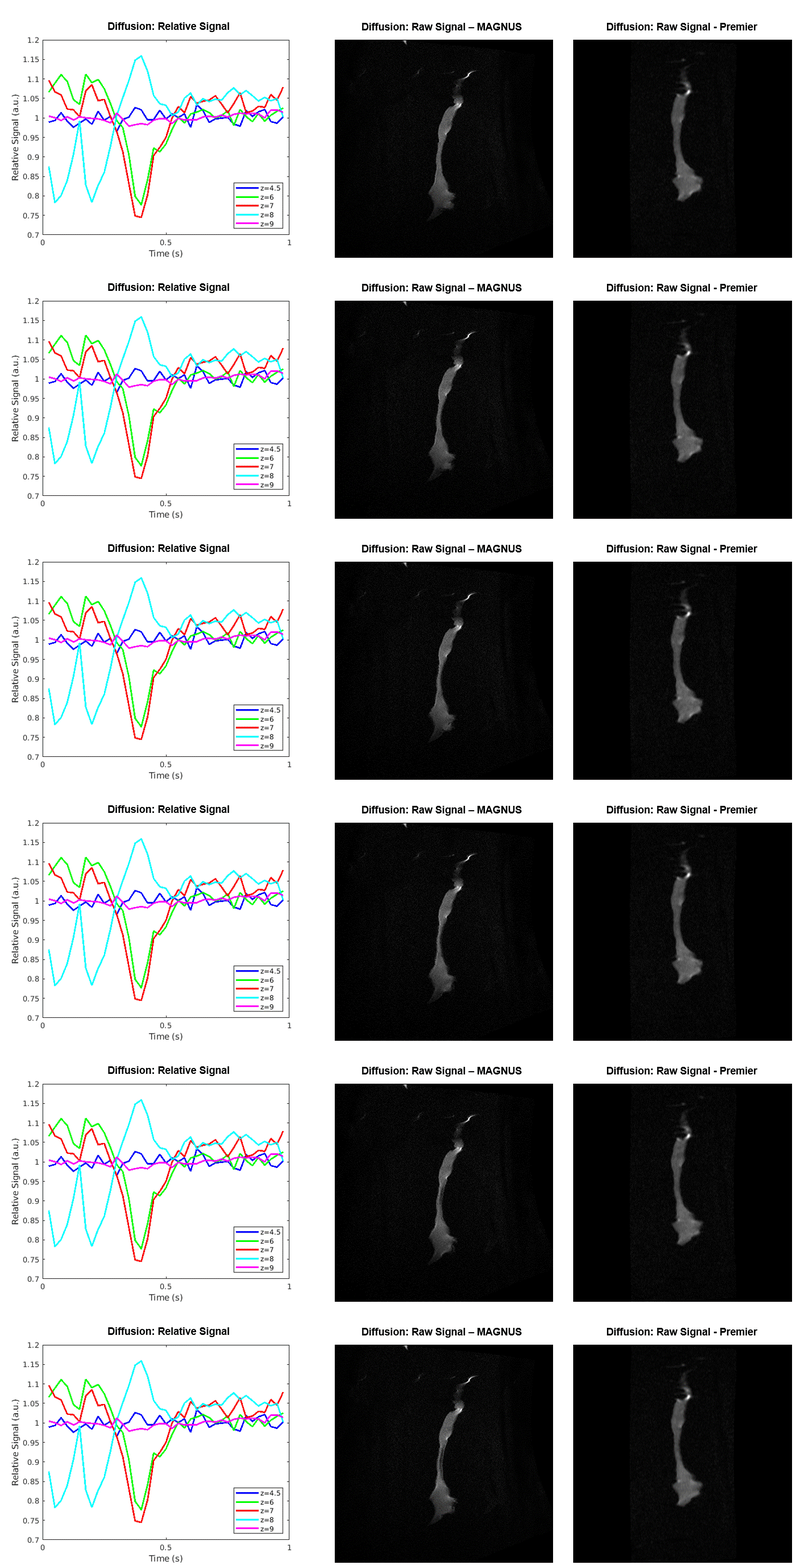
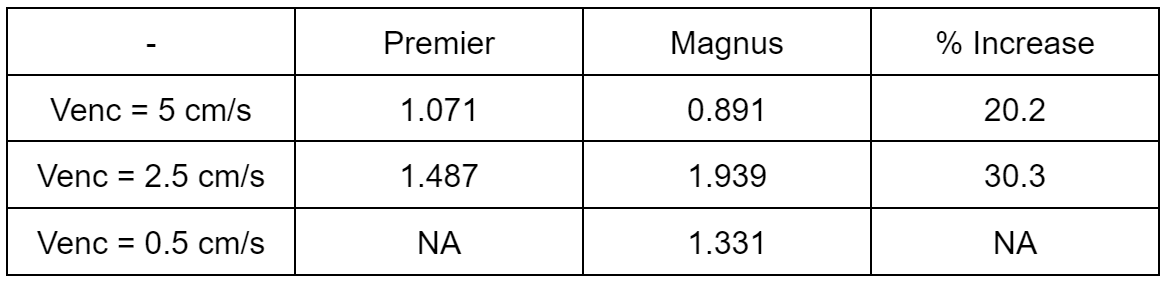
Results show an increase in maximum pixel-wise VNR using the MAGNUS System for PC imaging with both Venc = 5cm/s and 2.5cm/s (Fig.5). Additionally, MAGNUS was able to achieve similar VNR measurements for Venc = 0.5cm/s (flow was reduced from 1.5 to 0.5 lpm to mimic slower flow). VNR measures with respect to time were plotted (Fig 3.) to show changes in simulated cardiac cycle.The first 0.5 seconds in these plots correspond to when the pump is on, and the latter 0.5 seconds when the pump is off. Diffusion scans with MAGNUS show a higher relative signal when the pump is on verses off (Fig.4.), however PC measurements show that as position along the z-axis increases inside the phantom, velocity increases then decreases (reaching a maximum at z =7 (Fig.2.) This is not reproduced by the signal measures in the diffusion data.Discussion and Conclusion
In this preliminary work we compared PC scans at multiple Vencs and diffusion scans on two 3T systems including a clinical scanner and an ultra-high performance gradient system (MAGNUS) using a novel ventricle flow phantom. Overall, images from MAGNUS displayed higher levels of VNR and lower attainable Vencs (e.g. 0.5 cm/s). Sensitivity of diffusion data to cardiac variations induced by the flow pump were also greater on MAGNUS images. Subsequent studies will further evaluate the ability to measure slow CSF flow in MAGNUS using 3D techniques with efficient sampling strategies and realistic phantom models.Acknowledgements
We gratefully acknowledge funding support from NIH grants R01AG075788 and R21NS125094 and research support from GE Healthcare.References
1. Nedergaard M, Goldman SA. Glymphatic failure as a final common pathway to dementia. Science. 2020 Oct 2;370(6512):50-56. doi: 10.1126/science.abb8739.
2. Foo TKF, Tan ET, Vermilyea ME, Hua Y, Fiveland EW, Piel JE, Park K, Ricci J, Thompson PS, Graziani D, Conte G, Kagan A, Bai Y, Vasil C, Tarasek M, Yeo DTB, Snell F, Lee D, Dean A, DeMarco JK, Shih RY, Hood MN, Chae H, Ho VB. Highly efficient head-only magnetic field insert gradient coil for achieving simultaneous high gradient amplitude and slew rate at 3.0T (MAGNUS) for brain microstructure imaging. Magn Reson Med. 2020 Jun;83(6):2356-2369. doi: 10.1002/mrm.28087. Epub 2019 Nov 25.
Figures