4039
Longitudinal changes of in vivo Quantitative Susceptibility Mapping (QSM) in the 3xTg-AD mouse model of Alzheimer's disease1High Magnetic Field Laboratory, Hefei Institutes of Physical Science, Chinese Academy of Sciences, Hefei, China, 2iHuman Institute, ShanghaiTech University, Shanghai, China
Synopsis
Keywords: Quantitative Imaging, Alzheimer's Disease, Quantitative susceptibility mapping
Motivation: To investigate the longitudinal change of in vivo QSM of 3xTg-AD mice, age matched wile-type (WT) mice were used as a reference group.
Goal(s): The regional variation of in vivo QSM in 3xTg-AD mice, and how they change with ageing. To investigate the sensitivity of in vivo QSM to the pathophysiological changes in 3xTg-AD mice.
Approach: The 3xTg-AD and WT mice with 22 and 40 weeks old were scanned. A 3D multi-echo gradient echo sequence (mGRE) was acquired for the quantification of QSM.
Results: Notable differences in QSM values were observed between various brain regions across ages and genotypes.
Impact: The in vivo QSM of the mouse brain can be obtained within approximately 21 minutes of scanning time. Significant variations were observed between different age groups and genotypes in various brain regions closely associated with the pathophysiology of Alzheimer's disease.
Main text
IntroductionAlzheimer's disease (AD) is a chronic neurodegenerative disorder characterized by progressive cognitive decline, with its main pathological features being the gradual accumulation of β-amyloid (Aβ) plaques and neurofibrillary tangles (NFTs)1-4. The 3xTg-AD mouse model, which harbors three mutations associated with familial AD (APP Swedish, MAPT P301L, and PSEN1 M146V), is widely used in AD research5. Quantitative Susceptibility Mapping (QSM) can reveal changes related to pathophysiology such as myelination, iron deposition, Aβ deposition etc6. This study aimed to investigate the longitudinal changes of in vivo QSM of 3xTg-AD mice and explore the potential of in vivo QSM as a biomarker for AD pathophysiology. Age-matched wild type (WT) mice were measured as reference since age is a key factor in the development of AD.
Materials and methods
A total of forty female mice were utilized in this study (22wk: 10 3xTg-AD mice and 10 WT; 40wk: 10 3xTg-AD mice and 10 WT; procured from Beijing Vitalstar Biotechnology Co.,Ltd.). Magnetic resonance imaging (MRI) was conducted using a cross-coil configuration with a transmitter volume coil and a four-channel receiver mouse brain surface coil on a 9.4T Bruker system. The mice were anesthetized with intraperitoneal bolus injections of 25% urethane dissolved in distilled water (Sigma, U2500–100G) at a dosage of 0.7 ul/g divided into three separate doses. Body temperature was maintained using warm water, while respiration information and body temperature were monitored throughout the scan.
The 3D multi-echo gradient echo sequence (mGRE) was acquired for QSM calculation with the parameters: FOV=16×8×12 mm2, matrix=160×80×40, voxel size= 0.1×0.1×0.3 mm3, TR=100 ms, TE1=2.4ms, ΔTE=2.4 ms, 32 TEs, flip angle=23⁰, all echoes, NA=4, scan time=21min20sec.
Post-processing and image analysis
The QSM data was processed in Matlab (R2021b), which involved performing phase unwrapping, background field removal, and susceptibility calculation using the Morphology Enabled Dipole Inversion (MEDI) method7. Each individual parametric image was then co-registered to a reference image and segmented according to the C57BL6 mouse brain templates with AMBMC atlas (https://imaging.org.au/AMBMC/). Finally, the mean value of each 3D brain region was extracted for the entire brain.
Statistics
The statistical analysis was performed using Matlab, with normality testing conducted. Two-sample t-tests were utilized for normally distributed datasets, while rank sum tests were used for non-normally distributed data. A significance level of P<0.05 was considered to indicate a significant difference.
Results
The mean QSM images of these four groups are shown in Figure 1. A total of 27 bilateral brain regions are included in this atlas. The statistical comparisons are illustrated in Figure 2. At the age of 22 weeks, significant differences were observed in QSM values between AD and WT mice for the brain regions including Infralimbic area (ILA), Orbital area (ORB), Hippocampal formation (HPF), Pallidum (PAL), Hypothalamus (HY), and fiber tracts. Similarly, at the age of 40 weeks, significant differences were found in QSM values for Visceral area (VISC), Prelimbic area (PL), HPF, PAL, and cerebrospinal fluid (CSF). Notably, both HPF and PAL exhibited significantly different QSM values across both ages. Furthermore, changes in QSM with age were analyzed for both groups. As shown in Figure 2(C) and (D) for the AD group, significant alterations were detected with ageing in Ectorhinal area (ECT), Gustatory areas (GU), PAL, Perirhinal area (PERI), PL, Temporal association areas (TEa), and Thalamus (TH). Conversely, in the WT group only three brain regions demonstrated age-related significant differences: fiber tracts, PERI, and Posterior parietal association areas (PTLp). It is noteworthy that PERI exhibited changes in vivo QSM with age across both groups.
Discussion
The 3xTg-AD mice exhibit both Aβ plaque and NFTs pathology. Aβ deposition can be detected in certain brain regions as early as three to four months of age, while changes in tau occur after six months5. This study aimed to investigate and compare whole-brain QSM of 3xTg-AD and WT mice at different ages. In our study, we successfully obtained high-quality in vivo QSM data from the mice. Consistent with a previous in vivo QSM study on Tg-SwDI AD mice, we observed age-related changes in thalamus using in vivo QSM imaging8. These changes may be attributed to iron and Aβ deposition, as well as alterations in tissue microstructure associated with ageing and AD pathophysiology. Therefore, our findings suggest that in vivo QSM could serve as a biomarker for underlying pathophysiological alterations in 3xTg-AD mice.
Conclusion
In vivo QSM of 3xTg-AD mouse is practical. Several brain regions showed alternations in QSM across ages and genotypes. In vivo QSM might be used as a biomarker for the pathophysiology of AD.
Acknowledgements
This work was finally supported by these grants: Collaborative Key Foundation of Hefei Science Center Grant 2022HSC-CIP003 (QY), ShanghaiTech University, the Shanghai Municipal Government, National Natural Science Foundation of China Grant 81950410637 (GJT), and Grant 3210055 (HL). We thank Dr. Yi Wang, and Dr. Alexey Dimov for their suggestions on data analysis.
References
1. Hyman BT, Van Hoesen GW, Damasio AR, Barnes CL. Alzheimer's disease: cell-specific pathology isolates the hippocampal formation. Science. 1984;225(4667):1168-1170.
2. Wegmann S, Jung YJ, Chinnathambi S, Mandelkow EM, Mandelkow E, Muller DJ. Human Tau isoforms assemble into ribbon-like fibrils that display polymorphic structure and stability. The Journal of biological chemistry. 2010;285(35):27302-27313.
3. Braak H, Braak E. Neuropathological stageing of Alzheimer-related changes. Acta neuropathologica. 1991;82(4):239-259.
4. Kidd M. Paired helical filaments in electron microscopy of Alzheimer's disease. Nature. 1963;197:192-193.
5. Oddo S, Caccamo A, Shepherd JD, et al. Triple-transgenic model of Alzheimer's disease with plaques and tangles: intracellular Abeta and synaptic dysfunction. Neuron. 2003;39(3):409-421.
6. Haacke EM, Liu SF, Buch S, Zheng WL, Wu DM, Ye YQ. Quantitative susceptibility mapping: current status and future directions. Magnetic resonance imaging. 2015;33(1):1-25.
7. de Rochefort L, Liu T, Kressler B, et al. Quantitative Susceptibility Map Reconstruction from MR Phase Data Using Bayesian Regularization: Validation and Application to Brain Imaging. Magn Reson Med. 2010;63(1):194-206.
8. Gong NJ, Dibb R, Bulk M, van der Weerd L, Liu C. Imaging beta amyloid aggregation and iron accumulation in Alzheimer's disease using quantitative susceptibility mapping MRI. NeuroImage. 2019;191:176-185.
Figures
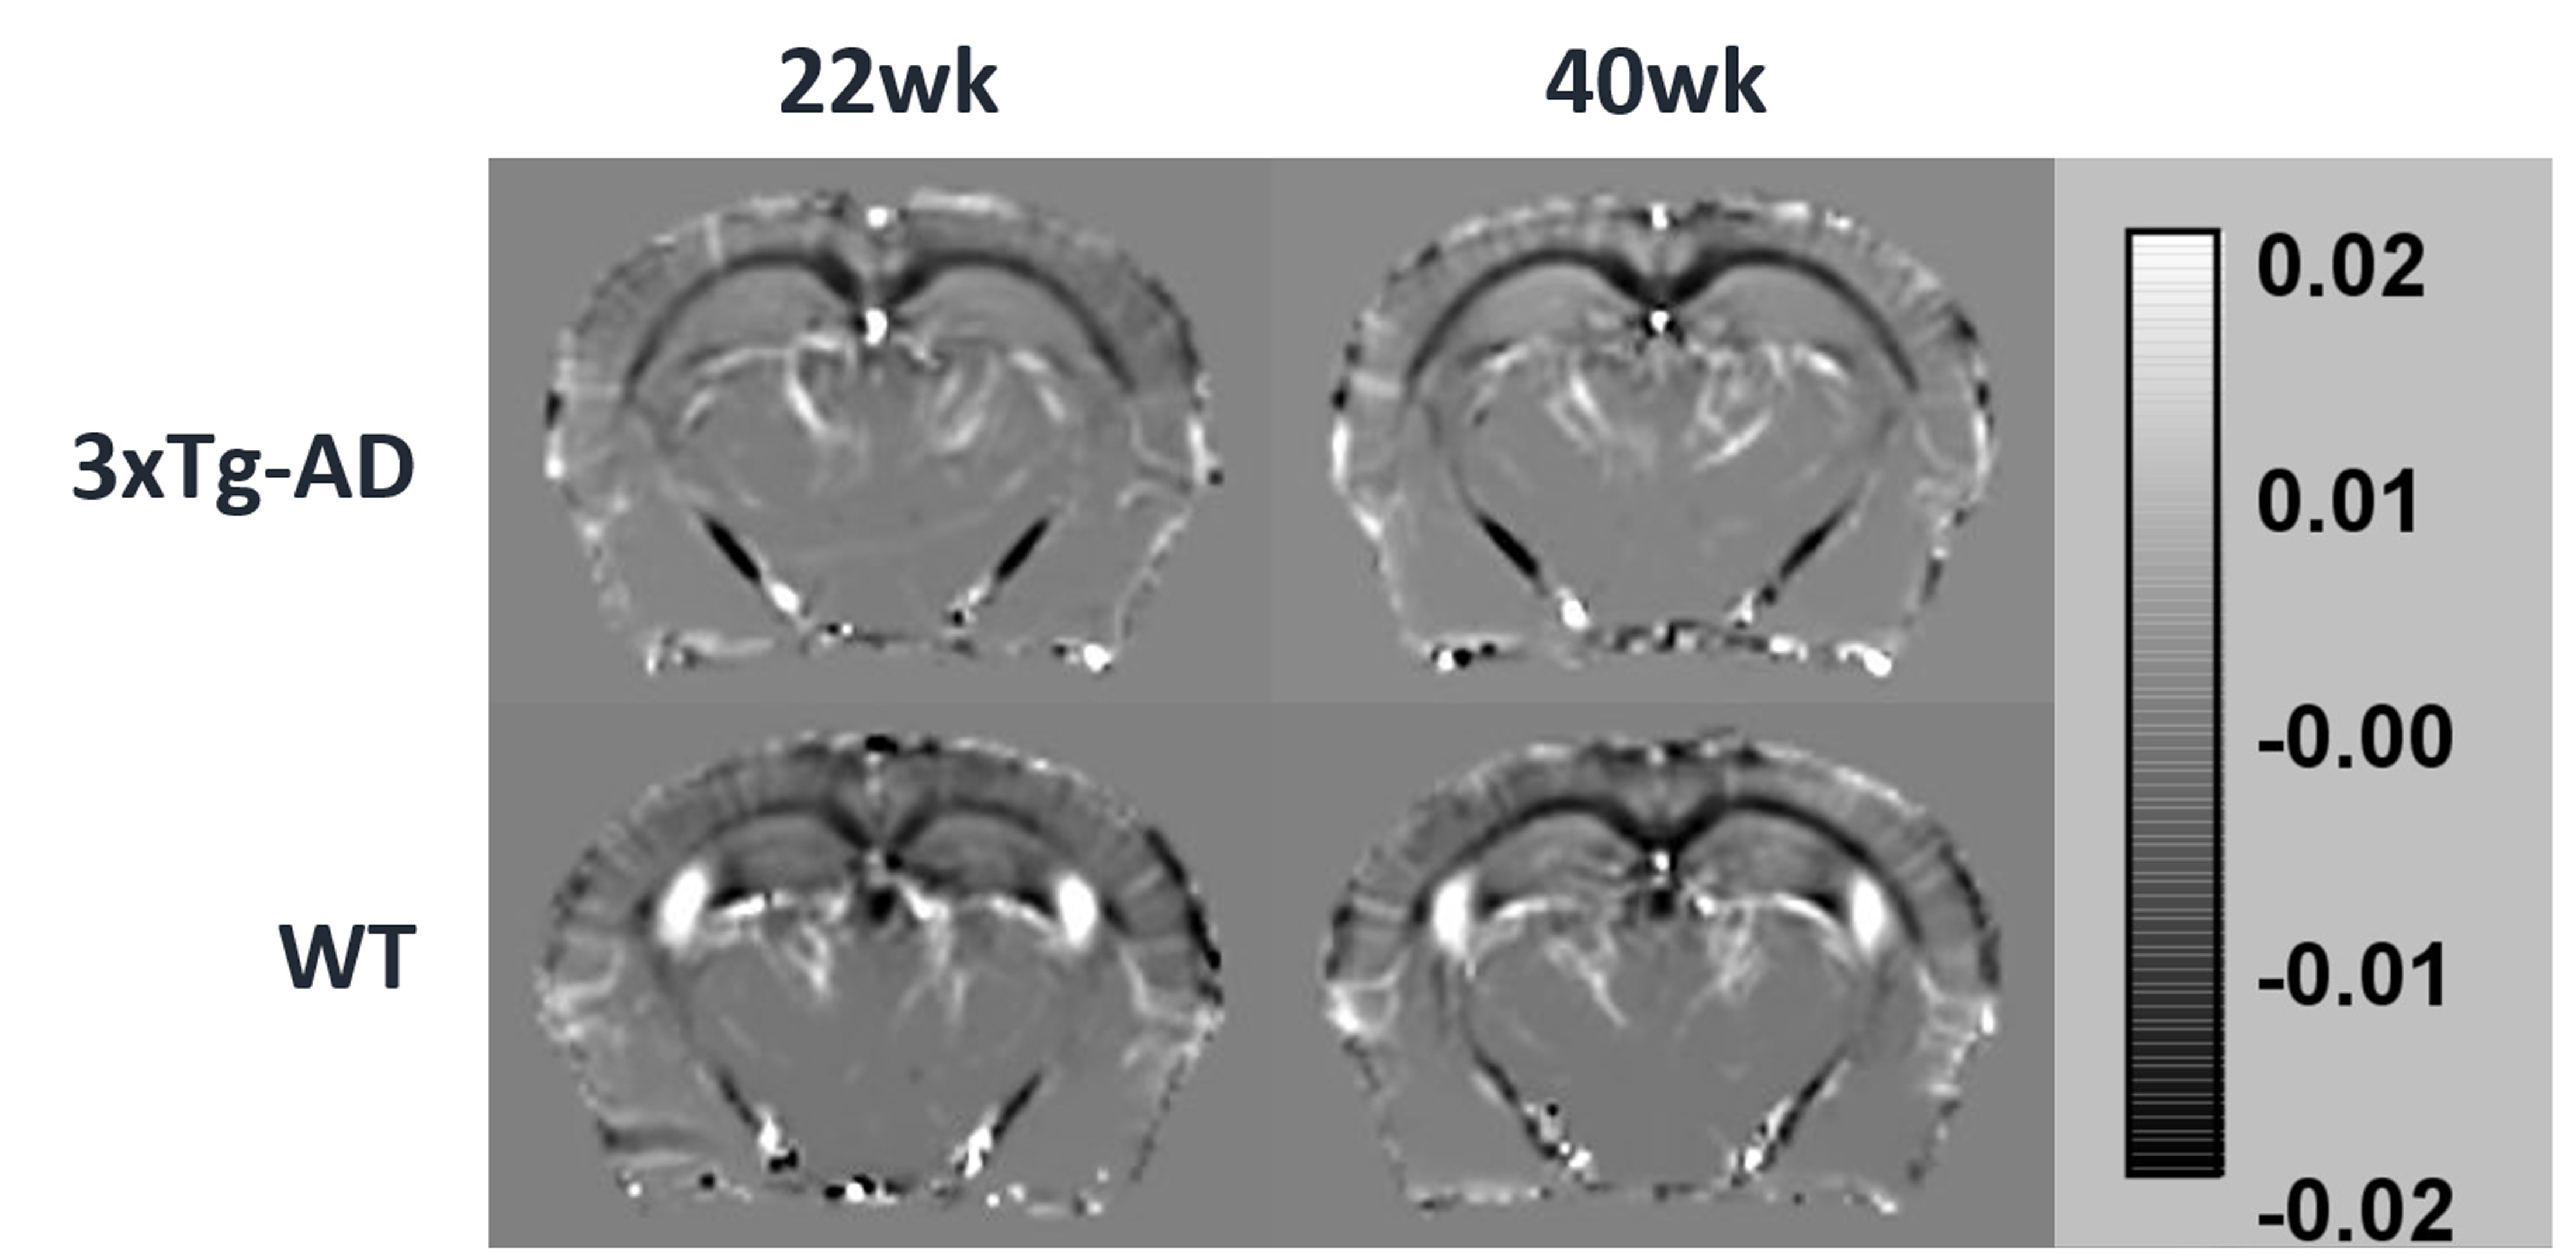
Fig. 1. Mean QSM images of these four groups. The unit is ppm.
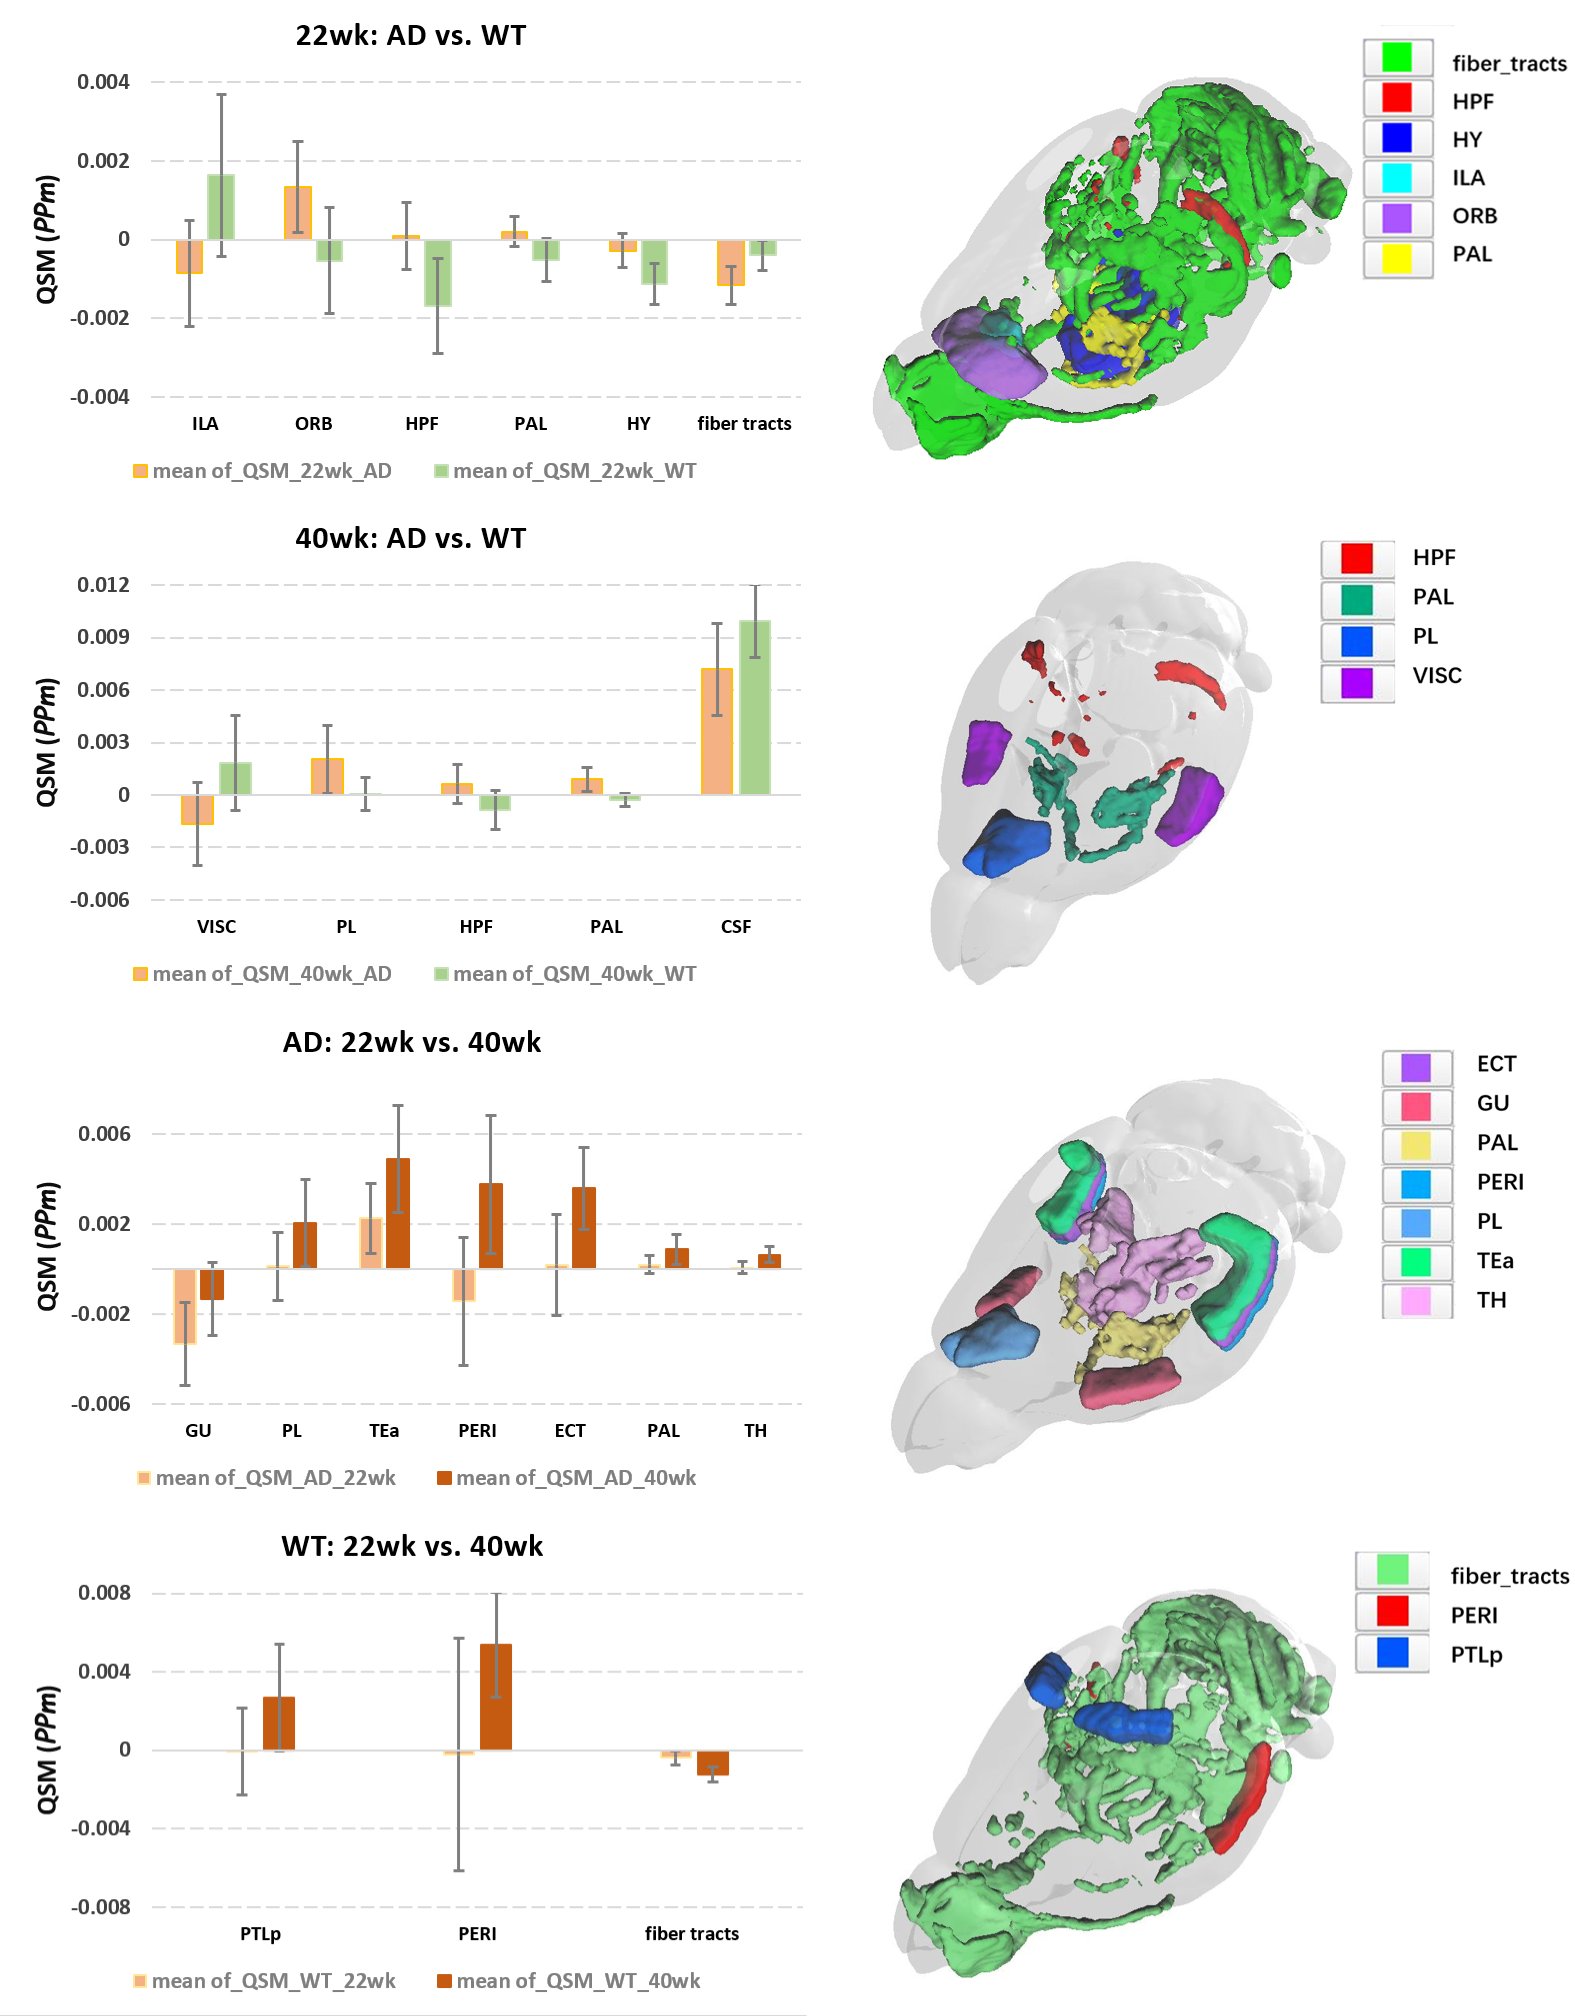
Fig. 2. Comparison of in vivo QSM between different ages and genotypes.
ECT: Ectorhinal area; GU: Gustatory areas; HPF: Hippocampal formation; HY: Hypothalamus; ILA: Infralimbic area; ORB: Orbital area; PAL: Pallidum; PERI: Perirhinal area; PL: Prelimbic area; PTLp: Posterior parietal association areas; TEa: Temporal association areas; TH: Thalamus; VISC: Visceral area