4038
Sex Specific changes in Glutamate and Other Neurometabolites in a Mouse Model of Alzheimer’s Disease: A GluCEST MRI and 1H-MRS Study1Department of Radiology, University of Pennsylvania, Philadelphia, PA, United States
Synopsis
Keywords: Alzheimer's Disease, Alzheimer's Disease, Glutamate, GluCEST, 1H-MRS
Motivation: It is well known that prevalence and progression of Alzheimer’s disease (AD), is different across two sexes. Glutamate regulates various cognitive functions including learning and memory and is known to be perturbed in AD though sex specific in vivo studies are limited.
Goal(s): To monitor sex-specific changes in cerebral glutamate and other neurometabolites in APPNL-F/NL-F and WT mice.
Approach: Glutamate weighted Chemical Exchange Saturation Transfer (GluCEST) MRI and localized 1H-MRS.
Results: Significant neurometabolite alterations in the hippocampus of male AD mice were observed, while females remained unaffected. This could be broadly attributed to neuroprotective effects of female reproductive hormones e.g., estrogen.
Impact: Although the sex bias in AD pathology has been long known, the actual mechanism remains elusive. Results obtained from this study provides a way to further explore the factors responsible for intact regional glutamate levels in female AD mice.
Introduction
Alzheimer’s disease (AD) is the most common neurodegenerative disorder characterized by progressive loss of cognitive and intellectual abilities including memory1. Interestingly, a prominent sex bias has been observed in severity, prevalence, and progression of AD. Glutamate, the major excitatory neurotransmitter in the mammalian central nervous system2 plays an important role in regulation of cognitive functions including learning and memory3. Though multiple studies conducted on AD animal models4,5 and human subjects6 using 1H MRS have revealed a consistent reduction in cortical glutamate levels, in vivo studies to find an association between AD pathology and regional cerebral glutamate levels are limited. In the current study, our objective was to perform GluCEST imaging-based7, region-wise in vivo mapping of cerebral glutamate in 6-month-old APPNL-F/NL-F male and female mice. To further validate our findings, we also performed 1H-MRS in the hippocampus.Methods
The protocol used for animal experiments was approved by the IACUC committee of the University of Pennsylvania. The study was performed using 6-month-old C57BL6/J (Wild Type (WT), n=24; 15 male and 9 female) and APPNL-F/NL-F (AD, n=30; 17 male and 13 female) mice. The APPNL-F/NL-F is a knock-in mouse model of AD, harboring Swedish (APP KM670/671NL) and the Iberian (APP I716F) mutations in APP gene8. These mice recapitulate several AD-associated pathologies, including amyloid-β1-42 plaques, synaptic loss, and microgliosis. For MRI/MRS of isoflurane (1.5%) anesthetized mice, a 20mm diameter volume 1H transceiver coil (m2m imaging, USA) in a 30cm horizontal bore 9.4T magnet interfaced with Avance III HD console (Bruker Biospin, Germany) was used. The temperature and respiration of mice were monitored continuously and maintained at 37⁰C and 60-80 beats/minute respectively. The entire imaging protocol consisted of a localizer followed by T1-FLASH (acquisition time = ~4 min), T2-MSME (acquisition time = ~9 min), GluCEST (B1rms=5.87µT; pulse-duration=1000ms (series of 200ms pulses); offsets= ±2.4 to ±3.6ppm; step-size=0.2ppm; averages=4; acquisition time = ~15 min) and WASSR7. These data were acquired from a 1mm thick axial slice (3.3 mm anterior to lambda covering hippocampal regions, surrounding cortex, and thalamus) with 0.156mm x 0.156mm in-plane resolution. At last, localized water-suppressed 1H MRS was acquired from the hippocampus (Voxel size: 6x1x2mm3, TE=16ms; TR=3000ms). For GluCEST data processing, nine brain regions (gray and white matter) were evaluated following atlas-based registration using a template created by Dorr et. al.9. 1H MR spectra were analyzed using LCModel for the quantification of different metabolites. The statistical significance of difference across four groups was determined using two-way ANOVA.Results
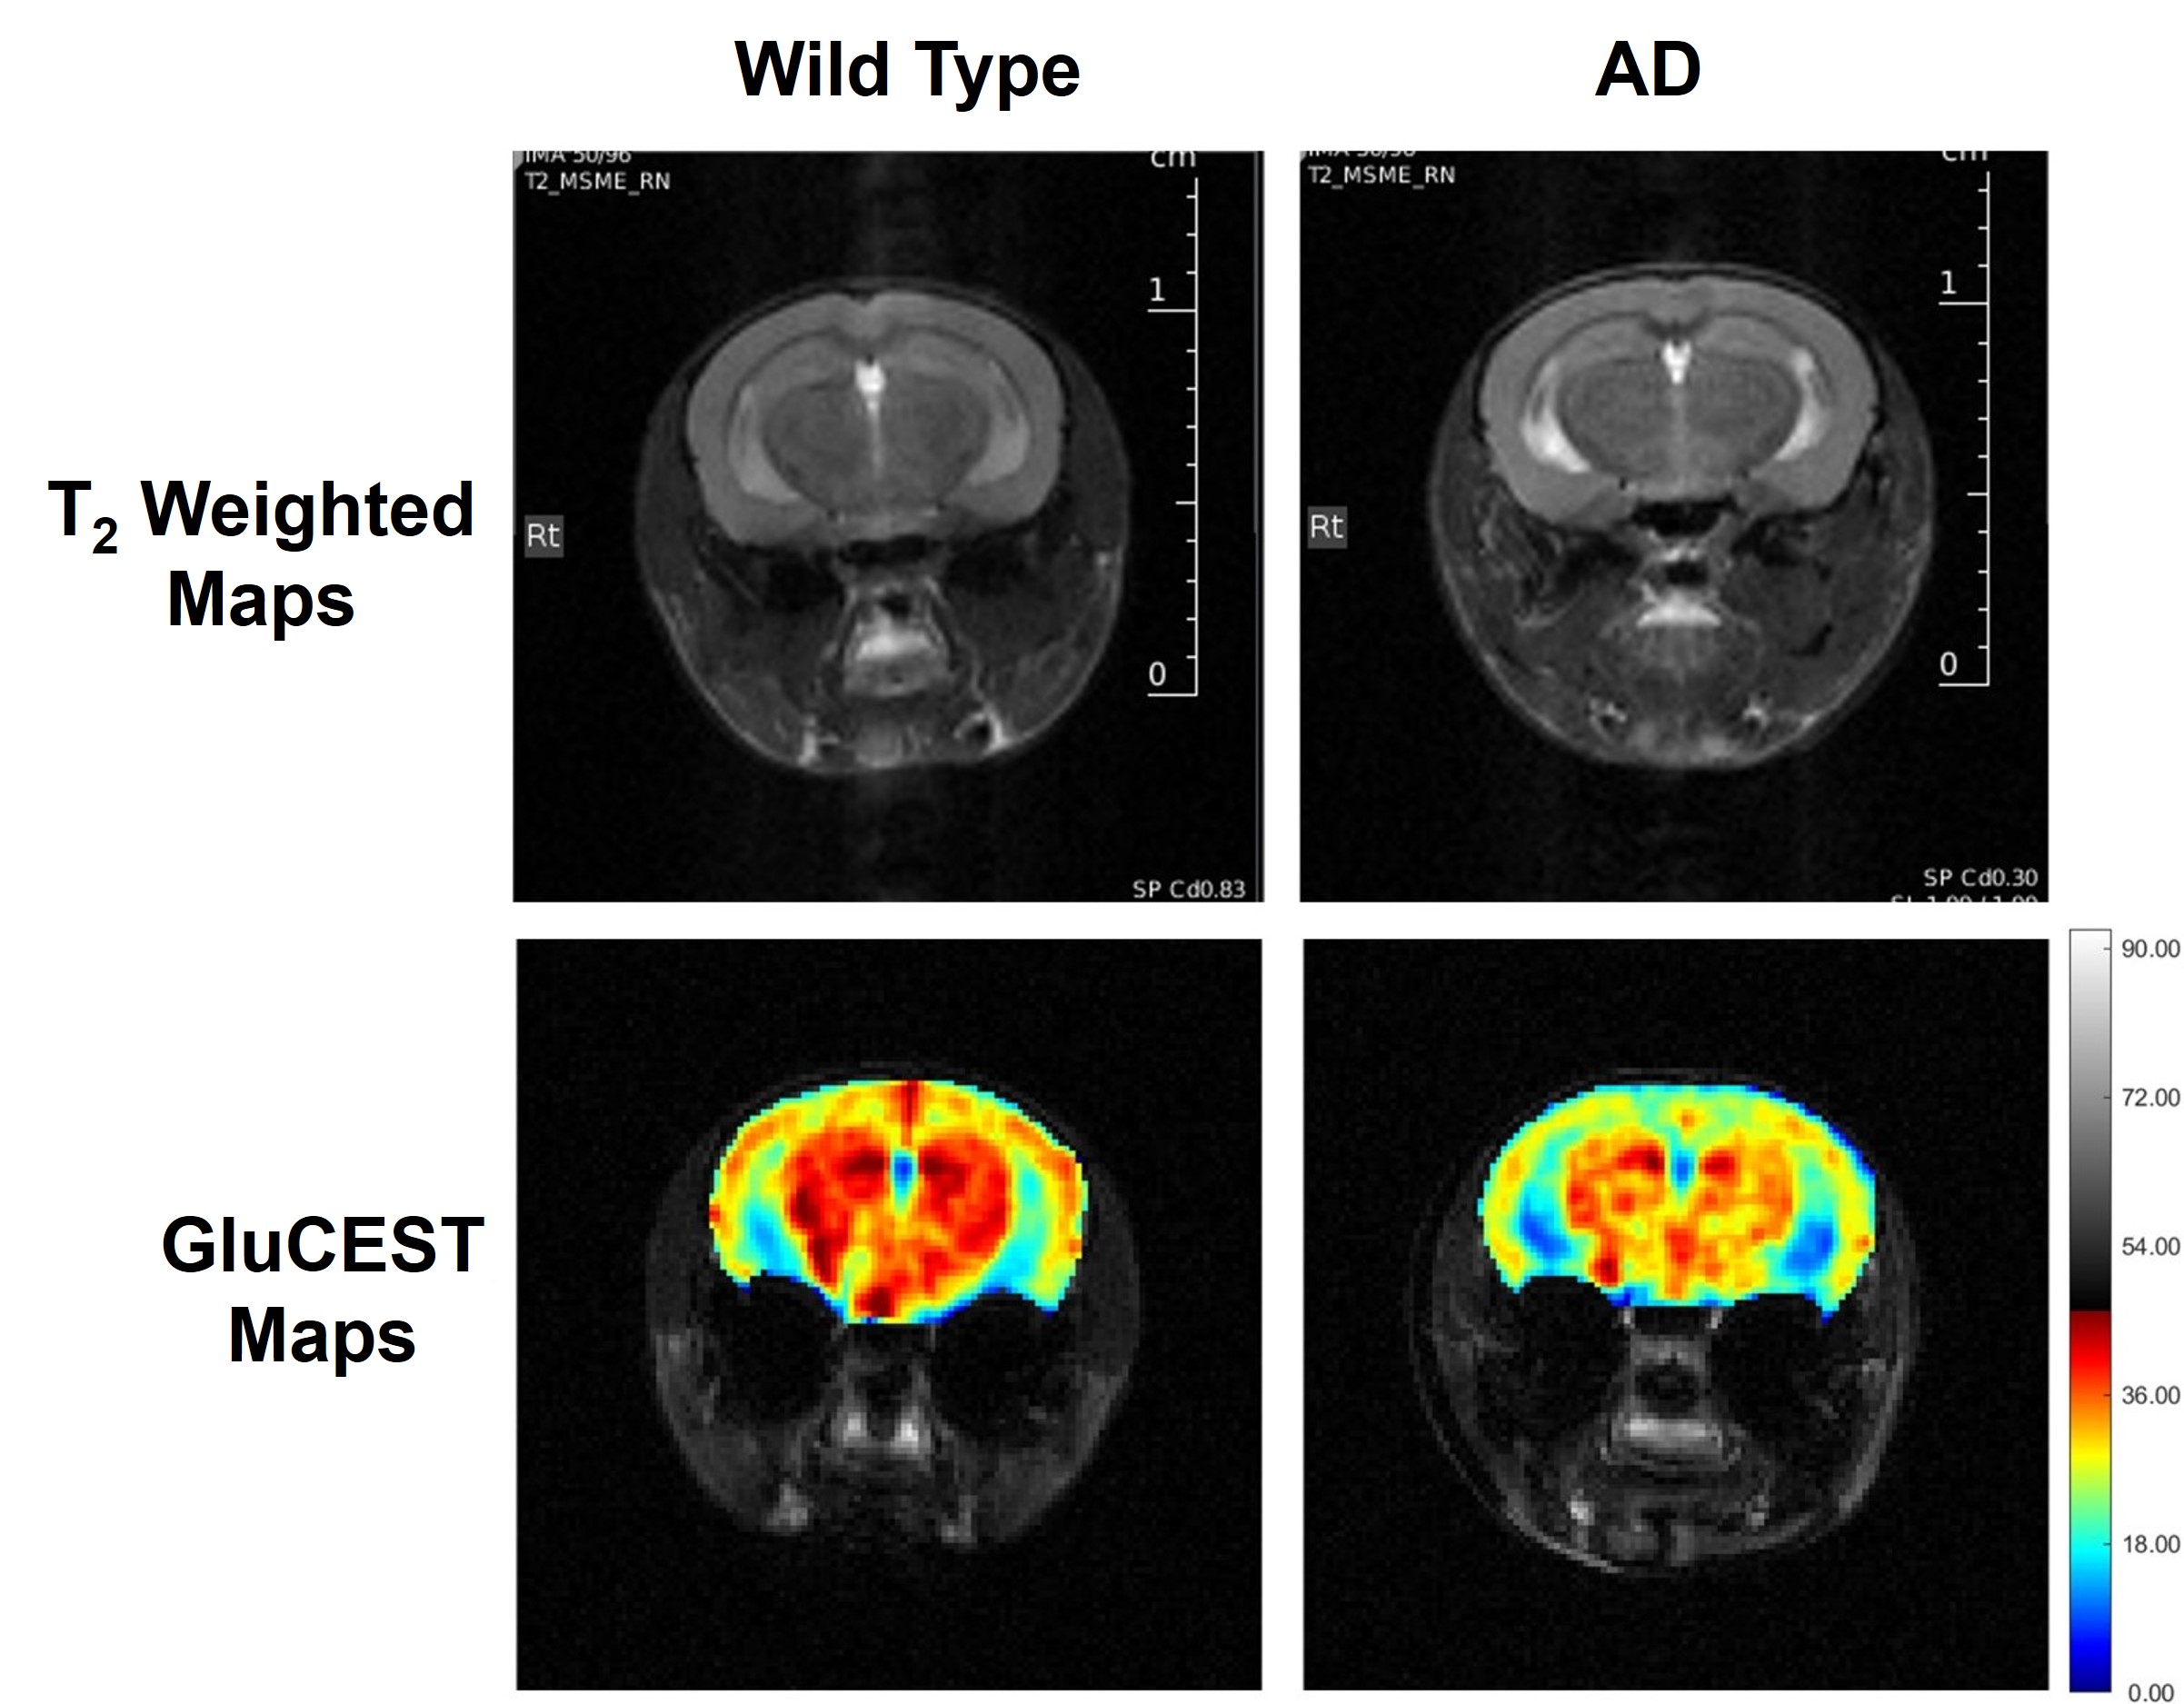
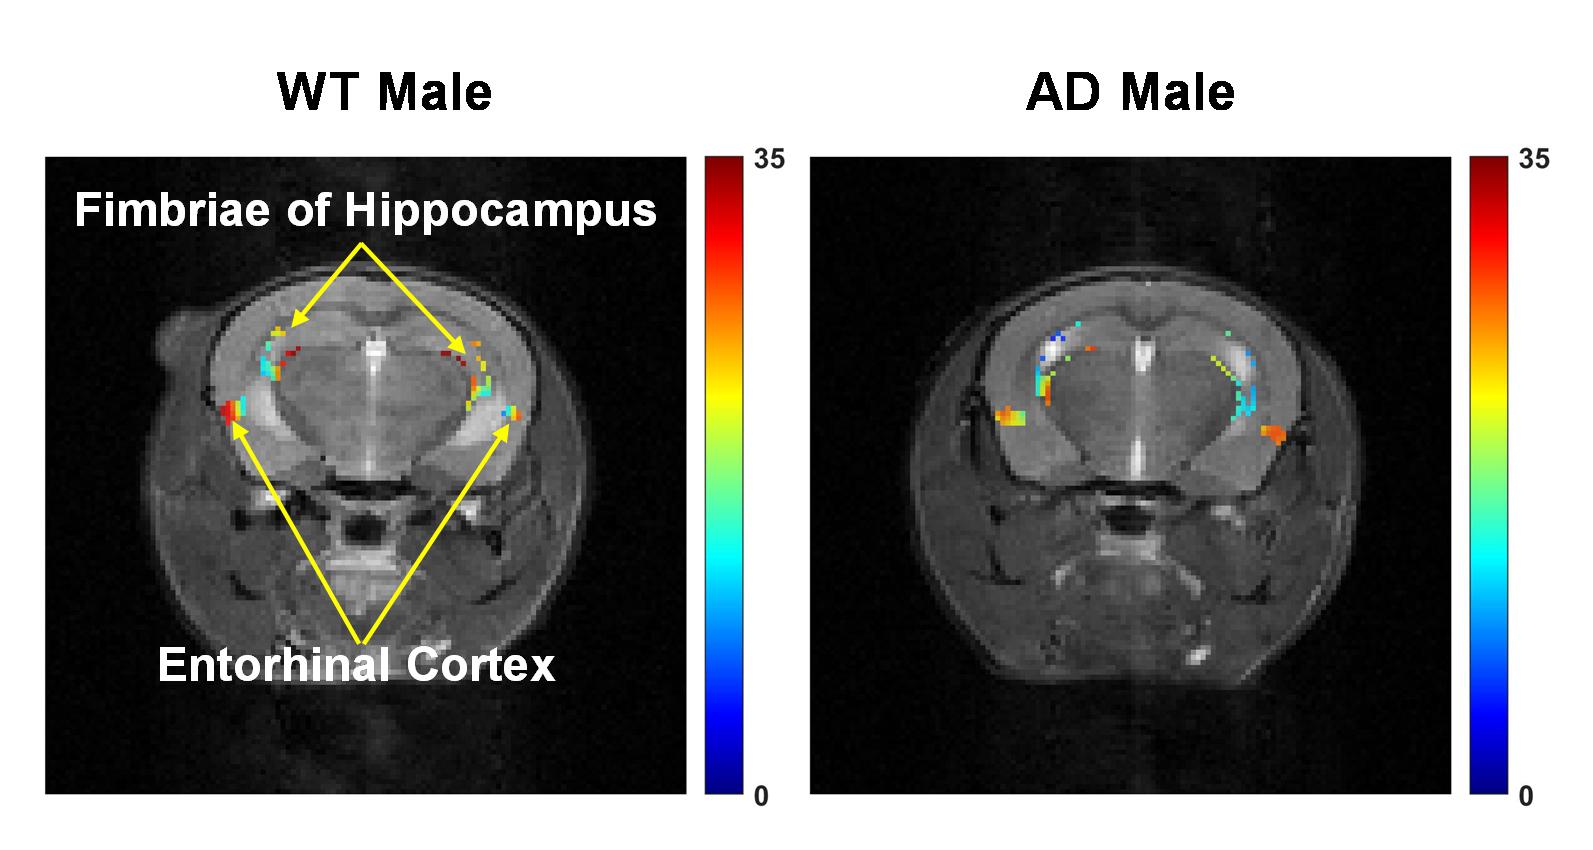
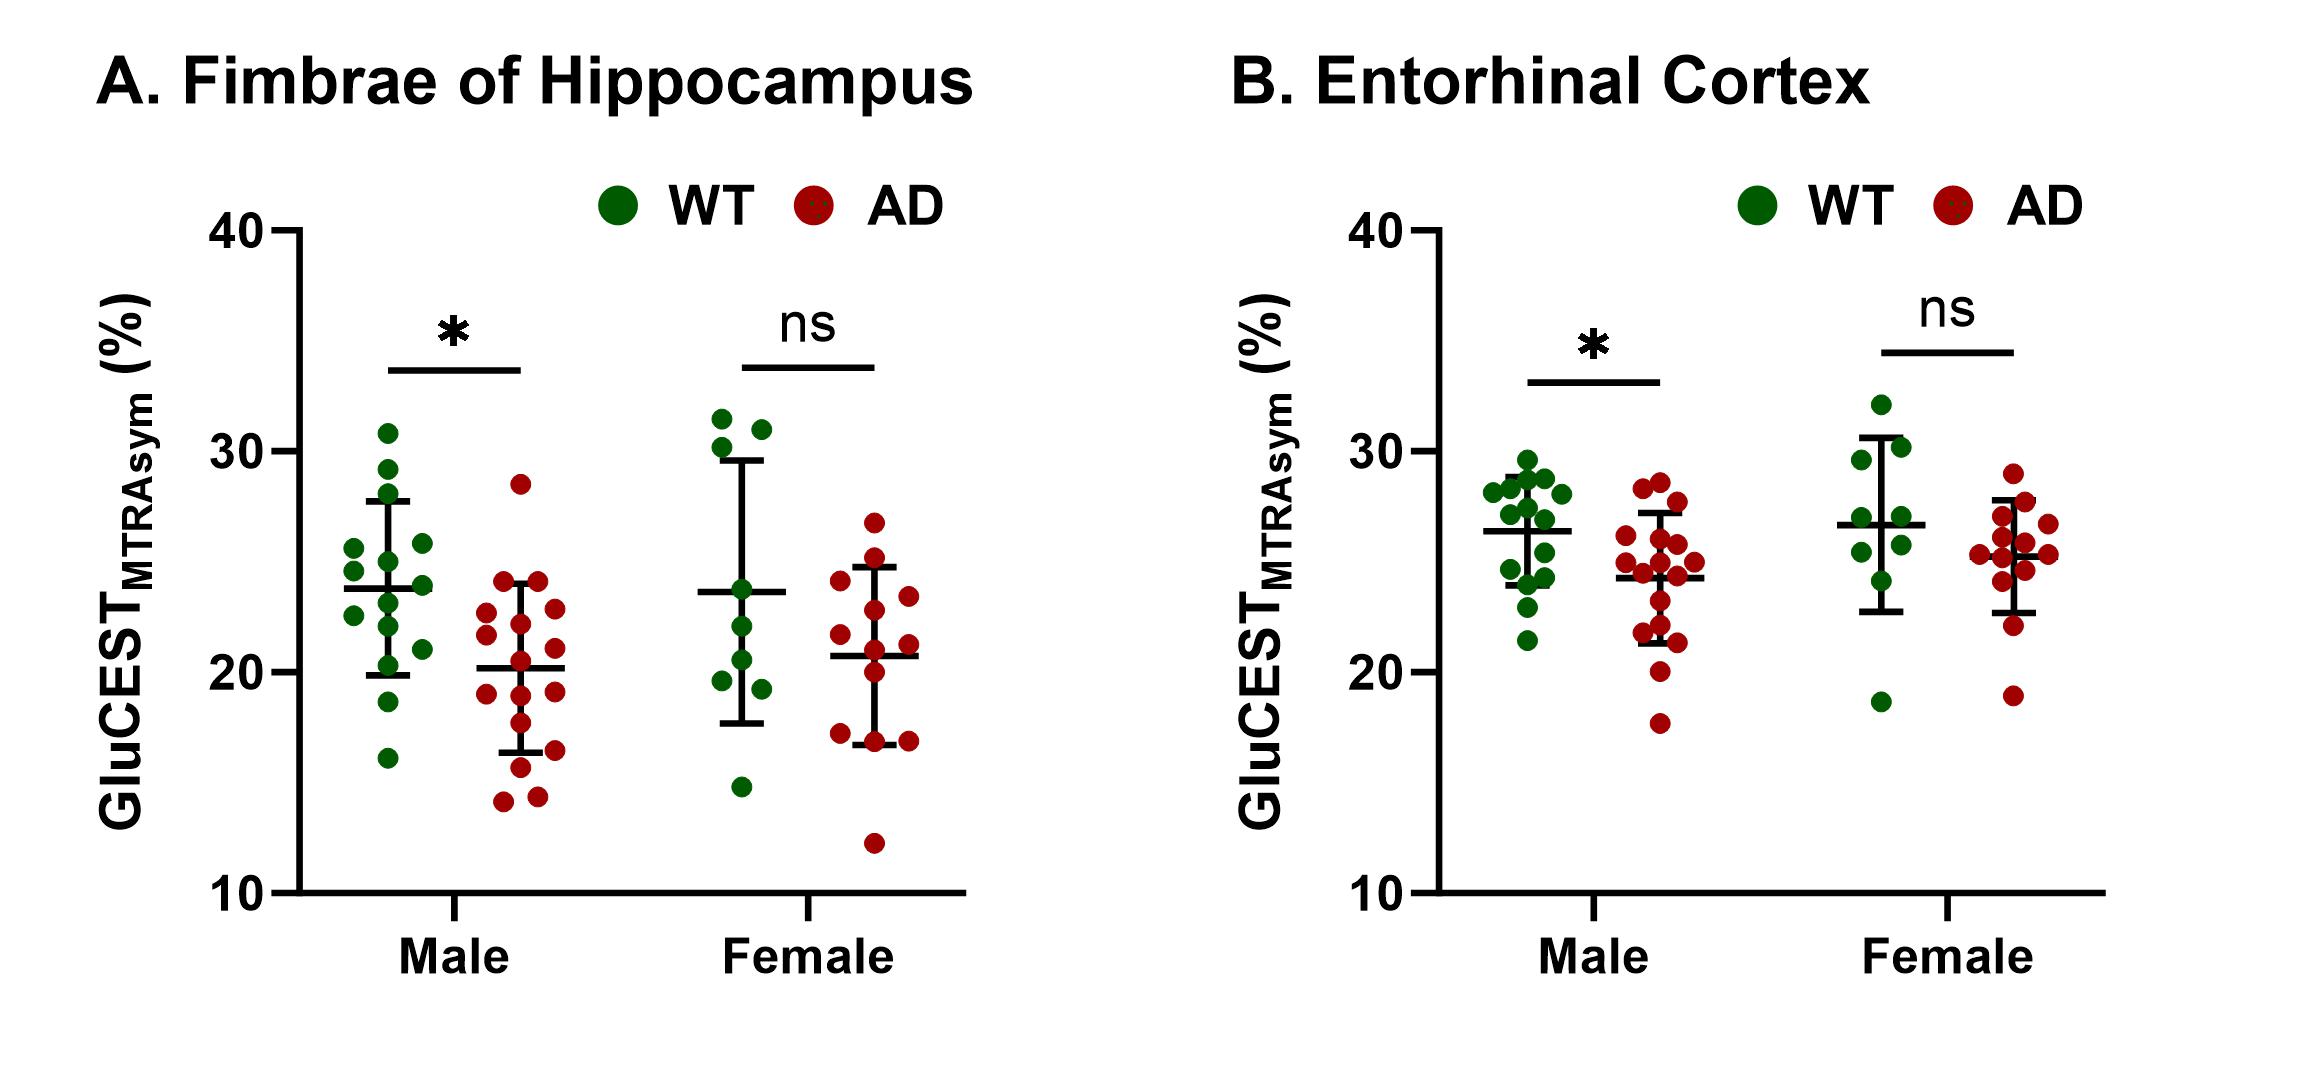
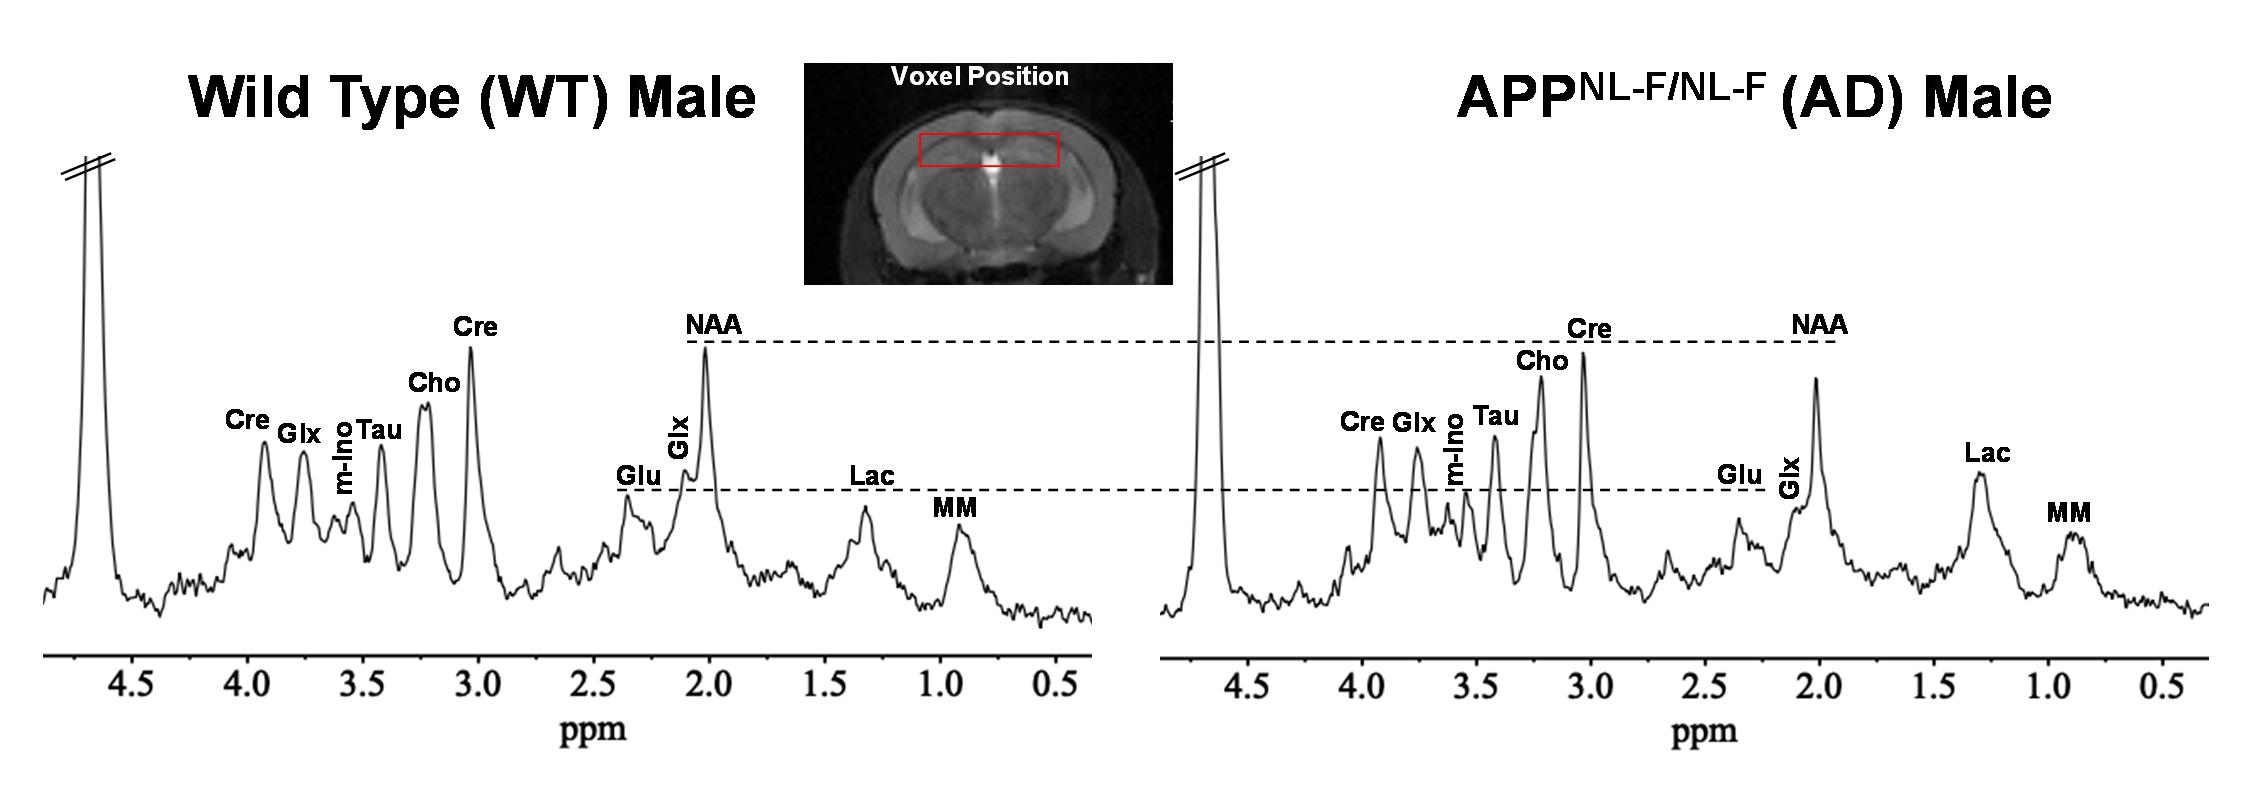
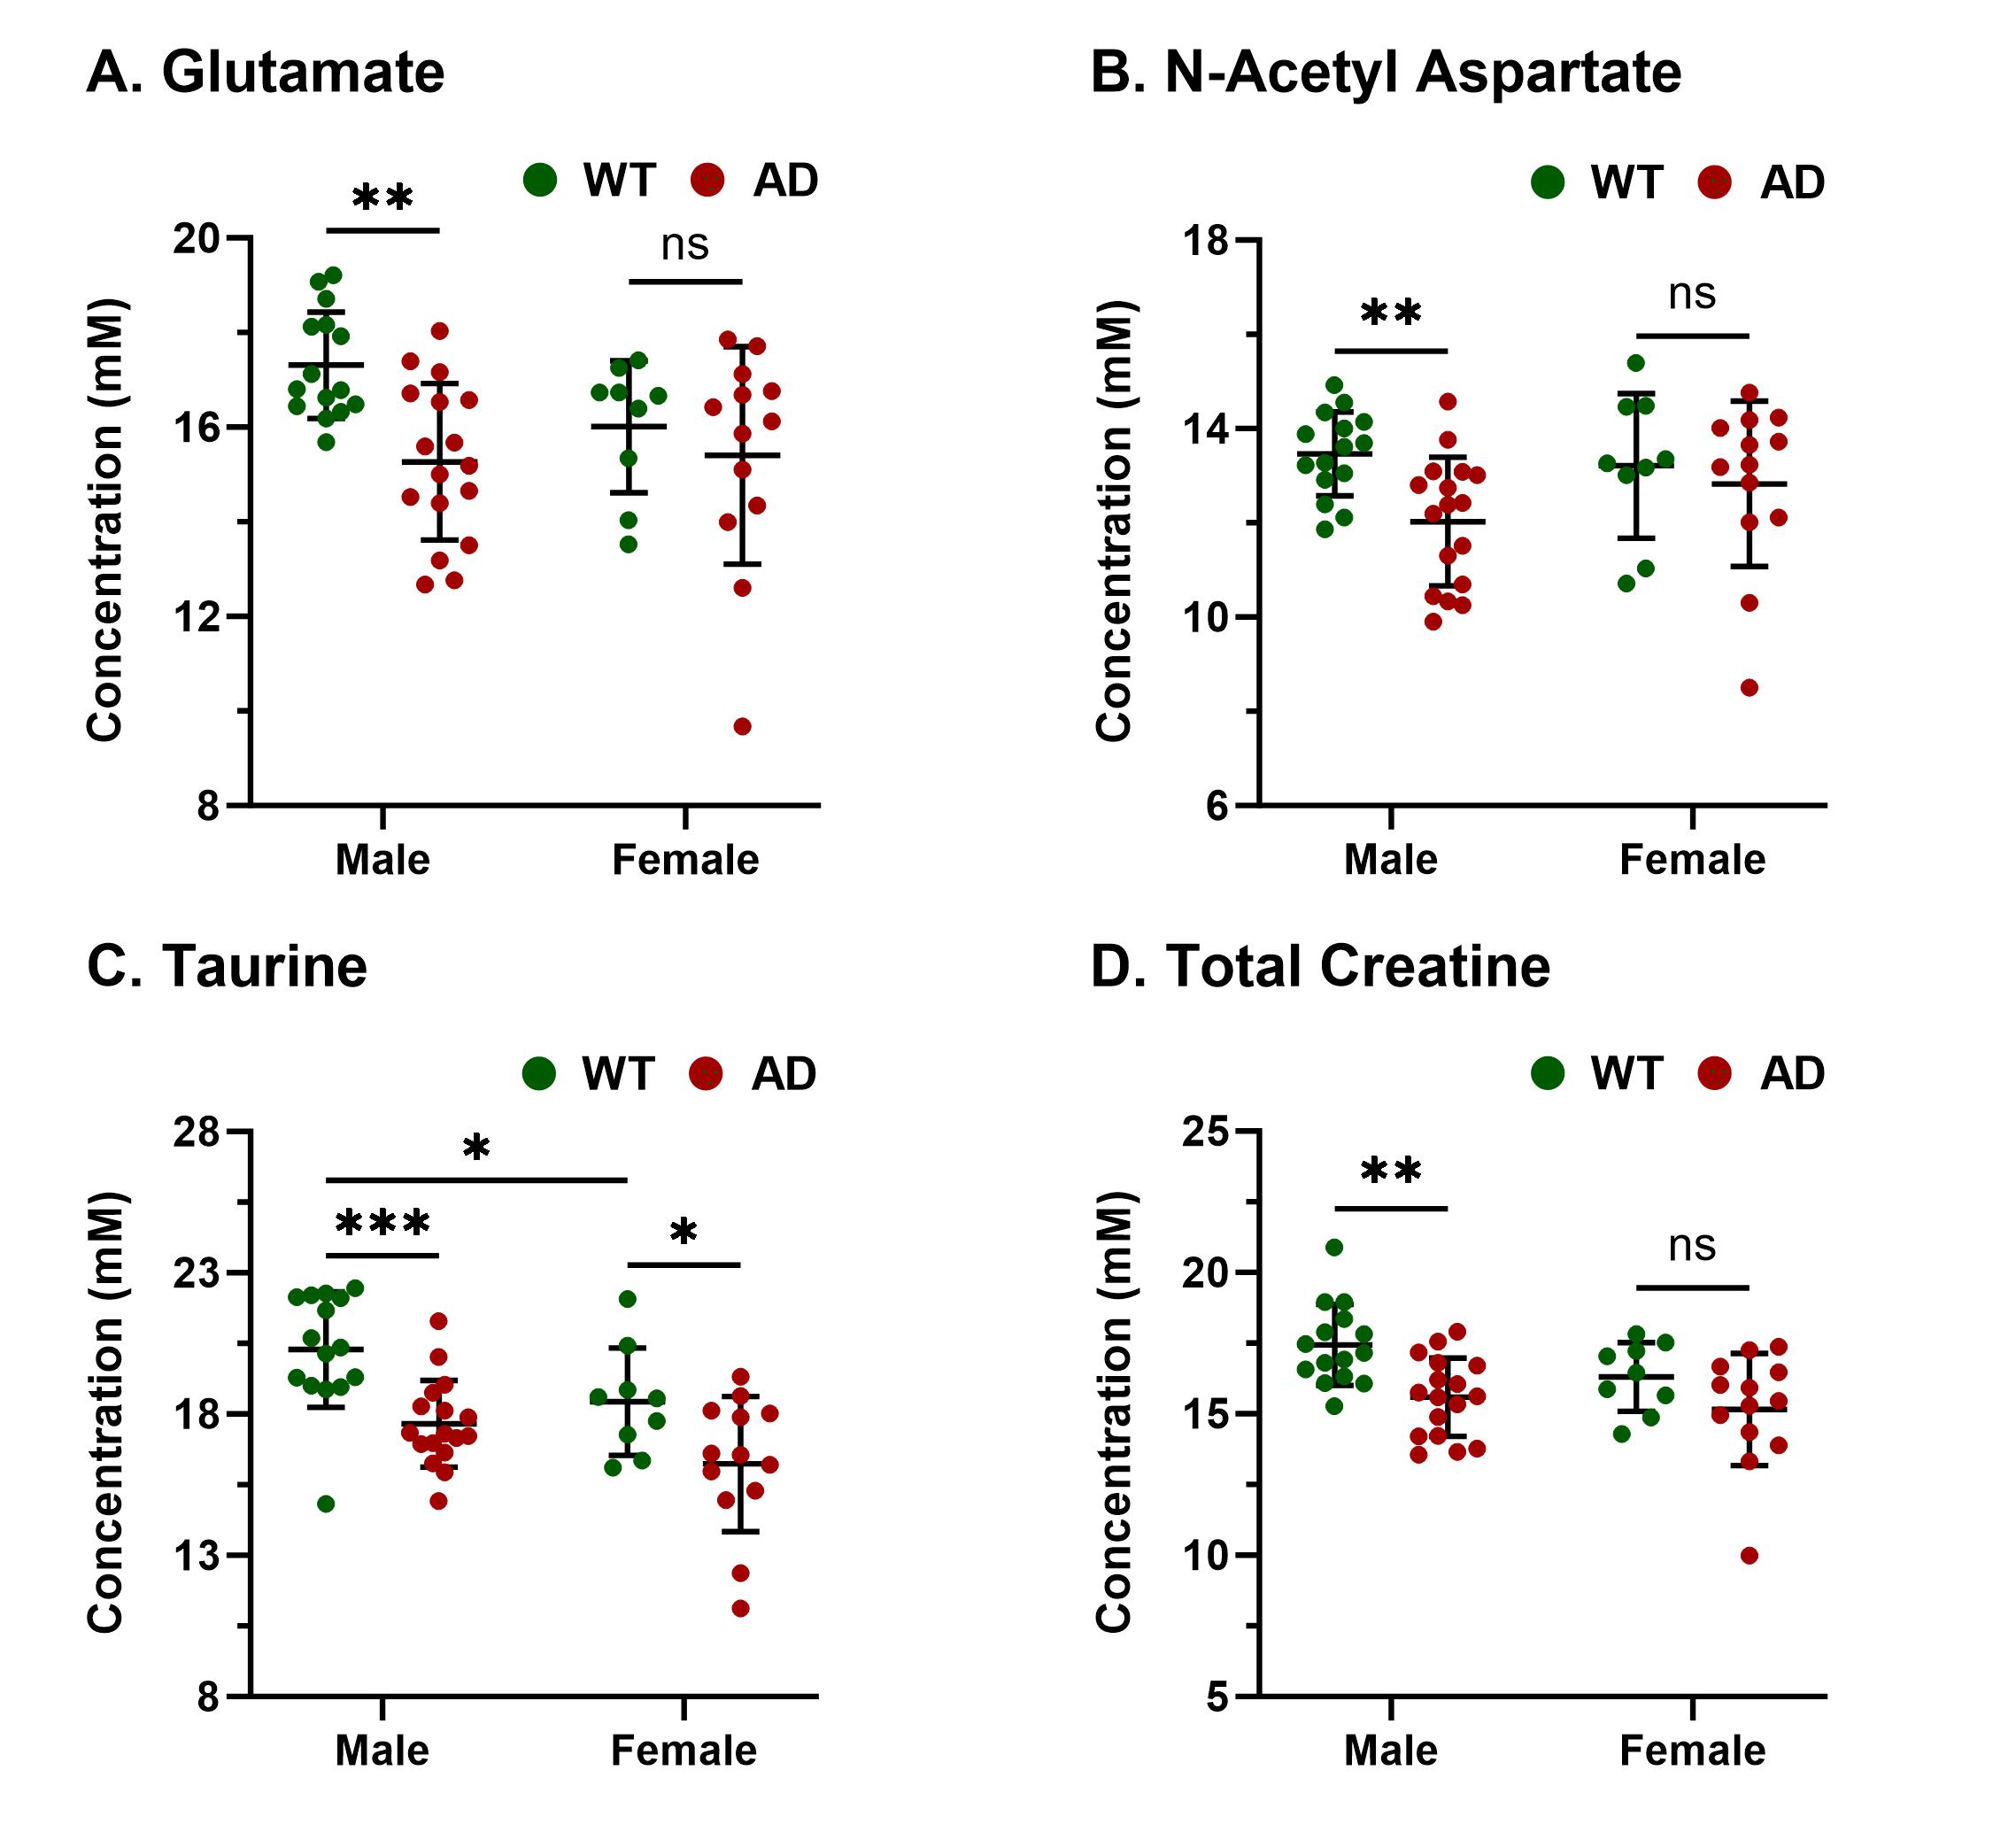
Representative anatomical (T2 weighted) and GluCEST images of the entire brain slice are shown in Figure 1 and regional GluCEST maps of fimbriae of the hippocampus and entorhinal cortex (EC) are presented in Figure 2. Quantification of GluCEST maps in a region-specific manner revealed a significant drop of glutamate levels in fimbriae (15%; p=0.02) and entorhinal cortex (8%; p=0.04) of male AD mice with reference to (w.r.t.) WT males (Fig. 3). Interestingly, no brain region of female AD mice showed any perturbation (p≥0.3). Consistent with these findings 1H MRS results also showed a significant decrease in hippocampal glutamate (12%; p=0.001) of male AD mice w.r.t. WT males (Fig. 4 and 5). Additionally, these mice also exhibited a loss in the levels of NAA (11%; p= 0.005), taurine (13%; p= 0.0004), and total creatine (tCr 11%; p=0.001) (Fig. 4 and 5). However, in female AD mice only taurine (12%; p=0.01) was reduced significantly w.r.t. WT females (Fig. 5).Discussions
The cerebral cortex and hippocampus are crucial brain regions in the regulation of cognitive functions including memory10 and are primarily affected in AD11,12. Our observation of reduced glutamate levels in fimbriae and EC pinpoints the region of impact during the early stage of AD pathology. Fimbriae surrounding the hippocampus comprise its afferent and efferent white matter pathways and are crucial for mediating the hippocampal function13. Similarly, EC is the primary mediator in the exchange of information between the cerebral cortex and hippocampus proper14. Loss of glutamate in these brain regions is directly reflected in terms of compromised cognitive functions including impairment of memory, a typical phenotype observed in cases of AD11. Reductions in levels of NAA, taurine, and tCr indicate loss of neurons15, neuroplasticity16, and compromised brain energetics17 due to disrupted Creatine/phospho-Creatine exchange, respectively. Interestingly, female AD mice were almost immune to AD-induced neurometabolic perturbations at this stage, which could be mostly attributed to much-studied neurotrophic and neuroprotective effects of estrogen18 and other female reproductive hormones, though it demands a detailed investigation to draw an evidence-supported conclusion.Acknowledgements
This project was supported by the National Institute of Biomedical Imaging and Bioengineering of the National Institutes of Health through Grant Number P41EB02946 and the National Institute of Aging through Award Number R01AG063869.References
1. Alzheimer's A (2016) 2016 Alzheimer's disease facts and figures. Alzheimers Dement 12:459-509.
2. Erecinska M and Silver IA (1990) Metabolism and role of glutamate in mammalian brain. Prog Neurobiol 35:245-296.
3. Attwell D and Laughlin SB (2001) An energy budget for signaling in the grey matter of the brain. J Cereb Blood Flow Metab 21:1133-1145.
4. Chen SQ, Cai Q, Shen YY, Wang PJ, Teng GJ, Zhang W and Zang FC (2012) Age-related changes in brain metabolites and cognitive function in APP/PS1 transgenic mice. Behav Brain Res 235:1-6.
5. Patel AB, Tiwari V, Veeraiah P and Saba K (2018) Increased astroglial activity and reduced neuronal function across brain in AβPP-PS1 mouse model of Alzheimer's disease. J Cereb Blood Flow Metab 38:1213-1226.
6. Wang H, Tan L, Wang HF, Liu Y, Yin RH, Wang WY, Chang XL, Jiang T and Yu JT (2015) Magnetic Resonance Spectroscopy in Alzheimer's Disease: Systematic Review and Meta-Analysis. J Alzheimers Dis 46:1049-1070.
7. Kim M, Gillen J, Landman BA, et al. (2009) Water Saturation Shift Referencing (WASSR) for Chemical Exchange Saturation Transfer (CEST) Experiments. Mag Reson Med. 61(6):1441-1450.
8. Saito, T., Matsuba, Y., Mihira, N., Takano, J., Nilsson, P., Itohara, S., Iwata, N., & Saido, T. C. (2014). Single App knock-in mouse models of Alzheimer's disease. Nature neuroscience, 17(5), 661–663.
9. Dorr, A. E., Lerch, J. P., Spring, S., Kabani, N., & Henkelman, R. M. (2008). High resolution three-dimensional brain atlas using an average magnetic resonance image of 40 adult C57Bl/6J mice. NeuroImage, 42(1), 60–69
10. Ito, I., & Sugiyama, H. (1991). Roles of glutamate receptors in long-term potentiation at hippocampal mossy fiber synapses. Neuroreport, 2(6), 333–336
11. Jack CR, Jr., Petersen RC, Xu Y, O'Brien PC, Smith GE, Ivnik RJ, Boeve BF, Tangalos EG and Kokmen E (2000) Rates of hippocampal atrophy correlate with change in clinical status in aging and AD. Neurology 55:484-489.
12. Pearson RC, Esiri MM, Hiorns RW, Wilcock GK and Powell TP (1985) Anatomical correlates of the distribution of the pathological changes in the neocortex in Alzheimer disease. Proc Natl Acad Sci USA 82:4531-4534.
13. Dahmani L, Courcot B, Near J, Patel R, Amaral RSC, Chakravarty MM, Bohbot VD (2019). Fimbria-Fornix Volume Is Associated With Spatial Memory and Olfactory Identification in Humans. Front Syst Neurosci. 2020 Jan 14;13:87.
14. Garcia, A. D., & Buffalo, E. A. (2020). Anatomy and Function of the Primate Entorhinal Cortex. Annual review of vision science, 6, 411–432. https://doi.org/10.1146/annurev-vision-030320-041115
15. Rigotti, D. J., Inglese, M., & Gonen, O. (2007). Whole-brain N-acetylaspartate as a surrogate marker of neuronal damage in diffuse neurologic disorders. AJNR. American journal of neuroradiology, 28(10), 1843–1849. https://doi.org/10.3174/ajnr.A0774
16. Rafiee Z, García-Serrano AM, Duarte JMN (2022). Taurine Supplementation as a Neuroprotective Strategy upon Brain Dysfunction in Metabolic Syndrome and Diabetes. Nutrients. 2022 Mar 18;14(6):1292.
17. Forbes SC, Cordingley DM, Cornish SM, Gualano B, Roschel H, Ostojic SM, Rawson ES, Roy BD, Prokopidis K, Giannos P, Candow DG (2022). Effects of Creatine Supplementation on Brain Function and Health. Nutrients. 2022 Feb 22;14(5):921.
18. Brann DW, Dhandapani K, Wakade C, Mahesh VB, Khan MM (2007). Neurotrophic and neuroprotective actions of estrogen: basic mechanisms and clinical implications. Steroids. 2007 May;72(5):381-405.
Figures