4037
Correlations of Blood and Brain NMR Metabolomics with Mouse Models of Alzheimer’s Disease1Radiology and Pathology, Massachusetts General Hospital, Harvard Medical School, Boston, MA, United States, 2Anesthesia, Massachusetts General Hospital, Boston, MA, United States, 3Charité – Universitätsmedizin Berlin, Berlin, Germany, 4Radiology Gotha, SRH Poliklinik Gera GmbH, Gotha, Germany, 5SRH University of Applied Health Sciences, Gera, Germany
Synopsis
Keywords: Alzheimer's Disease, Spectroscopy, Metabolomics, metabolomic imaging, nuclear magnetic resonance, neurodegeneration, small animals
Motivation: Alzheimer’s disease (AD) diagnosis currently relies on clinical evaluation, and definitive disease characterization can only be accomplished from tissue pathology during autopsy.
Goal(s): Evaluations of AD metabolomics using nuclear magnetic resonance (NMR) spectroscopy to identify potential biomarkers that can differentiate AD from non-AD conditions.
Approach: We collected cortex, hippocampus, and blood samples from mice with and without AD, followed by NMR analysis.
Results: NMR could differentiate between AD and wild-type (WT) conditions for all tissue types, and metabolomic differences in several spectral regions were observed across disease conditions, leading to the identification of potential contributing metabolites and metabolic pathways.
Impact: HRMAS NMR-based metabolomic evaluations can differentiate mice with and without Alzheimer’s disease (AD), characterize metabolic states within brain and blood samples, and identify possible AD biomarkers. It has potential for in vivo implementation and may improve AD diagnosis in clinic.
Introduction
Alzheimer’s disease (AD) affects over 6 million Americans, making it the third-leading cause of death for older people after heart disease and cancer, and the most common neurodegenerative disorder.1,2 Currently, the only definitive method to diagnose and characterize AD is through post-mortem brain tissue pathological analysis, thereby limiting the development of novel treatment strategies to staunch AD progression.3,4 However, given that abnormal metabolic states in the brain and other organs may precede the formation of AD pathology, metabolomic analyses has the potential to characterize AD-related metabolic alterations in living species, which may assist in AD early detection and diagnosis. In this study, we present evidence of a strong correlation between metabolomic changes in the brain and blood for AD mouse models, as measured with high-resolution magic angle spinning (HRMAS) nuclear magnetic resonance (NMR) spectroscopy.Methods
Animal models: 5XFAD Tg 14-month AD mice (n=15, 8 female, 7 male) and female C57/BL6 12-month wild-type (WT) mice (n=8) were euthanized by carbon dioxide inhalation. Cortex, hippocampus, and blood samples were collected and stored at -80°C until analysis. NMR spectroscopy: Frozen tissue samples were analyzed by HRMAS NMR on a Bruker 600MHz spectrometer at 4°C with a rotor-synchronized CPMG sequence and 3600 Hz spinning rate. Data analysis: Spectra processing and curve-fitting were completed on Bruker Topspin 3.6.2, and 51 spectral regions of interest (ROIs) were identified, including 40 ROIs common for all three tissue types. Univariate comparisons, hierarchical analysis, and unsupervised multivariate principal component analysis (PCA) were performed for all 51 identified regions on JMP Pro (SAS).Results
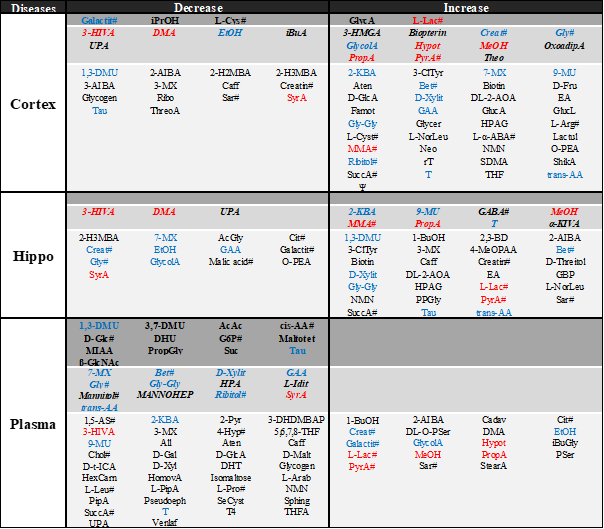
HRMAS NMR produced high-resolution spectra with samples on a milligram/milliliter scale and was able to differentiate between AD and WT conditions for all three tissue types, according to hierarchical cluster analysis (Figure 1). Metabolomic differences between AD and WT groups were determined by PCA, with principal components (PCs) 3 and 4 most significant for cortex and hippocampus, and PC 1 for plasma (Figure 2). Furthermore, univariable Wilcoxon analyses of individual spectral regions and each ROI’s weighting (i.e. loading factors) towards calculated PCs determined several spectral regions as most significant in contributing towards WT or AD conditions (Figure 3). Table 1 presents potential contributing metabolites for these regions, based on systematic evaluations according to Human Metabolome Database (HMDB), with all metabolites having met the following criteria: a) ≥ 50% of resonance peaks lie in the determined spectral regions, and b) all participating spectral regions are uniformly increased or decreased, when comparing AD with WT.Discussion & Conclusion
Disease and metabolic differentiation between AD and WT for all tissue types were possible with multiple spectral regions. Several metabolites were increased in AD across all tissue types, namely lactate (L-Lac), methanol (MeOH), and propionic acid (PropA). Several other metabolites had varying trends, depending on the tissue type, such as glycine (Gly), 1,3-dimethyluric acid (1,3-DMU), and guanidoacetic acid (GAA). Further investigations into the potential role of these metabolites in AD through metabolic pathway analysis are currently underway in our laboratory.Our results demonstrate that HRMAS NMR can be used to detect differing metabolomics in AD and WT mouse models, and that metabolic profiles may vary for cortex, hippocampus, and plasma. NMR-based metabolomic evaluations have the potential for in vivo implementation, and may lead to new and improved diagnostic methods for patients with AD.
Acknowledgements
NIH Grants: R01 AG070257 and R01 CA273010. MGH Martinos Center for Biomedical Imaging.References
1. 2023 Alzheimer's disease facts and figures. Alzheimers Dement. Apr 2023;19(4):1598-1695. doi:10.1002/alz.13016
2. Scheltens P, De Strooper B, Kivipelto M, et al. Alzheimer's disease. Lancet. Apr 24 2021;397(10284):1577-1590. doi:10.1016/s0140-6736(20)32205-4
3. Braak H, Braak E. Frequency of stages of Alzheimer-related lesions in different age categories. Neurobiol Aging. Jul-Aug 1997;18(4):351-7. doi:10.1016/s0197-4580(97)00056-0
4. Braak H, Alafuzoff I, Arzberger T, Kretzschmar H, Del Tredici K. Staging of Alzheimer disease-associated neurofibrillary pathology using paraffin sections and immunocytochemistry. Acta Neuropathol. Oct 2006;112(4):389-404. doi:10.1007/s00401-006-0127-z
Figures
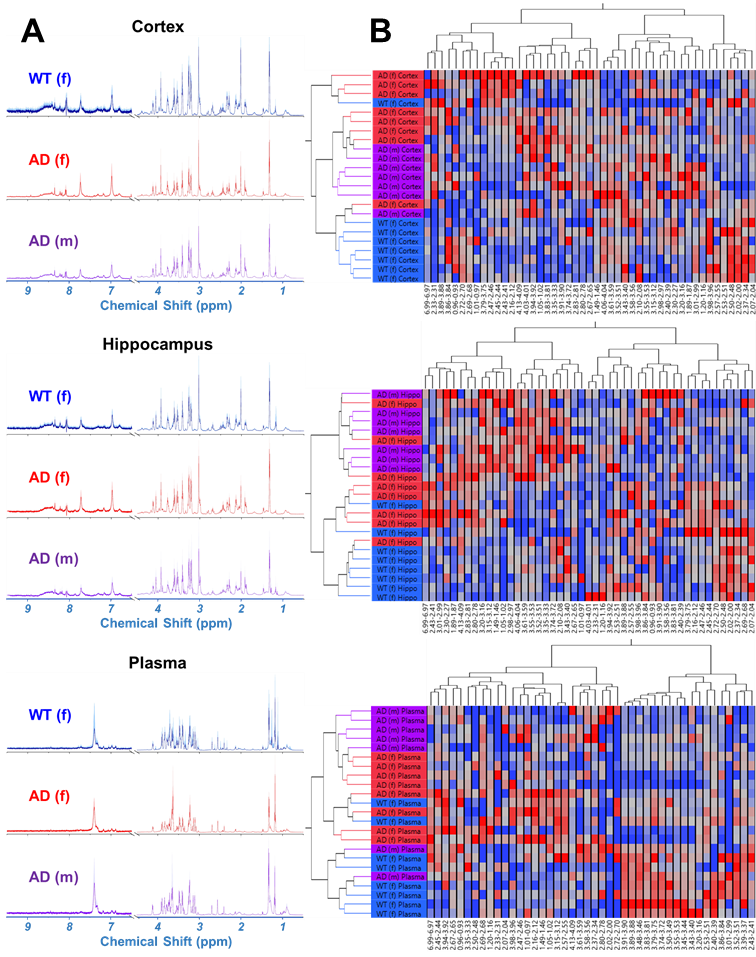
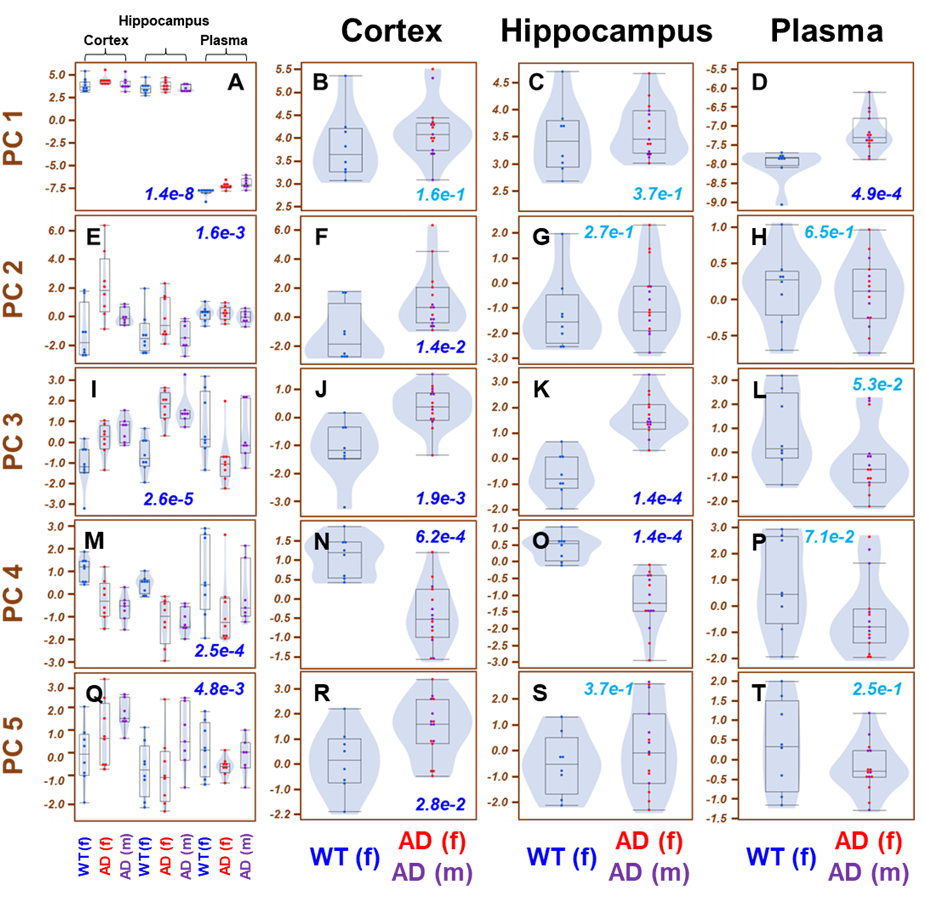
Figure 2. Principal components for WT and AD. PCs 1-5 present varied potentials for differentiating WT from AD for three tissue types. Statistically significant p-values (p<0.05) are written in dark blue.
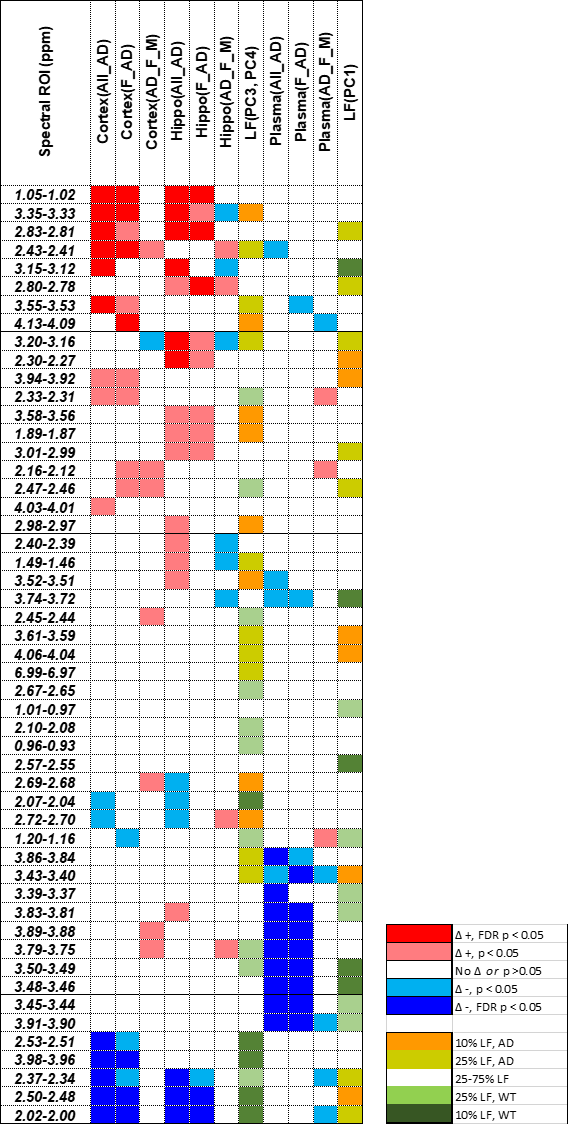
Figure 3. Spectral ROI differentiation of WT and AD, and their contributions towards significant PCs. Red boxes represent ROIs that are increased in AD versus WT, and blue boxes represent the opposite. PCA loading factors (LF), which represent the “weight” of each ROI towards significant PCs (1,3, and 4), are shown in yellow and green. Yellow represents the top 10% of ROIs that contribute towards AD, and green for WT. Δ represents the difference of AD – WT.