4035
Imaging cerebrovascular structure and function in the transgenic mouse model of Alzheimer’s disease1Department of Radiology, Athinoula A. Martinos Center for Biomedical Imaging, Charlestown, MA, United States, 2Department of Neurology, Massachusetts General Hospital, Charlestown, MA, United States
Synopsis
Keywords: Alzheimer's Disease, Blood vessels
Motivation: Our previous study in humans found changes in vascular structure in AD/MCI patients but its time course and relationship to AD pathology were unknown.
Goal(s): The aim of this study was to assess alterations in the structure and function of blood vessels in transgenic mouse models of AD.
Approach: Litters with all four genotypes (wild-type, Aβ only, tau only, and Aβ+tau) underwent perfusion MRI and vessel size imaging as part of a longitudinal study.
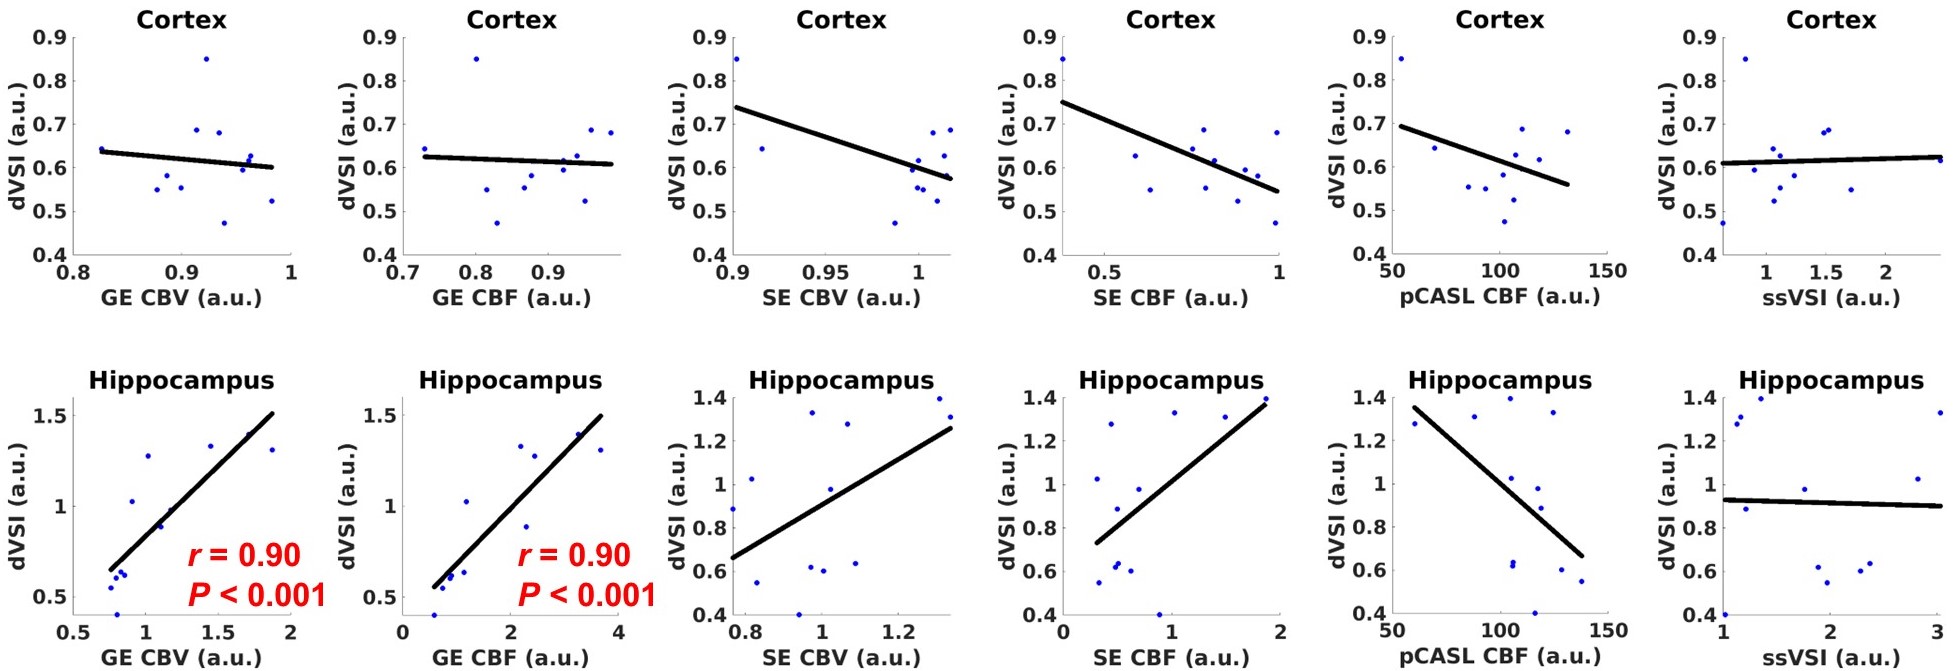
Results: The vessel size correlates significantly with cerebral blood volume and blood flow in the hippocampus. No group difference was found at the baseline pre-symptom stage.
Impact: Success in this study, in conjunction with ex-vivo microscopy, will enhance our ability to interpret in vivo vascular imaging in people and enable us to identify individuals for vasculature-targeted therapies and evaluate how interventions may ameliorate vascular health in AD.
Introduction
Cerebrovascular dysfunction has been recognized as a contributing factor to Alzheimer’s disease (AD) pathogenesis due to its impact on impaired blood flow, the promotion of inflammation, and the hindrance of toxic substance clearance from the brain.1,2,3 Systematic investigations of interconnection between them are essential for the comprehension of AD. Nevertheless, research into the association between the underlying AD pathology, including tau and beta-amyloid deposition, and changes in cerebrovascular structure and function is still lacking. The animal models in this study are based on APP/PS1-rTg4510 crossed mouse model4 to obtain litters with all four genotypes: Aβ only, tau only, Aβ+tau, and wild-type littermate controls. Pathological protein accumulation begins at 4 months of age in these animals.4 As part of an ongoing longitudinal study, we began by non-invasively assessing the alterations in the MR measures of cerebral blood flow (CBF), cerebral blood volume (CBV), and vessel size index (VSI) in these AD models at the baseline pre-symptom stage.Methods
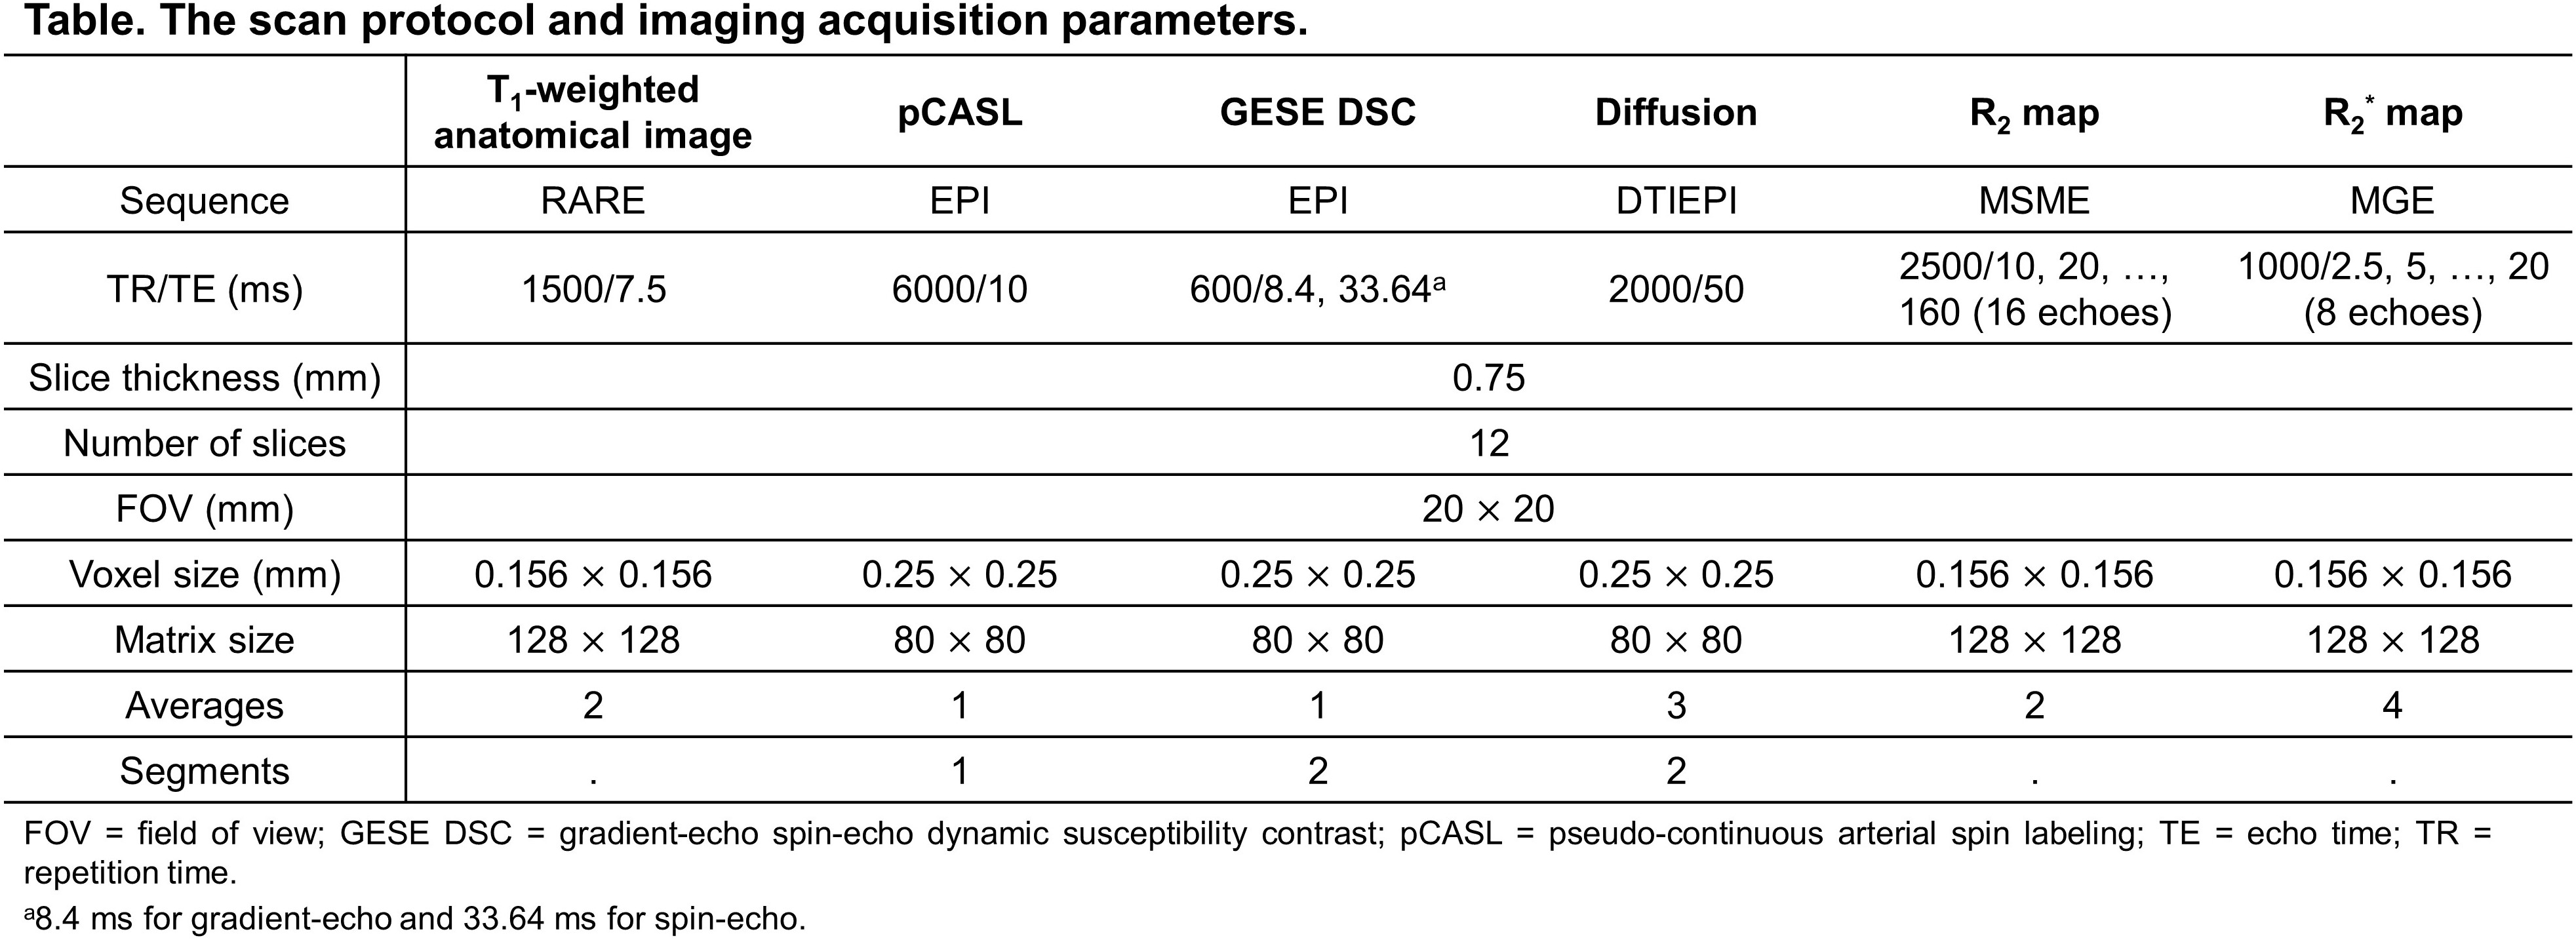
Three male mice at 4 months of age from each of the following genotype groups, APP/PS1, rTg4510, 3xTg, and wild-type controls, were scanned on a 9.4T Bruker preclinical scanner (Bruker, Germany). Each animal underwent two separate MRI sessions one week apart. The animals were sedated by an intramuscular injection of Dexmedetomidine (DEX) at a concentration of 0.02 mg/kg. Anesthesia was induced using a low-level 0.5% isoflurane, coupled with DEX infusion at 0.2 mg/ml (flow rate of 0.1 l/min) through intraperitoneal injection. This anesthesia regimen was chosen to minimize CBF modulation by isoflurane. A tail vein was cannulated for the injection of Gd-DOTA (Dotarem, Guerbet, France) and USPIO (Feraheme, AMAG Pharmaceuticals, MA) in two separate imaging sessions. Figure 1 displays the scan protocol and the common imaging acquisition parameters in the study. At the beginning of each session, 2D T1-weighted anatomical images were acquired using the rapid acquisition with relaxation enhancement (RARE) sequence.Session 1
A 2D echo planar imaging (EPI) sequence was used for pseudo-continuous arterial spin labeling (pCASL) MRI with the following specific parameters: labeling duration = 2500 ms, post-labeling delay = 300 ms, and 20 measurements. Gradient-echo (GE) and spin-echo (SE) dynamic susceptibility contrast (DSC) MRI were acquired simultaneously using a custom-made 2D GESE-EPI sequence with Gd-DOTA injection.5
Session 2
Diffusion MRI was acquired using a 2D diffusion tensor imaging echo planar imaging (DTIEPI) sequence with the following particular parameters: b-values = 0, 300, and 1000 s/mm2 with 5, 12, and 18 directions, respectively. Multi-echo gradient-echo (MGE) and multi-slice multi-echo (MSME) sequences were performed for R2 and R2* mapping before and after USPIO injection.
Data processing
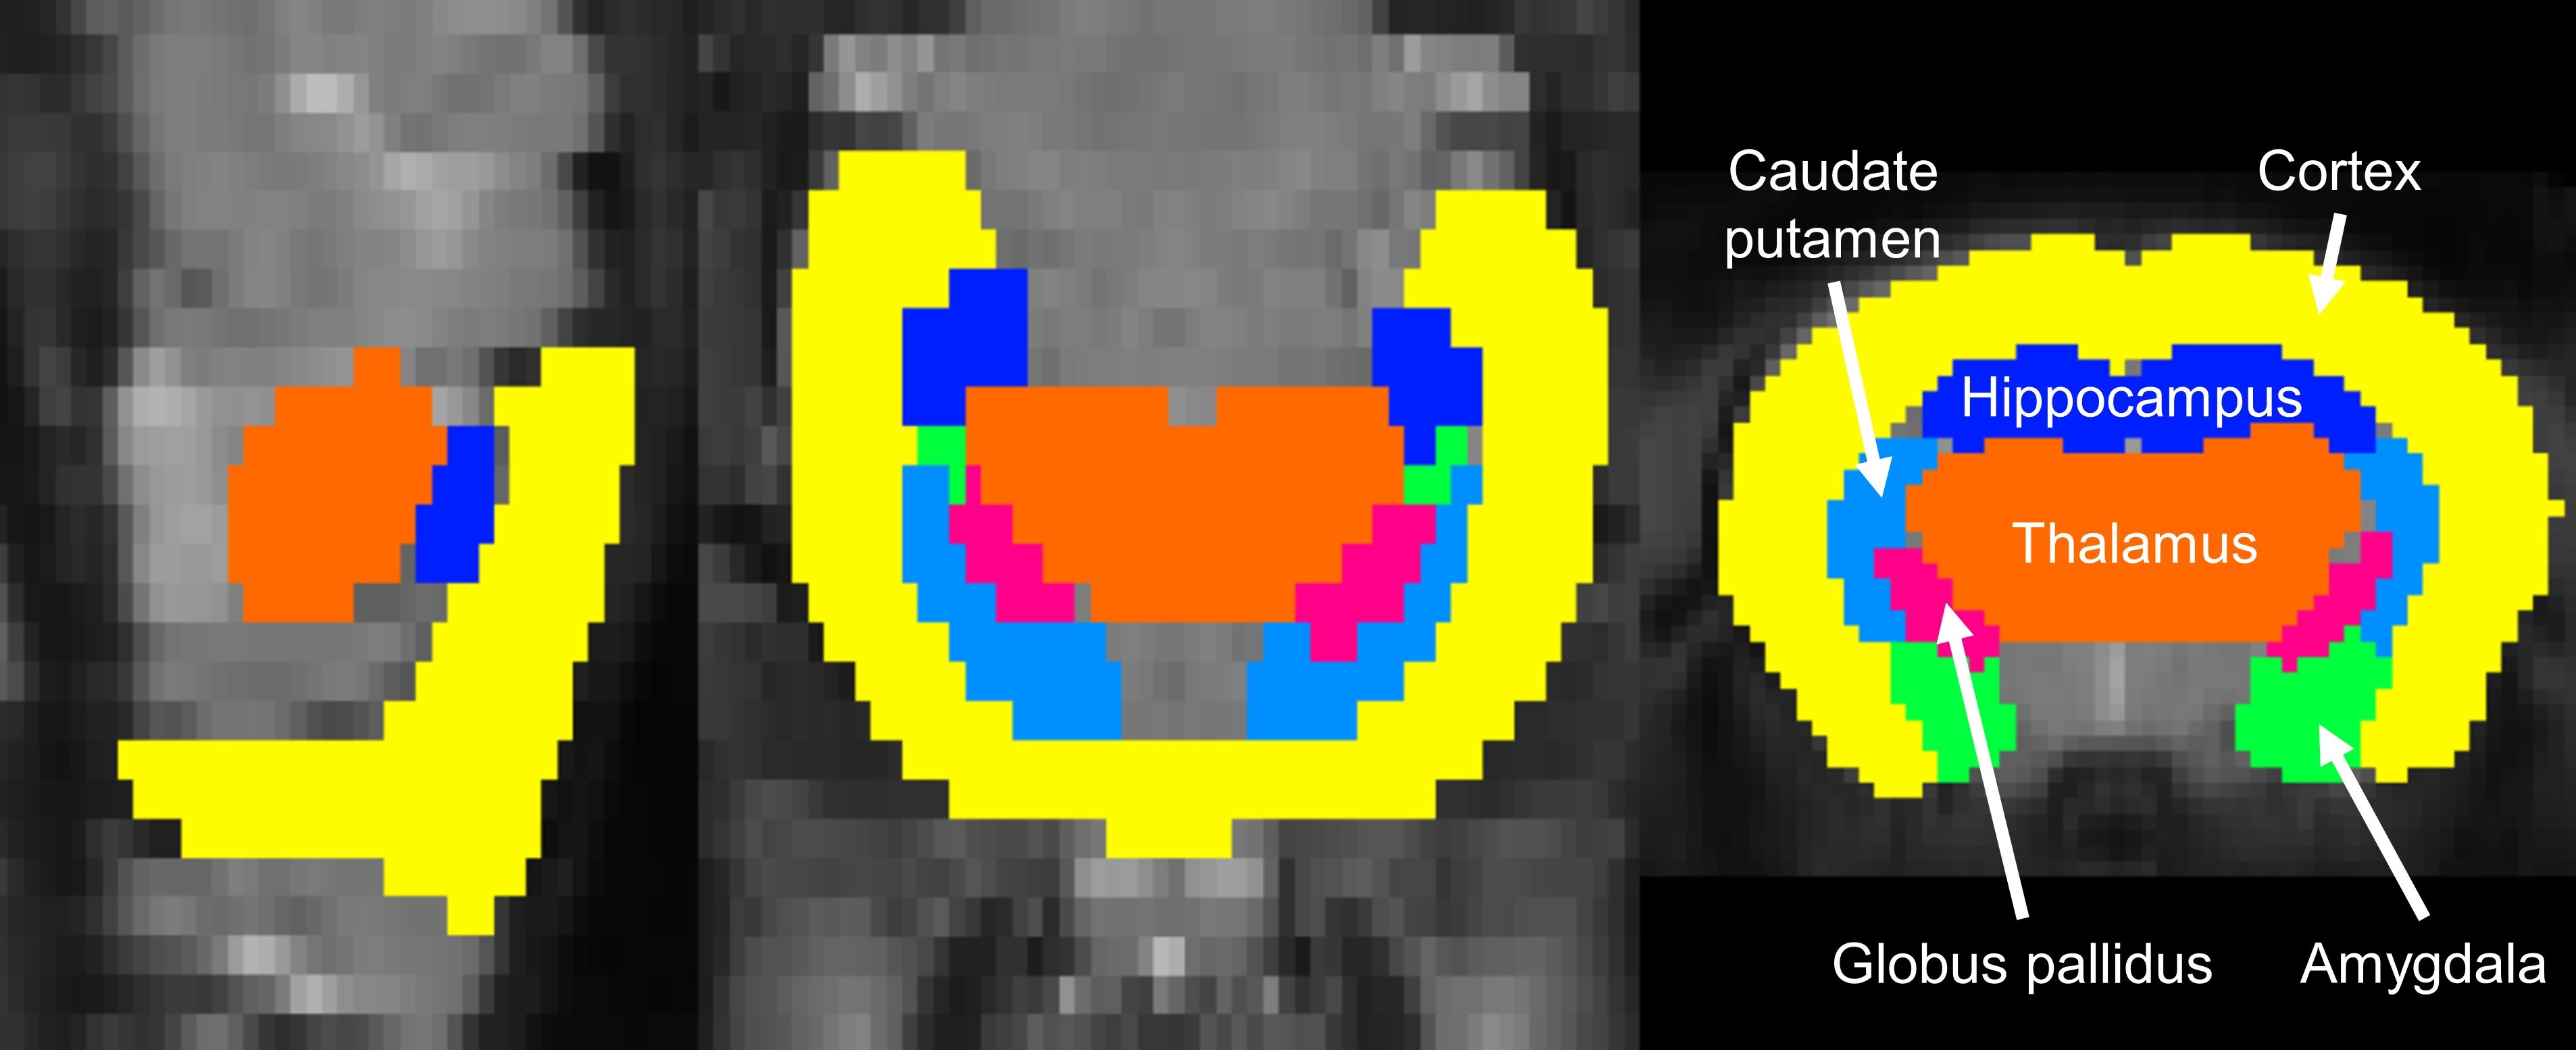
CBF from pCASL MRI was estimated using FastMap software.6 CBF and CBV from GESE DSC MRI were derived by using pgui modeling software (Center for Functionally Integrative Neuroscience, Aarhus University Hospital, Denmark). The mean diffusivity (MD) was calculated using the ‘DTIFit’ function in FSL. Relative VSI (rVSI) was assessed in two ways: one based on the ΔR2 and ΔR2* values from GESE DSC MRI (aka dynamic VSI) and the other based on the R2 and R2* mapping (aka steady-state VSI), in combination with MD and GE CBV.7,8,9 All the resulting maps were aligned into a T1-weighted anatomical image of a single mouse.10 The brain ROIs were extracted from the mouse-Ma template of FastMap software (Figure 2). The values of perfusion parameters within each ROI were compared among the groups and the correlations between them were evaluated.
Results
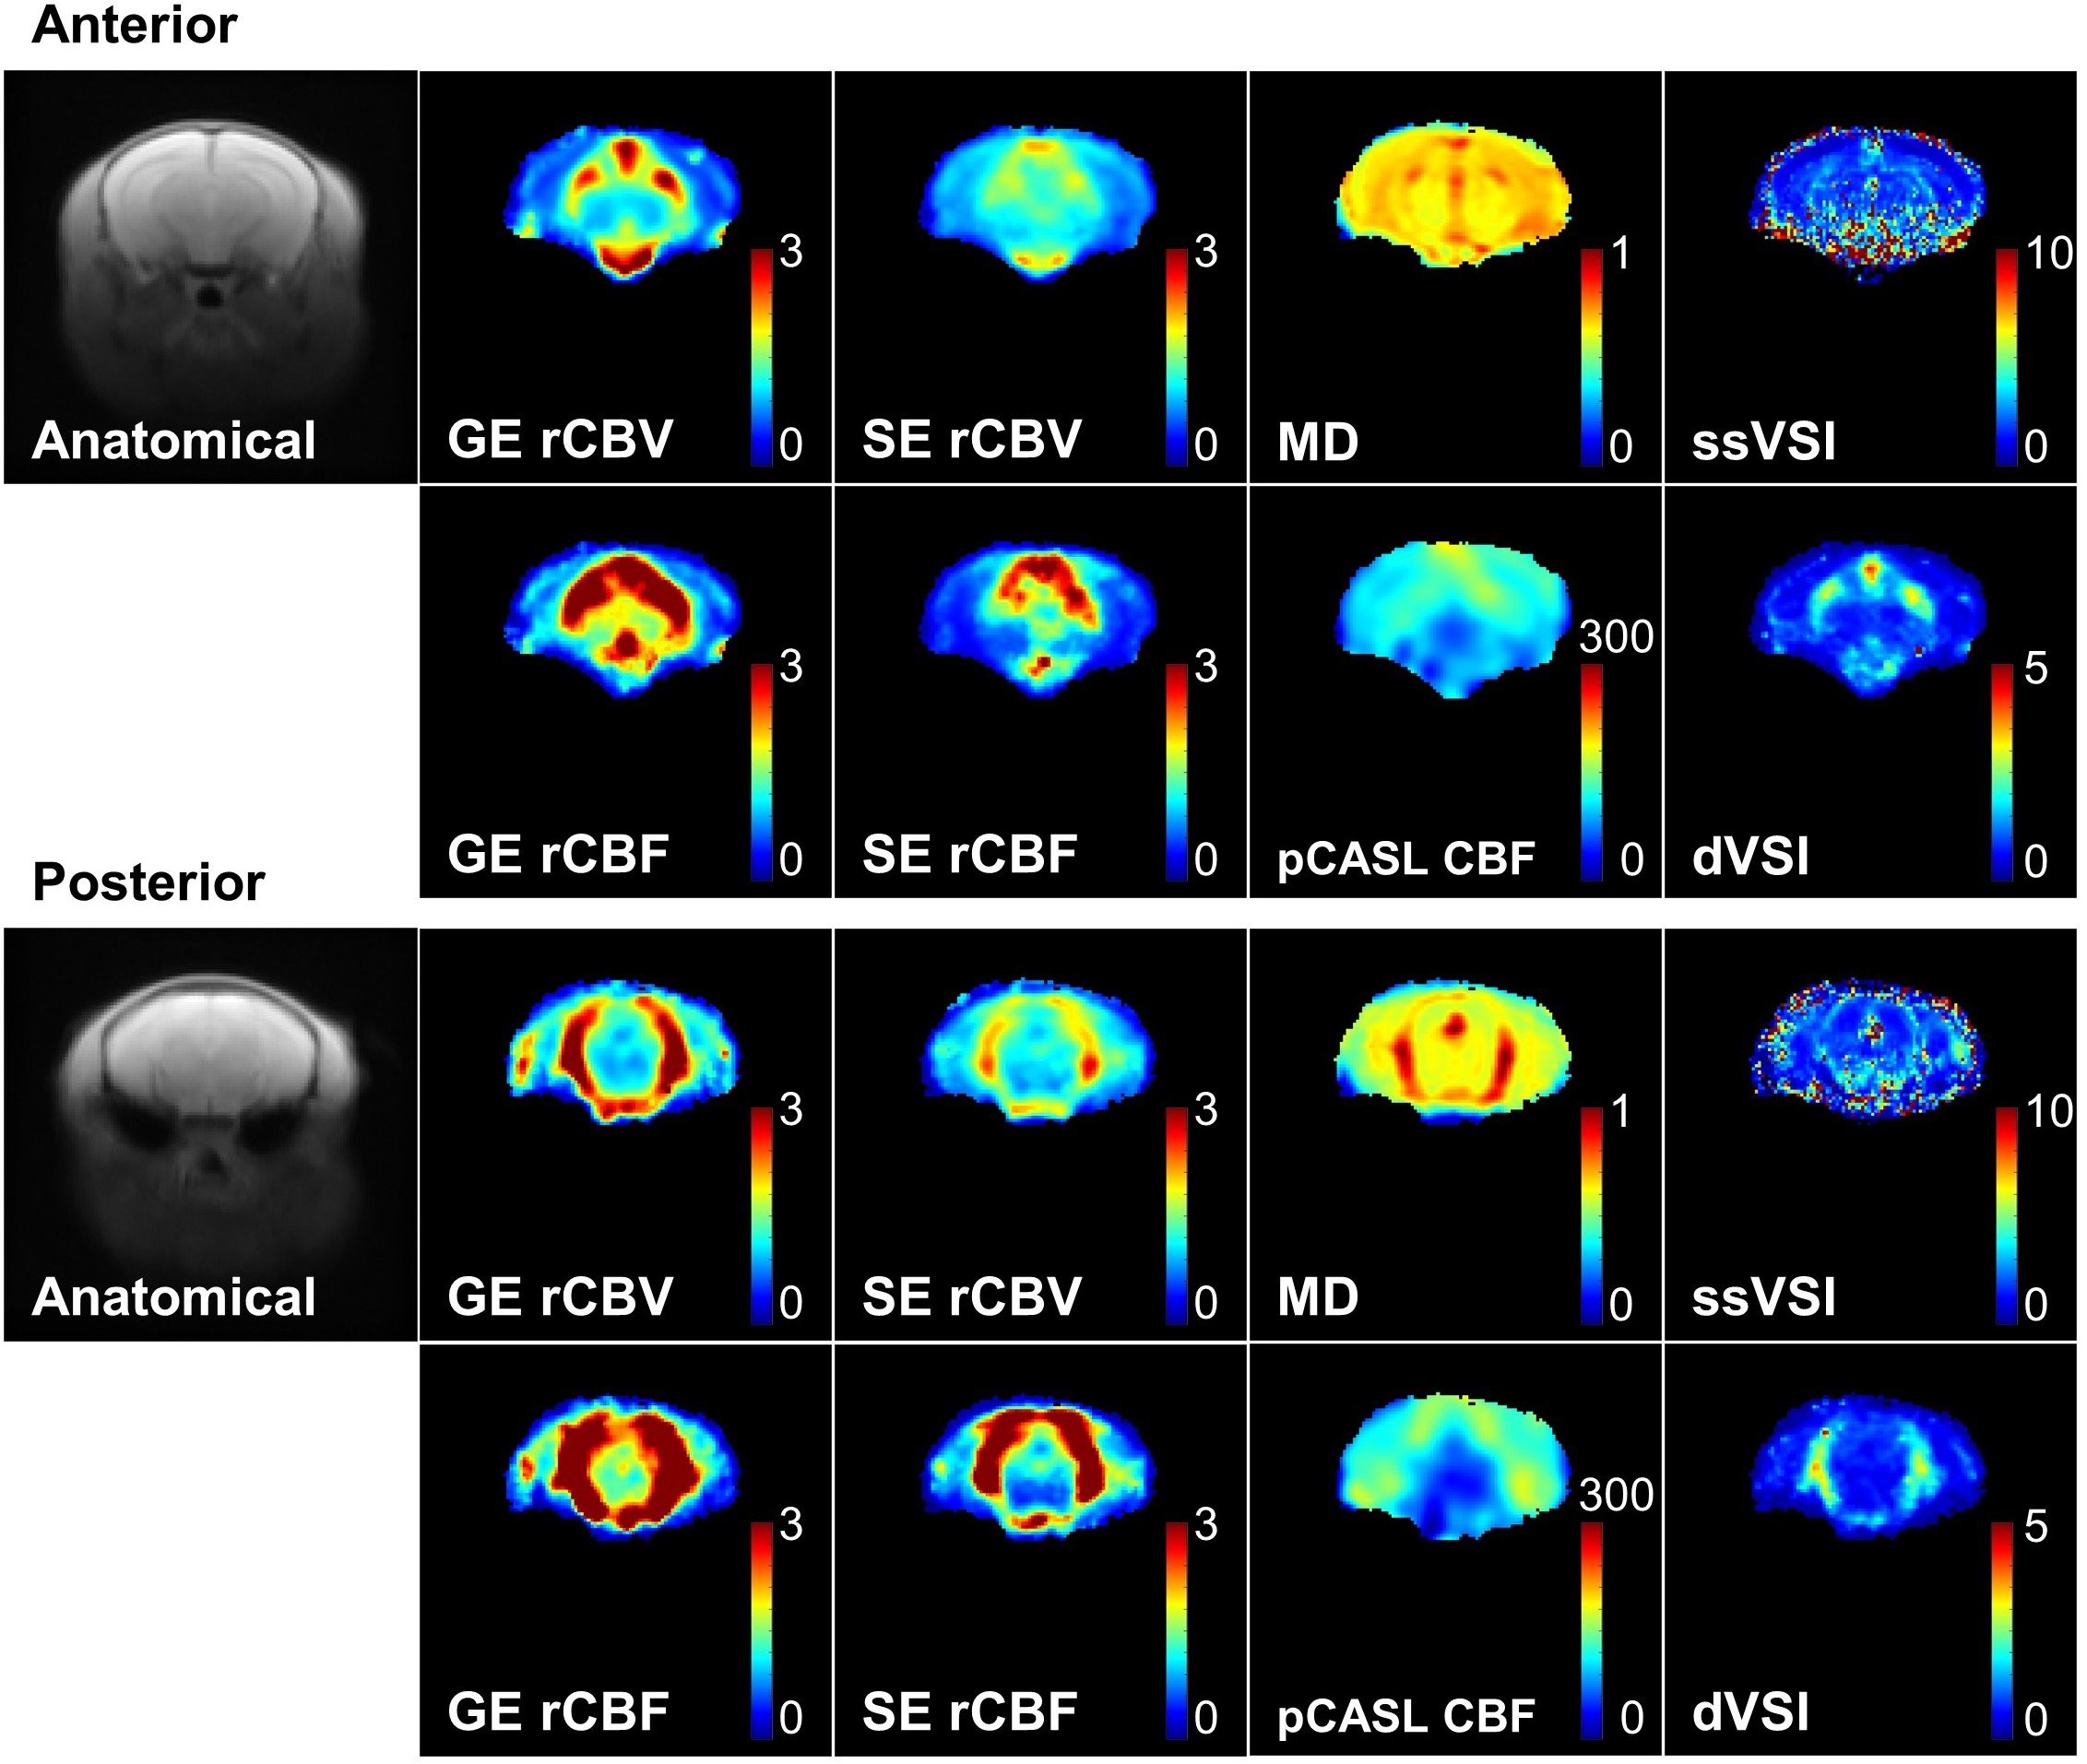
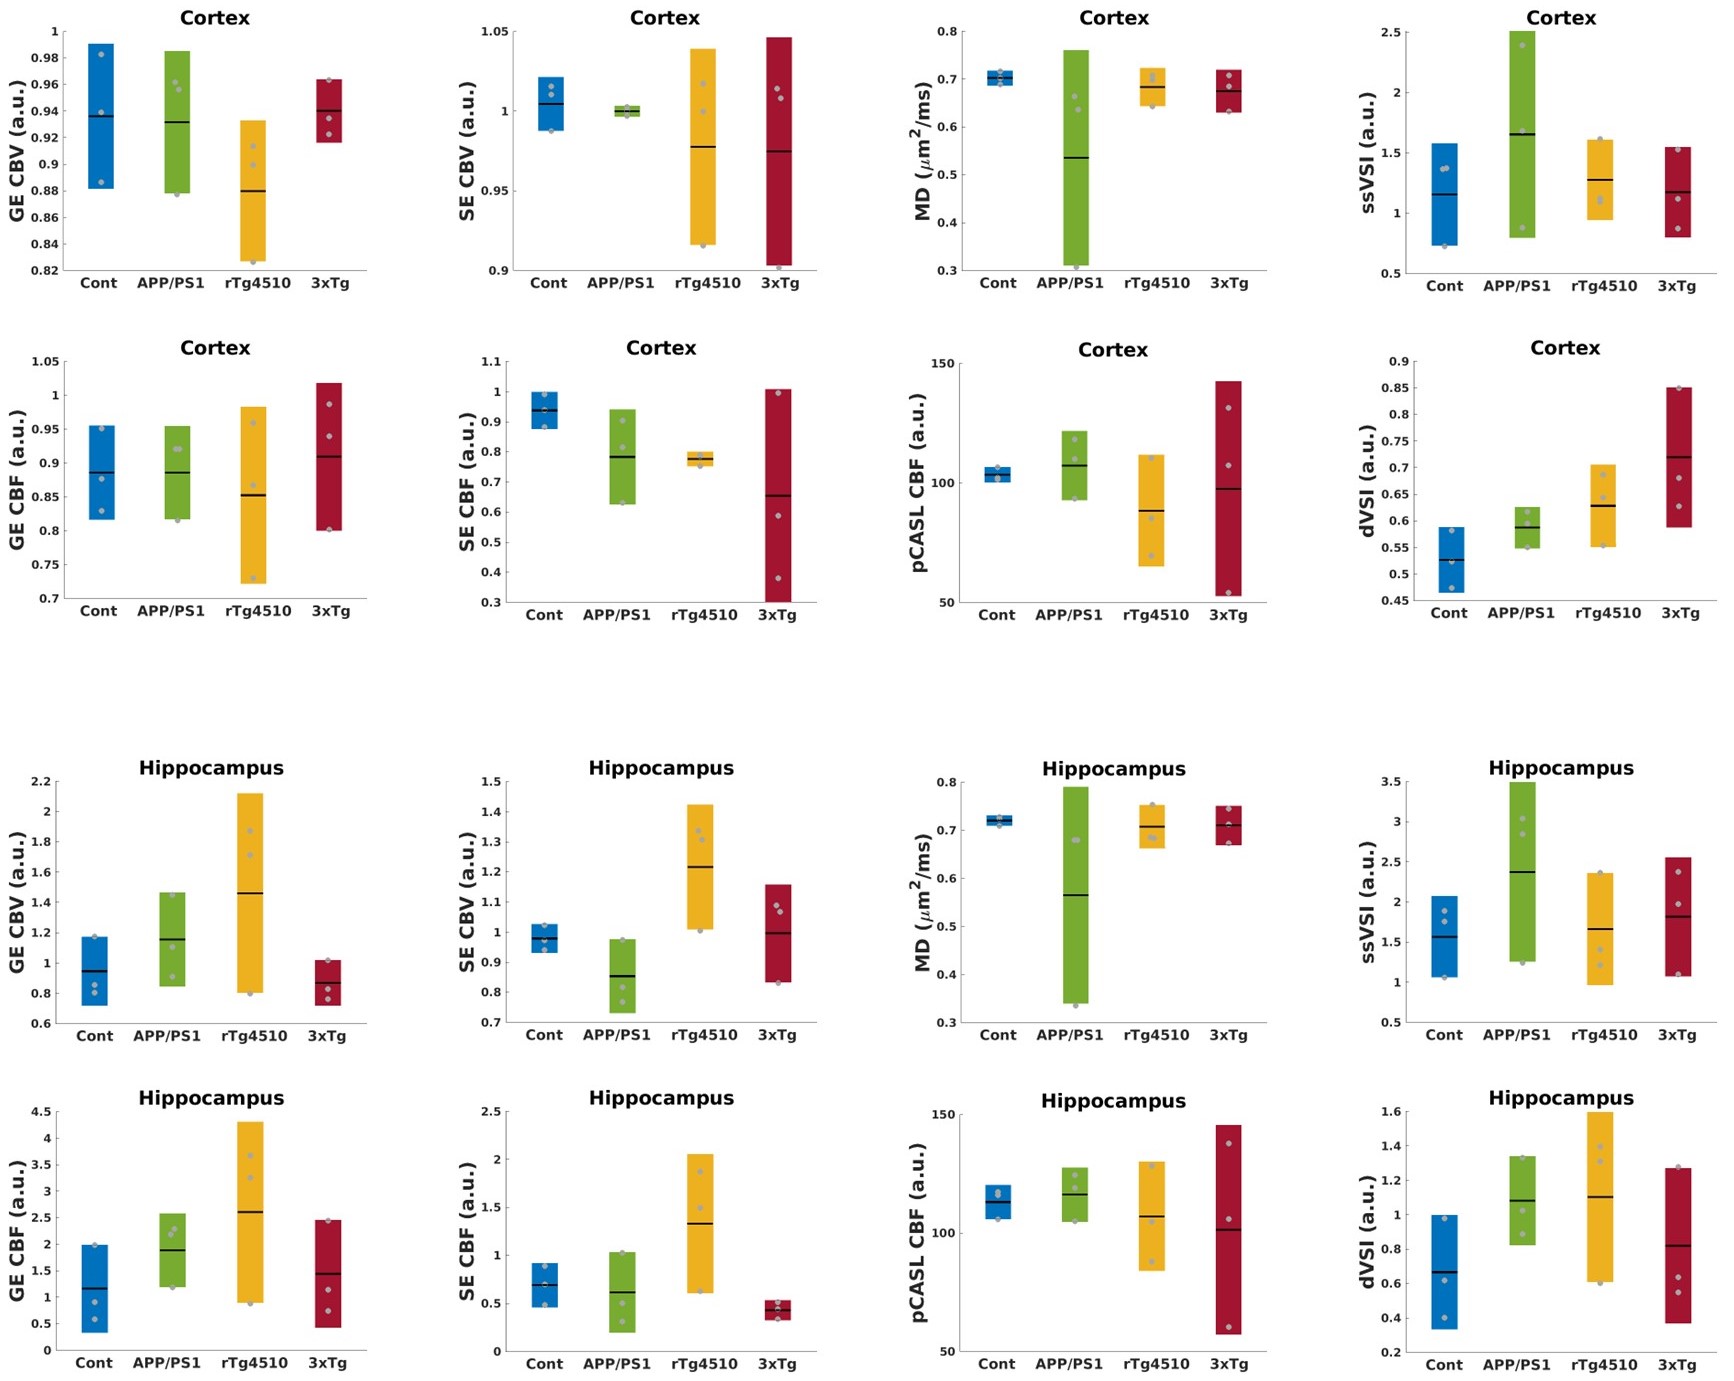
Representative perfusion and diffusion MR images averaged across all the mice are shown in Figure 3. There’s no significant group difference in perfusion and diffusion parameters in all the ROIs (Figure 4). The dynamic VSI was found significantly correlated with GE CBV (Spearman-r=0.90; P<0.001) and GE CBF (Spearman-r=0.90; P<0.001) in the hippocampus (Figure 5).Discussions & Conclusion
In this study, we found no statistically significant difference in the perfusion parameters among groups, which is not unexpected given that 4 months of age in mice roughly corresponds to young adulthood in humans and the animals were likely still at the pre-symptom stage. We also found a positive correlation between vessel size and the blood flow and blood volume in the hippocampus of transgenic AD mouse models. Further longitudinal research is warranted to continue investigating cerebrovascular alterations as a function of age and AD pathology in AD mice. We are currently planning for a cross-sectional study, parallel to the longitudinal study, to acquire ex vivo microscopy of the vessel structure to relate to in vivo rVSI, CBV, and CBF maps for better validation and interpretation of the in vivo MR measures of perfusion and vasculature.Acknowledgements
This work was funded by NIH R21AG067562 and R00AG061259. We thank Dr. DongKyu Lee for his valuable insight and discussions regarding co-registration techniques. We thank Dr. Joseph B. Mandeville for his generous support of the FastMap software.References
1. Govindpani K, McNamara LG, Smith NR, et al. Vascular Dysfunction in Alzheimer's Disease: A Prelude to the Pathological Process or a Consequence of It?. Journal of Clinical Medicine. 2019;8(5):651.
2. Sweeney MD, Kisler K, Montagne A, et al. The role of brain vasculature in neurodegenerative disorders. Nature neuroscience. 2018;21(1):1318-1331.
3. Iturria-Medina Y, Sotero RC, Toussaint PJ, et al. Early role of vascular dysregulation on late-onset Alzheimer’s disease based on multifactorial data-driven analysis. Nature communications. 2016;7(1):11934.
4. Bennett RE, DeVos SL, Dujardin S, et al. Enhanced tau aggregation in the presence of amyloid β. The American journal of pathology. 2017;187(7):1601-1612.
5. Farrar CT, Kamoun WS, Ley CD, et al. In vivo validation of MRI vessel caliber index measurement methods with intravital optical microscopy in a U87 mouse brain tumor model. Neuro-oncology. 2010;12(4):341-350.
6. https://www.nmr.mgh.harvard.edu/~jbm/fastmap/
7. Kiselev VG, Strecker R, Ziyeh S, et al. Vessel size imaging in humans. Magnetic Resonance in Medicine. 2005;53:553-563.
8. Hsu YY, Yang WS, Lim KE, et al. Vessel size imaging using dual contrast agent injections. Journal of Magnetic Resonance Imaging. 2009;30:1078-1084.
9. Troprès I, Pannetier N, Grand S, et al. Imaging the microvessel caliber and density: principles and applications of microvascular MRI. Magnetic resonance in medicine. 2015;73(1):325-341.
10. Avants BB, Tustison NJ, Song G, et al. A reproducible evaluation of ANTs similarity metric performance in brain image registration. Neuroimage. 2011;54(3):2033-2044.
Figures