4033
Correlations between alterations in resting-state functional dynamics and memory impairments in the TgF344-AD rat model of Alzheimer’s Disease1Bio-Imaging Lab, Biomedical Sciences, University of Antwerp, Antwerp, Belgium, 2µNEURO Research Centre of Excellence, University of Antwerp, Antwerp, Belgium
Synopsis
Keywords: Alzheimer's Disease, Alzheimer's Disease
Motivation: Resting-state fMRI studies of Alzheimer’s disease impact on brain’s function commonly use functional connectivity (FC) ignoring sensitive and dynamic readouts such as the co-activation patterns (CAPs) occurring at short timescales.
Goal(s): We aimed to assess changes in CAPs, in addition to network-level FC, in a transgenic rat model of Alzheimer’s disease longitudinally.
Approach: We acquired high temporal resolution resting-state fMRI and performed FC and CAP analysis.
Results: We found increased lateral cortical network FC that correlated with memory impairments at the plaque stage, and hyper and hypoactivation of the default-mode-like-network and hippocampal regions in two CAPs at the pre-plaque and plaque stages respectively.
Impact: Our findings demonstrate that metrics of brain dysfunction of Alzheimer’s disease derived from high temporal resolution resting-state fMRI not only explain behavioural manifestations but also capture alterations preceding plaque formation further validating their translational potential as an early, functional biomarker.
Introduction
Resting-state functional MRI (rsfMRI) has been instrumental in characterizing brain dysfunction due to Alzheimer’s disease (AD) from a network perspective1. In addition to traditional functional connectivity (FC) analyses, dynamic FC states such as co-activation patterns (CAPs)2,3 reveal functional network dynamics at short timescales that are accurate at classifying transgenic rodents4,5 of AD from healthy controls. Here, we used rsfMRI to evaluate AD’s functional impact at pre-plaque and plaque stages in the TgF344-AD rat model using FC and CAPs and then correlated them with memory impairments at the plaque stage.Methods
Fifteen TgF344-AD (TG) and 15 wildtype (WT) rats underwent rsfMRI scans, under anesthesia (isoflurane/medetomidine), at 4 (pre-plaque) and 10 (plaque stage) months of age using a 9.4T MRI-system (TR 0.6s, 1000 GE-EPI volumes). Post 10-month scans, we assessed learning and memory using a radial arm maze (RAM) consisting of a central platform and 8 arms. After a habituation phase (5-7 days), food was placed in four arms, and food-restricted rats were tested for working and reference memory in the acquisition phase (10 days). We pre-processed MRI images using an in-house MATLAB pipeline and SPM12 and calculated region of interest (ROI), and network-level FC. We obtained CAPs by (a) clustering concatenated pre-processed volumes of all 30 subjects at both ages into 2-20 clusters, using spatial correlation distance, (b) identifying the optimal number of clusters, and (c) taking the voxel-wise average across all volumes with identical cluster membership. Group and age effects on FC, spatial, and temporal properties of the CAPs were assessed using repeated measures ANOVA. Behavioral learning curves were analyzed for multiple metrics of reference and working memory and correlated with FC. Finally, cross-validated (80-20 train test split) accuracy of CAP temporal and spatial features to classify the animals into four classes (TG 4M, TG 10M, WT 4M, WT 10M) was evaluated.Results
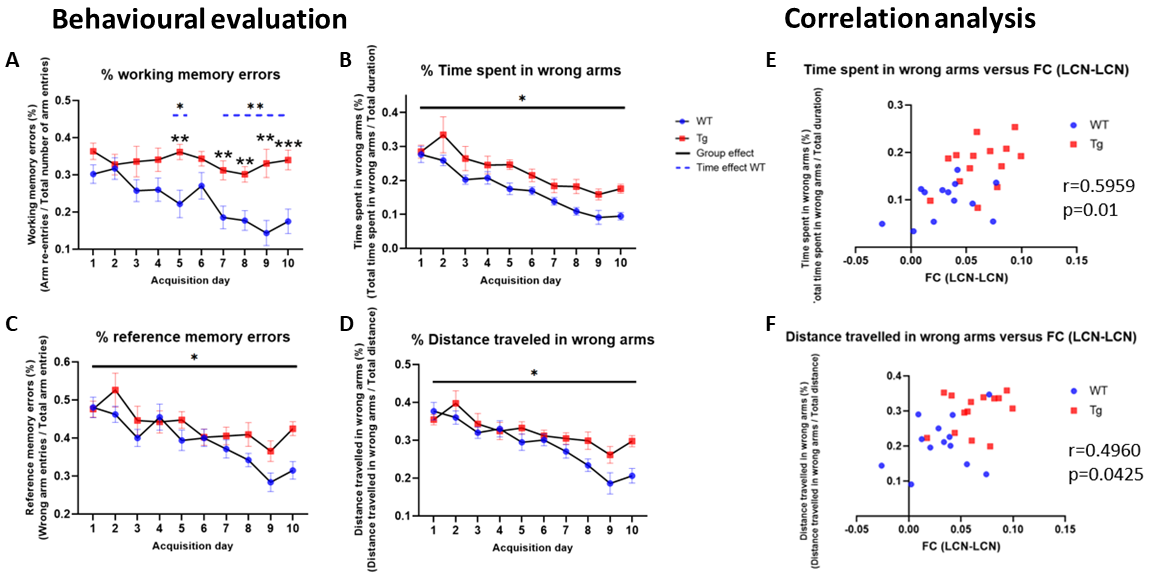
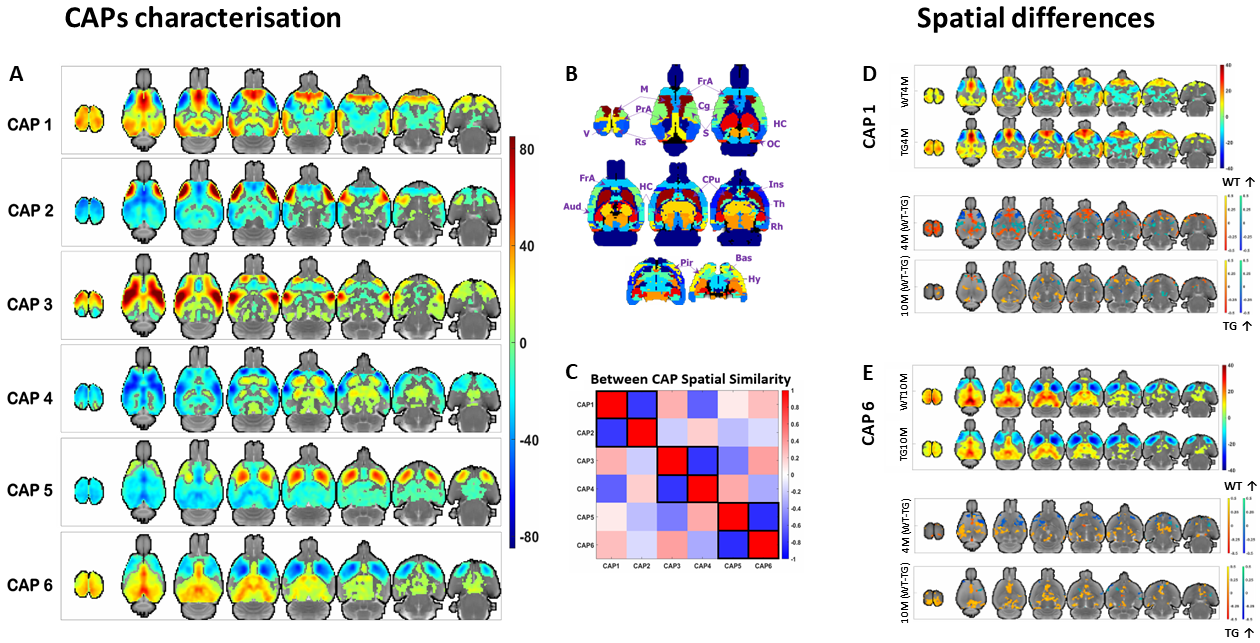
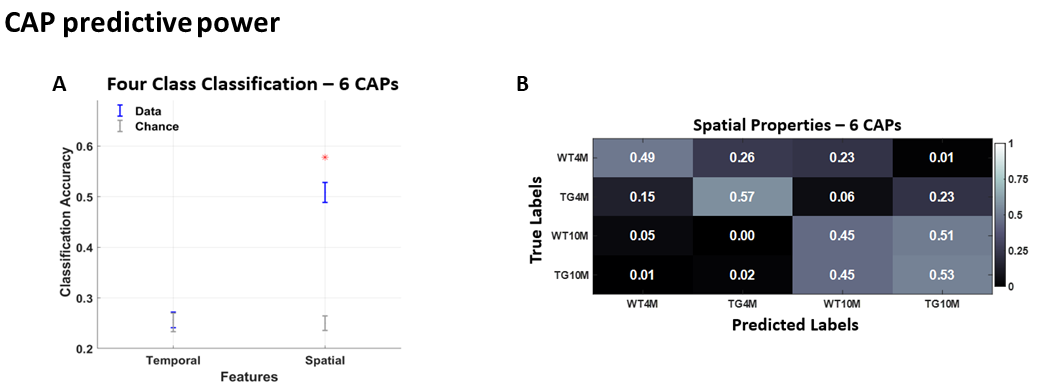
WT rats improved their working memory over time while TG rats did not. TG rats committed more reference memory errors and explored more arms in the RAM than WT rats (Fig 1A-D). ROI-FC did not show a significant genotype or age effect for any connection (P > 0.05, FDR corrected). Lateral cortical network (LCN) FC was significantly increased in TG (p < 0.05, FDR corrected for 25 within- & between-network FC comparisons) at the plaque stage and correlated with reference memory errors and time in incorrect arms (Fig 1 E-F). Six CAPs in 3 pairs of anticorrelated patterns (Fig 2A, C) were found to be optimal; they explained saturation-level variance across all subjects’ volumes. No significant genotype or age effects were observed in CAPs’ temporal properties. CAPs' spatial activation showed a significant interaction effect for several voxels/CAPs. At the pre-plaque stage, we found functional hyperactivation in the default mode-like network (DMLN) regions and hippocampal formation in CAP 1 (Fig 2D, panel 3 from top), and in the cingulate region in CAP 6 (Fig 2E, panel 3). At the post-plaque stage, TG rats presented a general decrease in activation levels, especially in hub regions within the DMLN (Fig 2D & E, bottom panels). These changes are also reflected in significantly higher than-chance classification accuracy when spatial features of CAPs were used as features (Fig 3A). The confusion matrix showed the highest prediction for the TG 4M group and confusion between the genotypic groups at the plaque stage (Fig 3B).Discussion
Correlation between significantly higher LCN FC with memory impairments at the plaque stage demonstrates importance of rsfMRI in understanding AD’s impact on brain’s functional architecture. Hyperactivation found in the default mode-like network regions such as the cingulate cortex and the hippocampus at the pre-plaque stage is in line with a widely accepted view that abnormal neuronal activities precede the plaque formation in animal and cell models6. During memory encoding tasks, hippocampal hyperactivation and decreased inactivation of the DMLN hub regions has been reported as a consistent fMRI signature of AD, particularly at the early stages7. A pathogenic role in early hyperactivation is further supported by observation that individuals with AD exhibit increased susceptibility to epilepsy and seizures, particularly, in early-onset familial AD7. Thus, our findings using RS-CAPs demonstrate AD phenotypes that are consistent with studies using other techniques such as electrophysiology and task-fMRI.Conclusion
Our findings demonstrate the effectiveness of high temporal resolution rsfMRI and advanced analyses such as co-activation patterns to tease out signatures of Alzheimer’s disease in a transgenic rat model. In a next step, we will use CAP activations and FC changes at pre and plaque stages to predict memory impairments found in this study using a cross-validated machine learning approach.Acknowledgements
This work was funded by FWO-G045420N (MV), Stichting Alzheimer Onderzoek (SAO‐FRA 2020/027 (MV). The computational resources and services were provided by the HPC core facility CalcUA, the VSC, funded by the Hercules Foundation, and the Flemish Government department EWI. The Bruker Biospec 9.4T system was upgraded to AVANCE-NEO through Hercules Foundation funding (I007120N -MV-co-promotor).References
- Badhwar, A. et al. Resting-state network dysfunction in Alzheimer’s disease: A systematic review and meta-analysis. Alzheimers Dement (Amst) 8, 73–85 (2017).
- Liu, X. & Duyn, J. H. Time-varying functional network information extracted from brief instances of spontaneous brain activity. PNAS 110, 4392–4397 (2013).
- Gutierrez-Barragan, D., Basson, M. A., Panzeri, S. & Gozzi, A. Infraslow State Fluctuations Govern Spontaneous fMRI Network Dynamics. Current Biology 29, 2295-2306.e5 (2019).
- Adhikari, M. H., Belloy, M. E., Van der Linden, A., Keliris, G. A. & Verhoye, M. Resting-State Co-activation Patterns as Promising Candidates for Prediction of Alzheimer’s Disease in Aged Mice. Front. Neural Circuits 14, (2021).
- Adhikari, M. H. et al. Longitudinal investigation of changes in resting-state co-activation patterns and their predictive ability in the zQ175 DN mouse model of Huntington’s disease. Sci Rep 13, 10194 (2023).
- Targa Dias Anastacio, H., Matosin, N. & Ooi, L. Neuronal hyperexcitability in Alzheimer’s disease: what are the drivers behind this aberrant phenotype? Transl Psychiatry 12, 257 (2022).
- Kazim, S. F. et al. Neuronal Network Excitability in Alzheimer’s Disease: The Puzzle of Similar versus Divergent Roles of Amyloid β and Tau. eNeuro 8, ENEURO.0418-20.2020 (2021).
Figures