4032
Novel regional biomarkers of progressive brain degeneration in the TauPS2APP mouse model of Alzheimer’s Disease1Translational Imaging, Genentech, South San Francisco, CA, United States, 2Neuroscience, Genentech, South San Francisco, CA, United States
Synopsis
Keywords: Alzheimer's Disease, Alzheimer's Disease
Motivation: The TauPS2APP mouse is a well-established model of Alzheimer’s Disease. Traditionally, analyses focus on hippocampus and isocortex, but brain-wide analysis may yield a more comprehensive description of brain degeneration and identify additional regional biomarkers.
Goal(s): Identifying robust signatures of brain degeneration resulting from amyloidosis and tauopathy
Approach: We conducted a brain-wide voxel-based analysis of longitudinal MRI data from TauPS2APP mice collected from three studies (n=123).
Results: We found expected and persistent hippocampal and isocortical volume differences between wildtype and TauPS2APP mice. Also, we identified progressive atrophy in caudoputamen (95% of 123 TauPS2APP mice) and expansion in subiculum/hippocampal commissures (89% of 123 mice).
Impact: We identified novel and robust regional biomarkers of progressive brain degeneration in the TauPS2APP mouse model of AD. These regions are additional targets for assessing brain degeneration associated with amyloidosis and tauopathy, and for testing new therapies.
Introduction
The TauPS2APP mouse is a well-established model for Alzheimer’s Disease (AD) and is widely used in drug discovery and development1,2. While previous studies using this model have primarily focused their analyses on the isocortex and hippocampus due to their evident tau, plaque and neurodegenerative pathology, and their relevance to human AD1, pathology isn't limited to these regions. Therefore, a comprehensive brain-wide analysis can shed light on the impact of amyloidosis and tauopathy across the degenerating brain. Such an analysis can provide not only a more detailed picture of the TauPS2APP brain but also potentially unveil additional biomarkers of disease progression. In this study, we conduct a brain-wide voxel-based analysis of longitudinal quantitative MRI data from TauPS2APP mice. We do so by utilizing data from three studies to help improve the reliability and reproducibility of the results.Methods
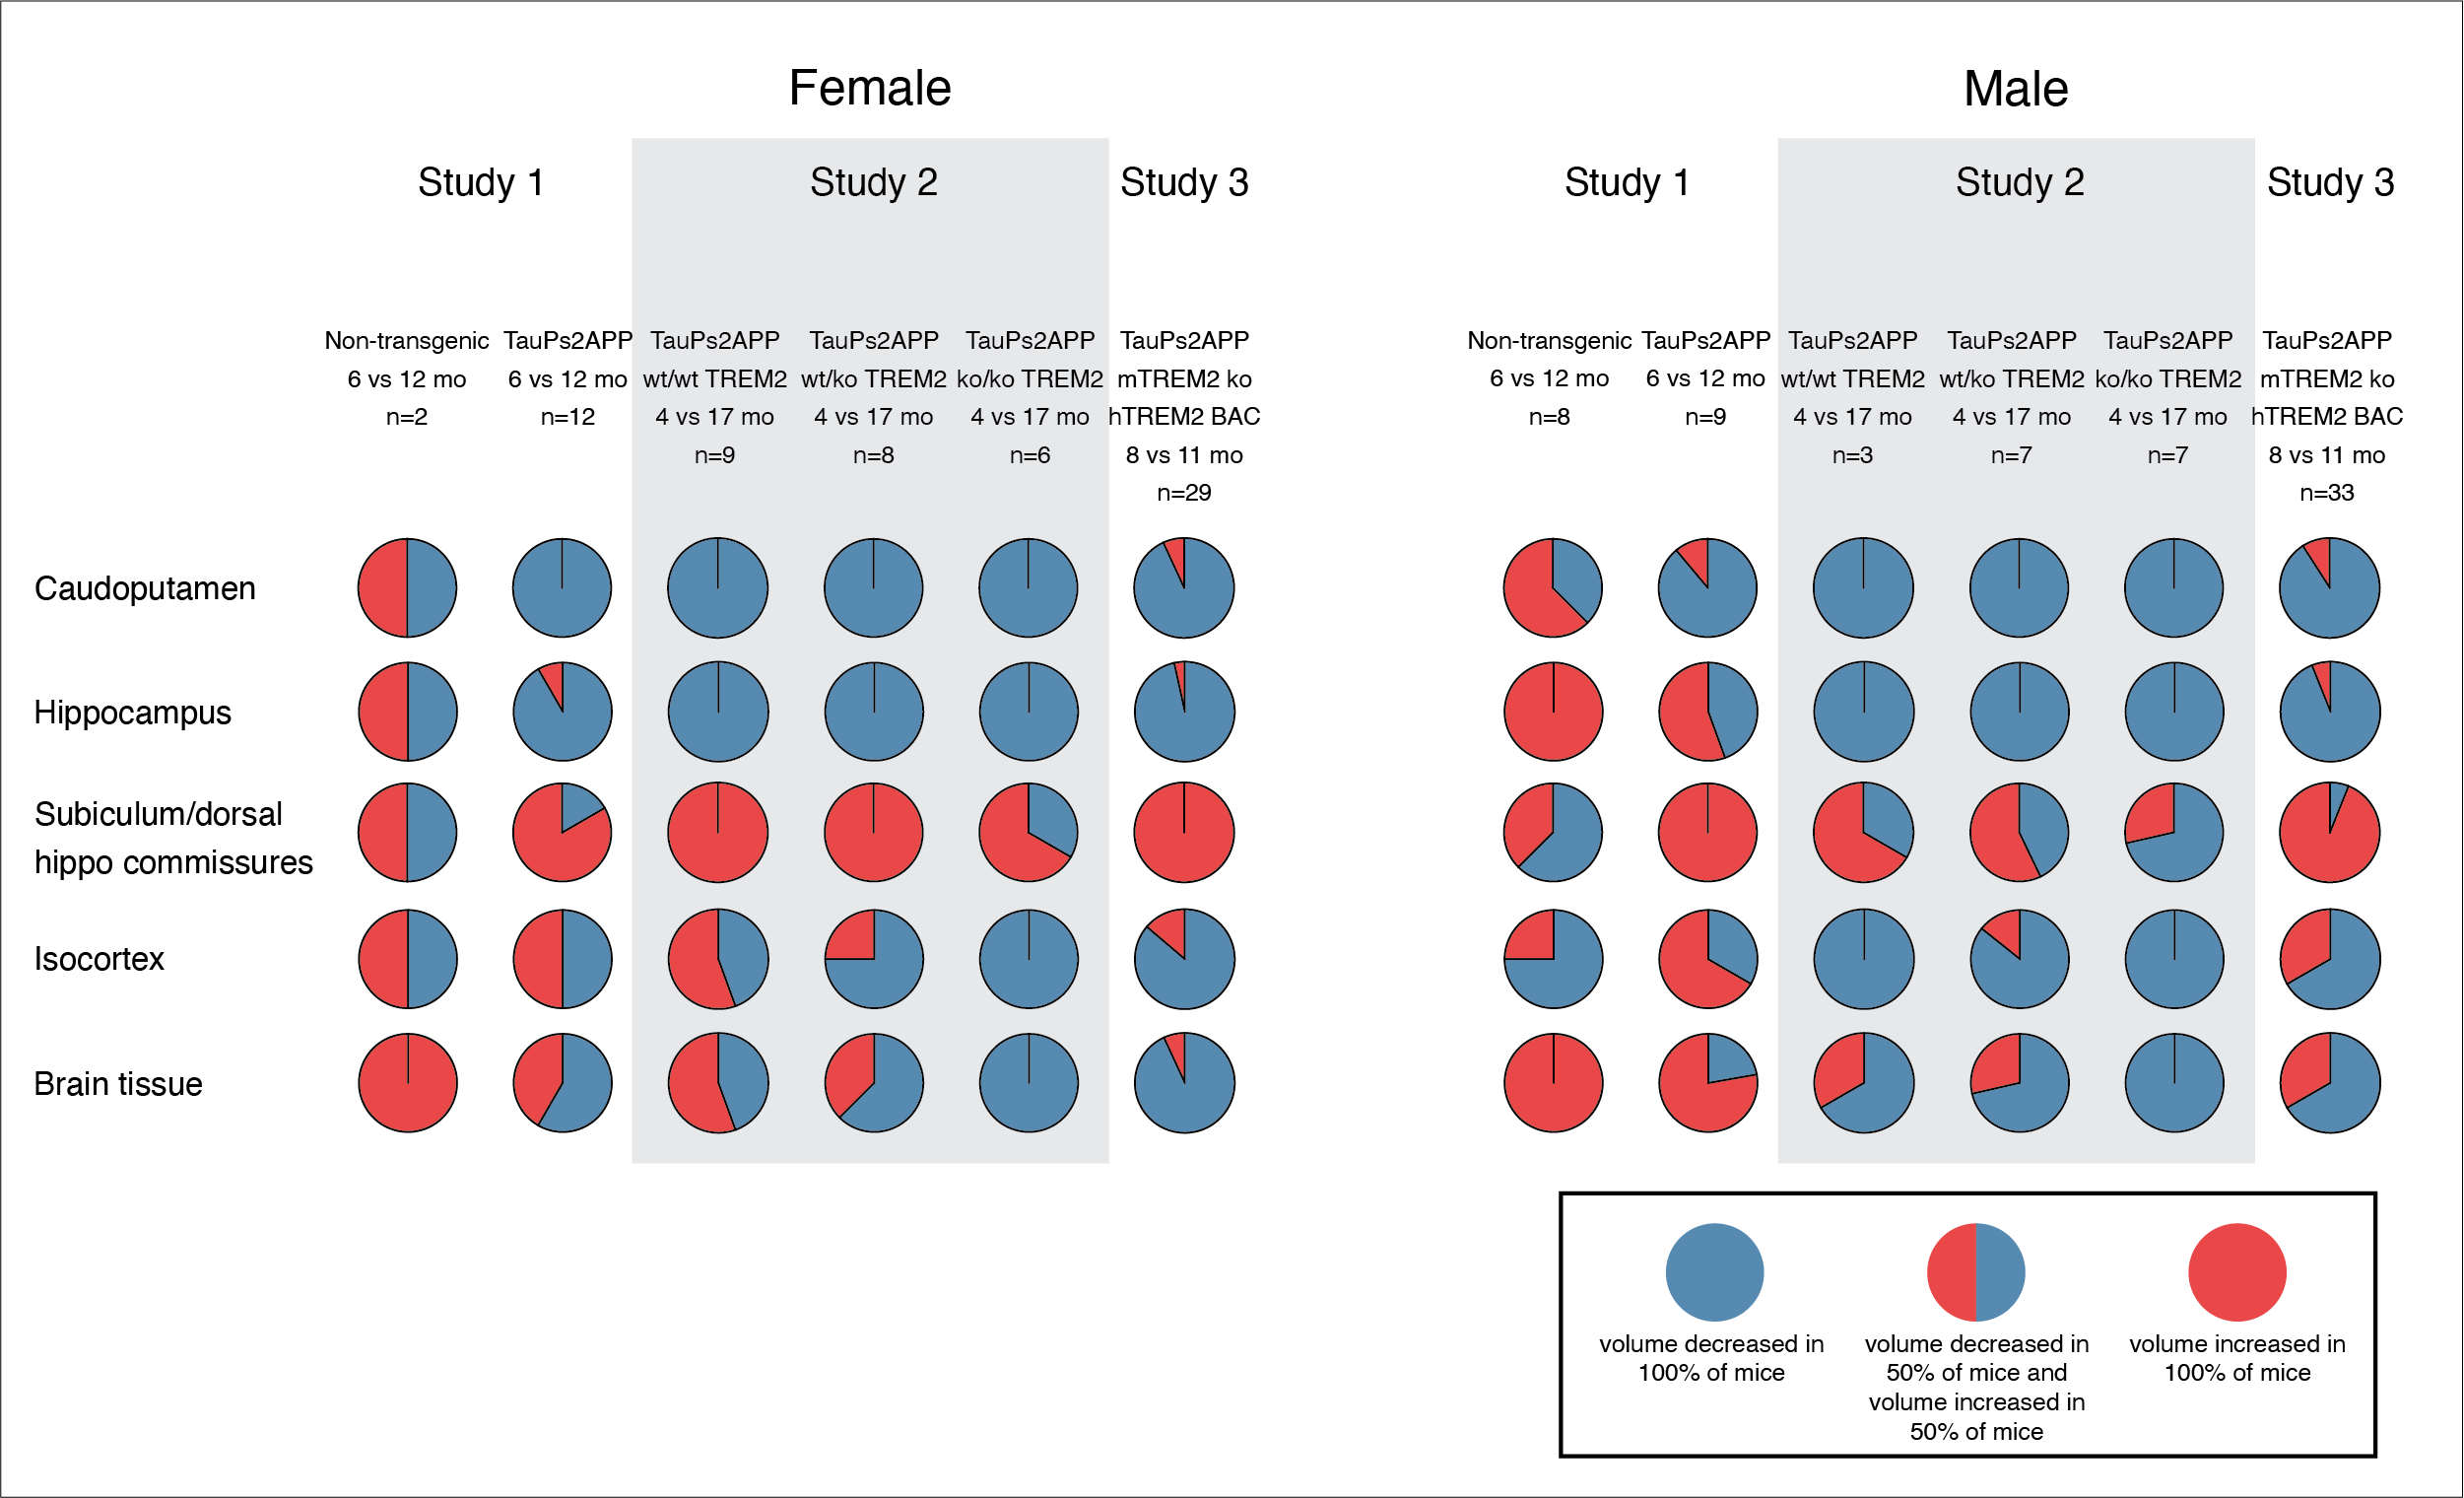
All animal procedures were approved by the institutional AAALAC-accredited review board. We analyzed three TauPS2APP mouse MRI studies that included a combination of the following: wildtype (WT) mice, TauPS2APP mice and TauPS2APP mice with TREM2 receptor modifications. In total, there were 266 whole brain datasets from 133 mice (66 females, 67 males). We have previously shown with histology and MRI that TREM2 receptor modification disrupts microglia function and accelerates amyloidosis, tauopathy and neurodegeneration in the TauPS2APP mouse2. We re-analyze the MR data from that study.MRI was performed on a Bruker BioSpec 7T or 9.4T with a cryogenically-cooled receive-only surface array coil, and an 86 mm transmit volume coil. Whole brain T2-weighted scans were acquired using a multi-slice multi-echo sequence with the following parameters: TR = 5.2 s, TE1/spacing/TE12 = 6.5/6.5/78 ms, matrix = 256 x 128 x 56, resolution = 75 x 150 x 300 µm, acquisition time = 11 min 6 s. For image analysis, brain images were registered to the Allen Brain Atlas (CCFv3) using the ANTx2 processing pipeline as reported previously3. For voxel-wise analysis, t-tests between groups or between time-points were implemented in SPM (https://www.fil.ion.ucl.ac.uk/spm/). To assess the consistency of regional changes, we extracted regional volumes and then subtracted the regional volumes at the initial time point from those at the final time point for each animal. We then categorized the results as either 'increase' or 'decrease'. Subsequently, we calculated the percentages of animals having volume increases and decreases for each region.
Results
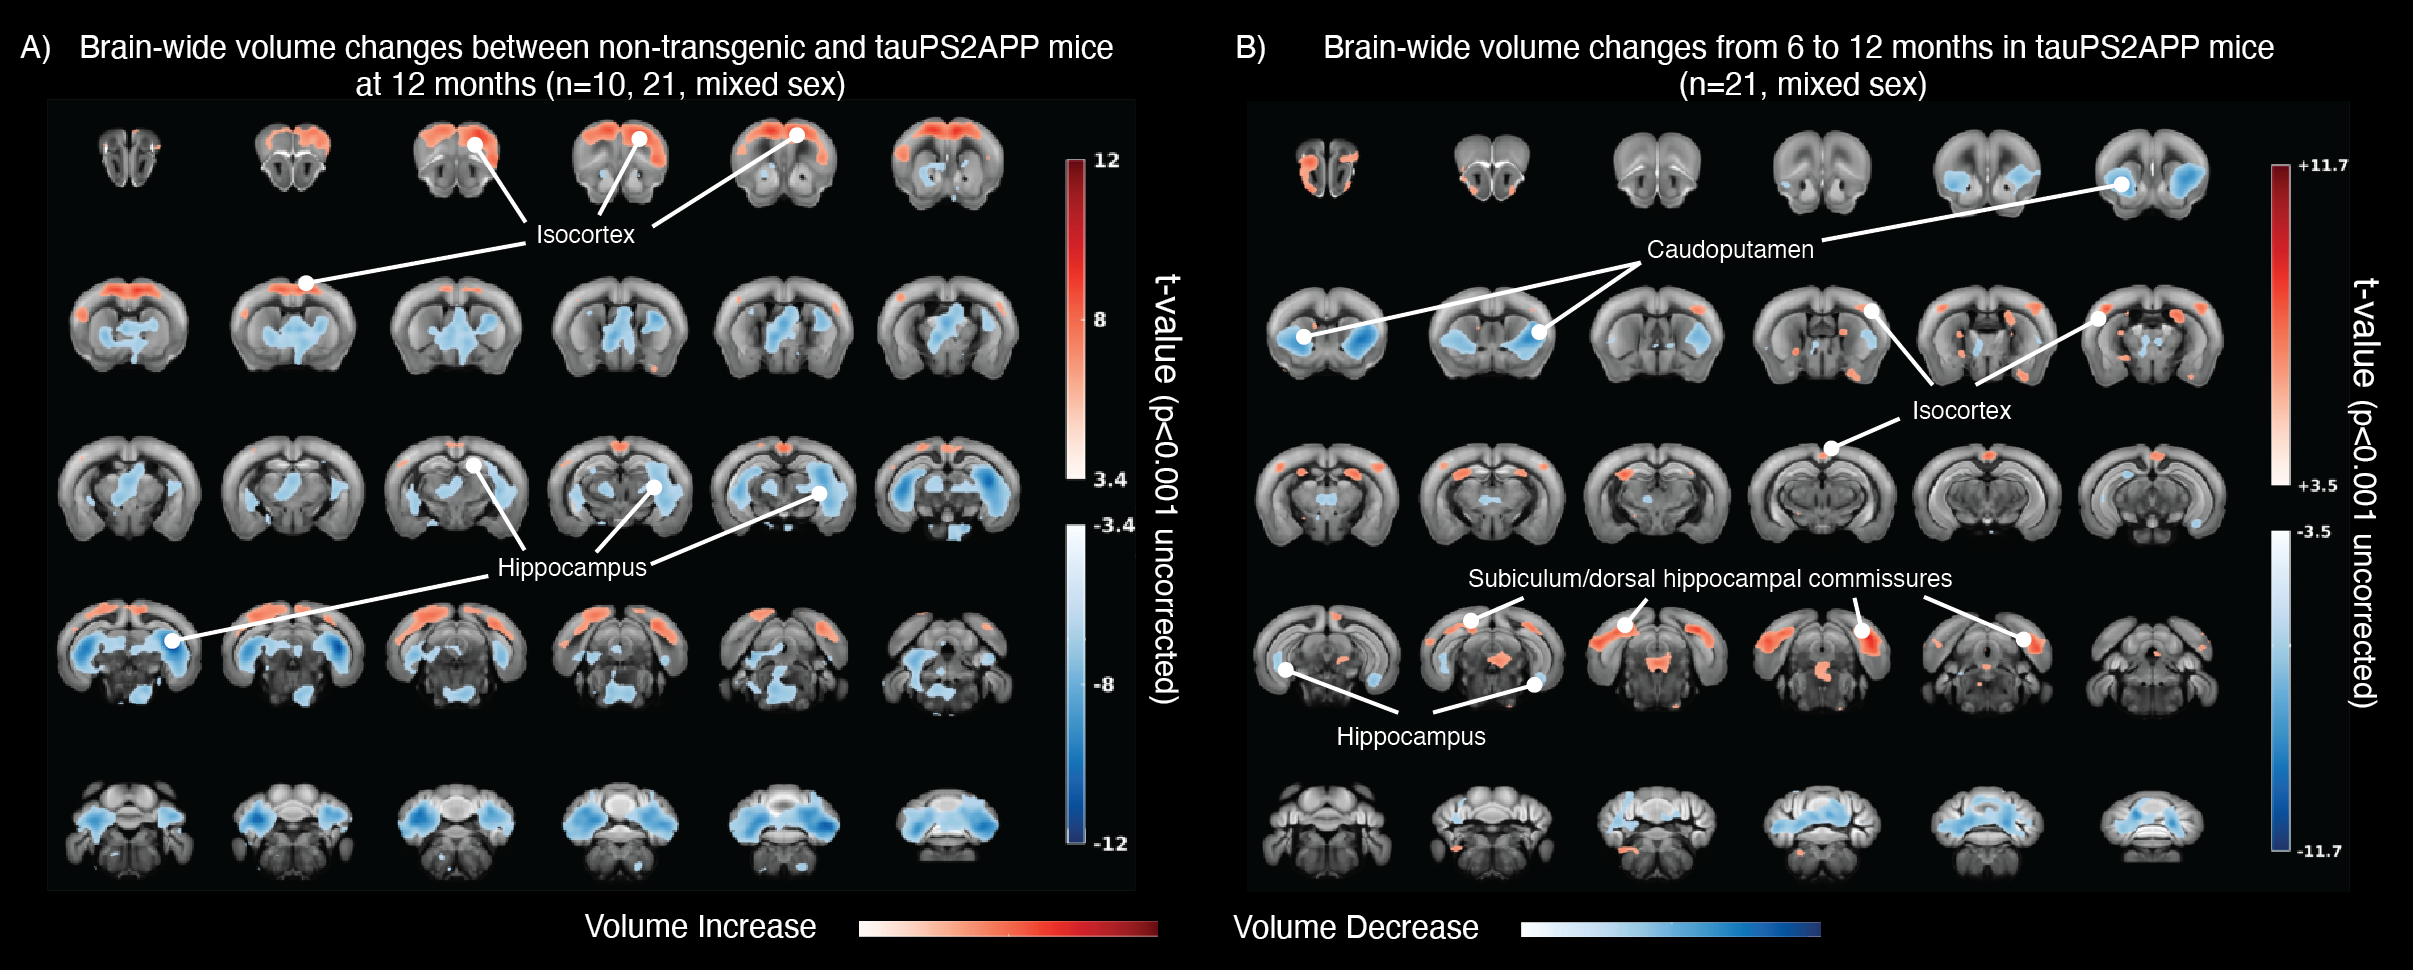
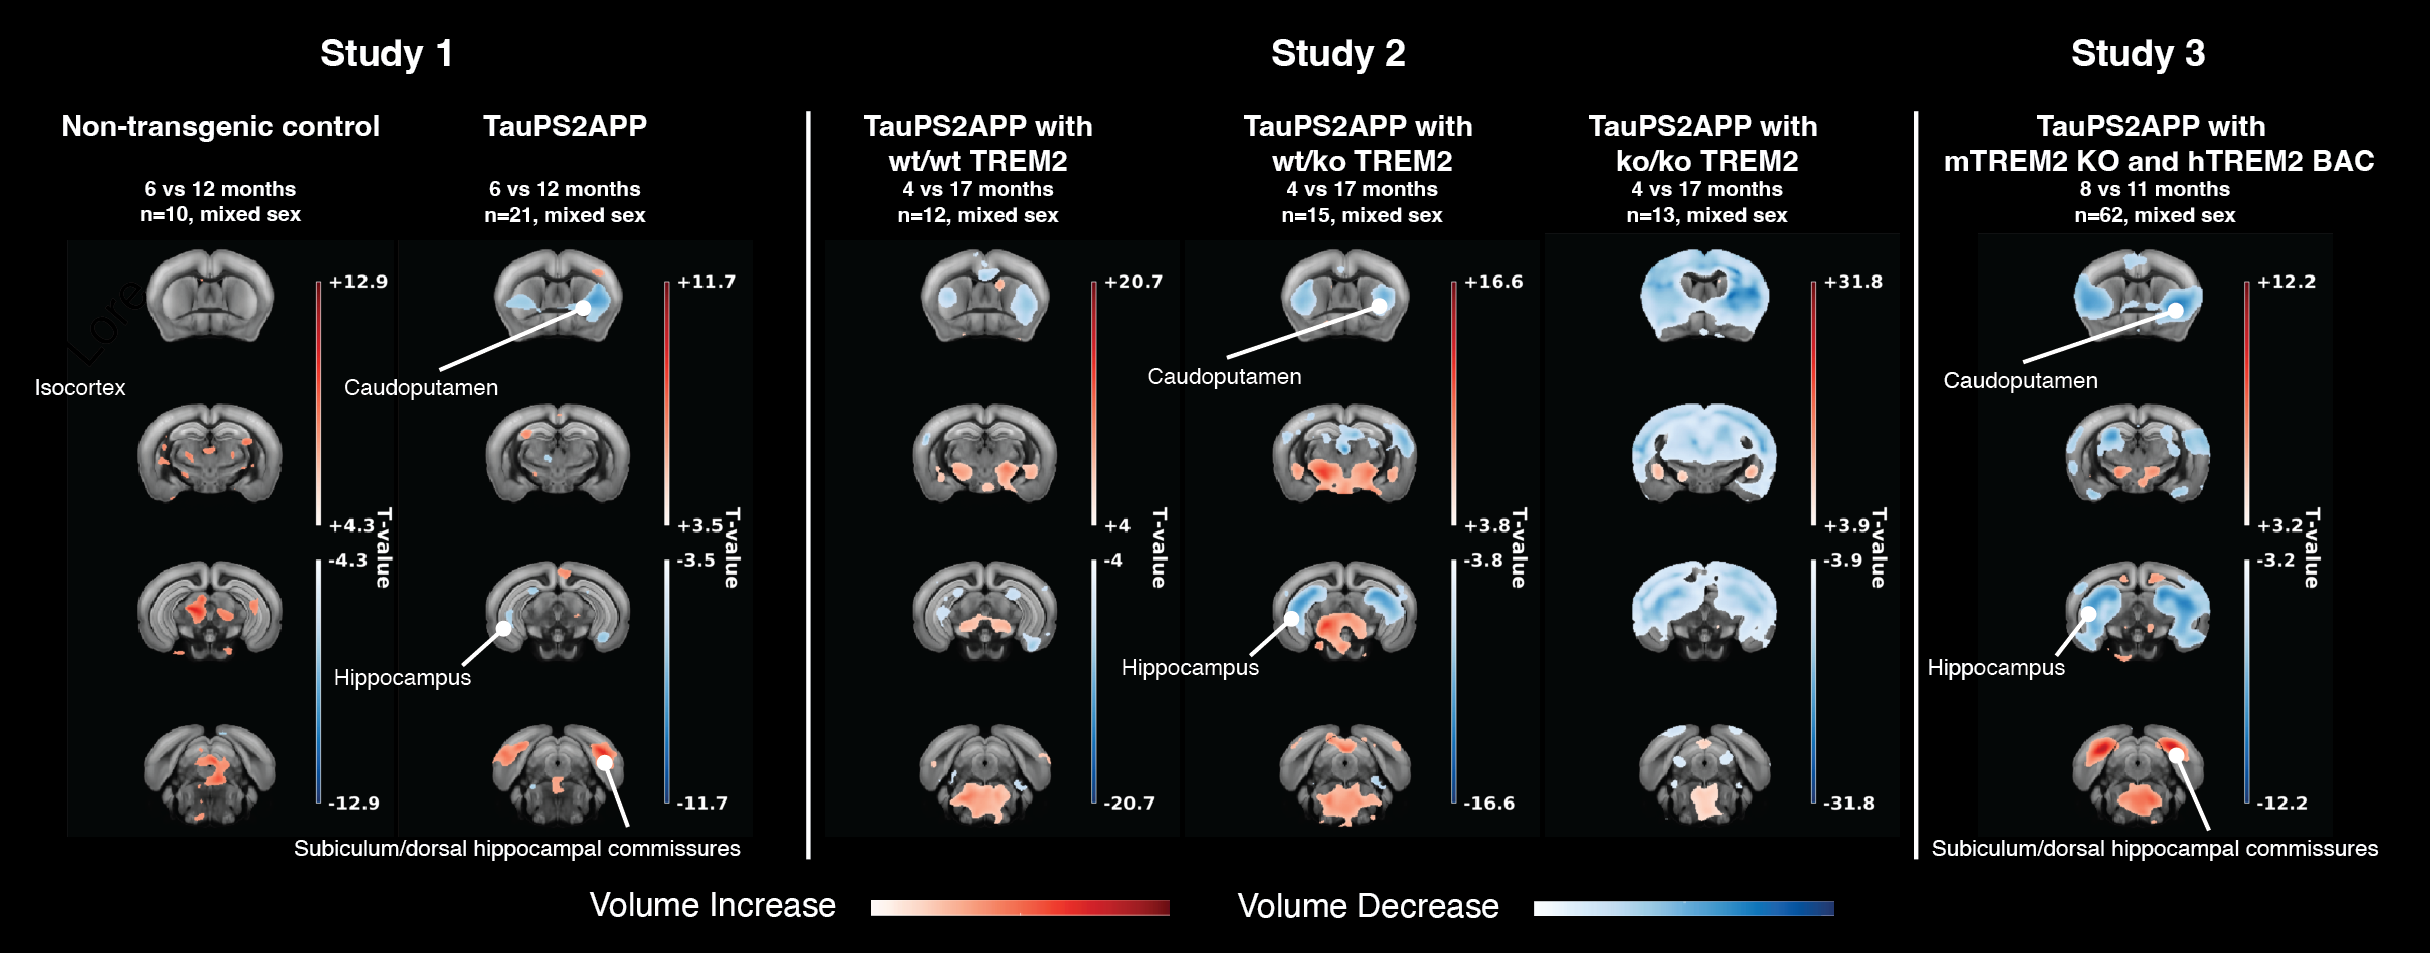
When we compared the TauPS2APP mice with age-matched WT mice at 12 months, we observed expected increased volumes in the isocortex and decreased volumes in the hippocampus (Fig.1A). Interestingly, these differences were already noticeable at 6 months (not shown). Longitudinal analysis in TauPS2APP mice revealed that, while changes in the hippocampal and isocortical volumes were observable, the volume decreases in the caudoputamen and increases in the subiculum/hippocampal commissures were more pronounced (Fig.1B & Fig.2). We assessed the consistency of these longitudinal changes across the three studies, visualizing the distribution of regional volume changes by study, group and sex (Fig.3). Notably, this enables the regional volume changes to be assessed in each of the different TauPS2APP genotypes and therefore provides an indication of the robustness and reproducibility of these changes. Across the three studies, we found volume changes in the caudoputamen to be the most consistent (95% of 123 TauPS2APP mice), followed closely by the hippocampus and the subiculum/hippocampal commissures region (both 89%). Changes in the isocortex were the least consistent at 28%.Discussion and Conclusion
We used brain-wide voxel-based analyses of longitudinal MRI data to characterize the degenerating brain of the TauPS2APP mouse and we found robust volume changes in caudoputamen and subiculum/hippocampal commissures. The observed caudoputamen atrophy could be a direct consequence of regional amyloidosis and tauopathy, resulting in neurodegeneration, or an indirect result of widespread brain degeneration given its role as the primary input node of the basal ganglia circuitry4. Interestingly, analogous regional changes have been documented in patients with AD5. The enlargement of the subiculum/hippocampal commissures region may reflect the localized accumulation of amyloid deposits and phosphorylated tau that has been previously reported in the subiculum of the TauPS2APP mouse1. Taken together, these regional volume changes are potential biomarkers of the neuropathological changes induced by amyloidosis and tauopathy in the TauPS2APP mouse.Acknowledgements
No acknowledgement found.References
1. Grueninger F, Bohrmann B, Czech C, Ballard TM, Frey JR, Weidensteiner C, von Kienlin M, Ozmen L. Phosphorylation of Tau at S422 is enhanced by Abeta in TauPS2APP triple transgenic mice. Neurobiol Dis. 2010 Feb;37(2):294-306.
2. Lee SH, Meilandt WJ, Xie L, Gandham VD, Ngu H, Barck KH, Rezzonico MG, Imperio J, Lalehzadeh G, Huntley MA, Stark KL, Foreman O, Carano RAD, Friedman BA, Sheng M, Easton A, Bohlen CJ, Hansen DV. Trem2 restrains the enhancement of tau accumulation and neurodegeneration by β-amyloid pathology. Neuron. 2021 Apr 21;109(8):1283-1301.e6.
3. Koch S, Mueller S, Foddis M, Bienert T, von Elverfeldt D, Knab F, Farr TD, Bernard R, Dopatka M, Rex A, Dirnagl U, Harms C, Boehm-Sturm P. Atlas registration for edema-corrected MRI lesion volume in mouse stroke models. J Cereb Blood Flow Metab. 2019 Feb;39(2):313-323.
4. Crittenden JR, Graybiel AM. Basal Ganglia disorders associated with imbalances in the striatal striosome and matrix compartments. Front Neuroanat. 2011 Sep 7;5:59.
5. Ryan NS, Keihaninejad S, Shakespeare TJ, Lehmann M, Crutch SJ, Malone IB, Thornton JS, Mancini L, Hyare H, Yousry T, Ridgway GR, Zhang H, Modat M, Alexander DC, Rossor MN, Ourselin S, Fox NC. Magnetic resonance imaging evidence for presymptomatic change in thalamus and caudate in familial Alzheimer's disease. Brain. 2013 May;136(Pt 5):1399-414.
Figures