4031
In Vivo Assessment of Cerebral β-Hydroxybutyrate Metabolism in APPNL-F/NL-F Mouse Model of Alzheimer's Disease using 2H MR Spectroscopy1Department of Radiology, University of Pennsylvania, Philadelphia, PA, United States
Synopsis
Keywords: Alzheimer's Disease, Deuterium, 2H-MRS, Brain, Alzheimer's disease, Metabolism
Motivation: Among all, glucose hypometabolism is a characteristic pathology in Alzheimer’s disease (AD), under such conditions β-Hydroxy butyrate (BHB) can serve as an alternate source of energy. Measurement of BHB metabolism using a sensitive method could serve as a method for early diagnosis of AD.
Goal(s): To monitor BHB metabolism in APPNL-F/NL-F mice.
Approach: Monitoring cerebral 2H2-Glx labeling in mice following subcutaneous administration of 2H4-BHB using pulse-acquired 2H-MRS.
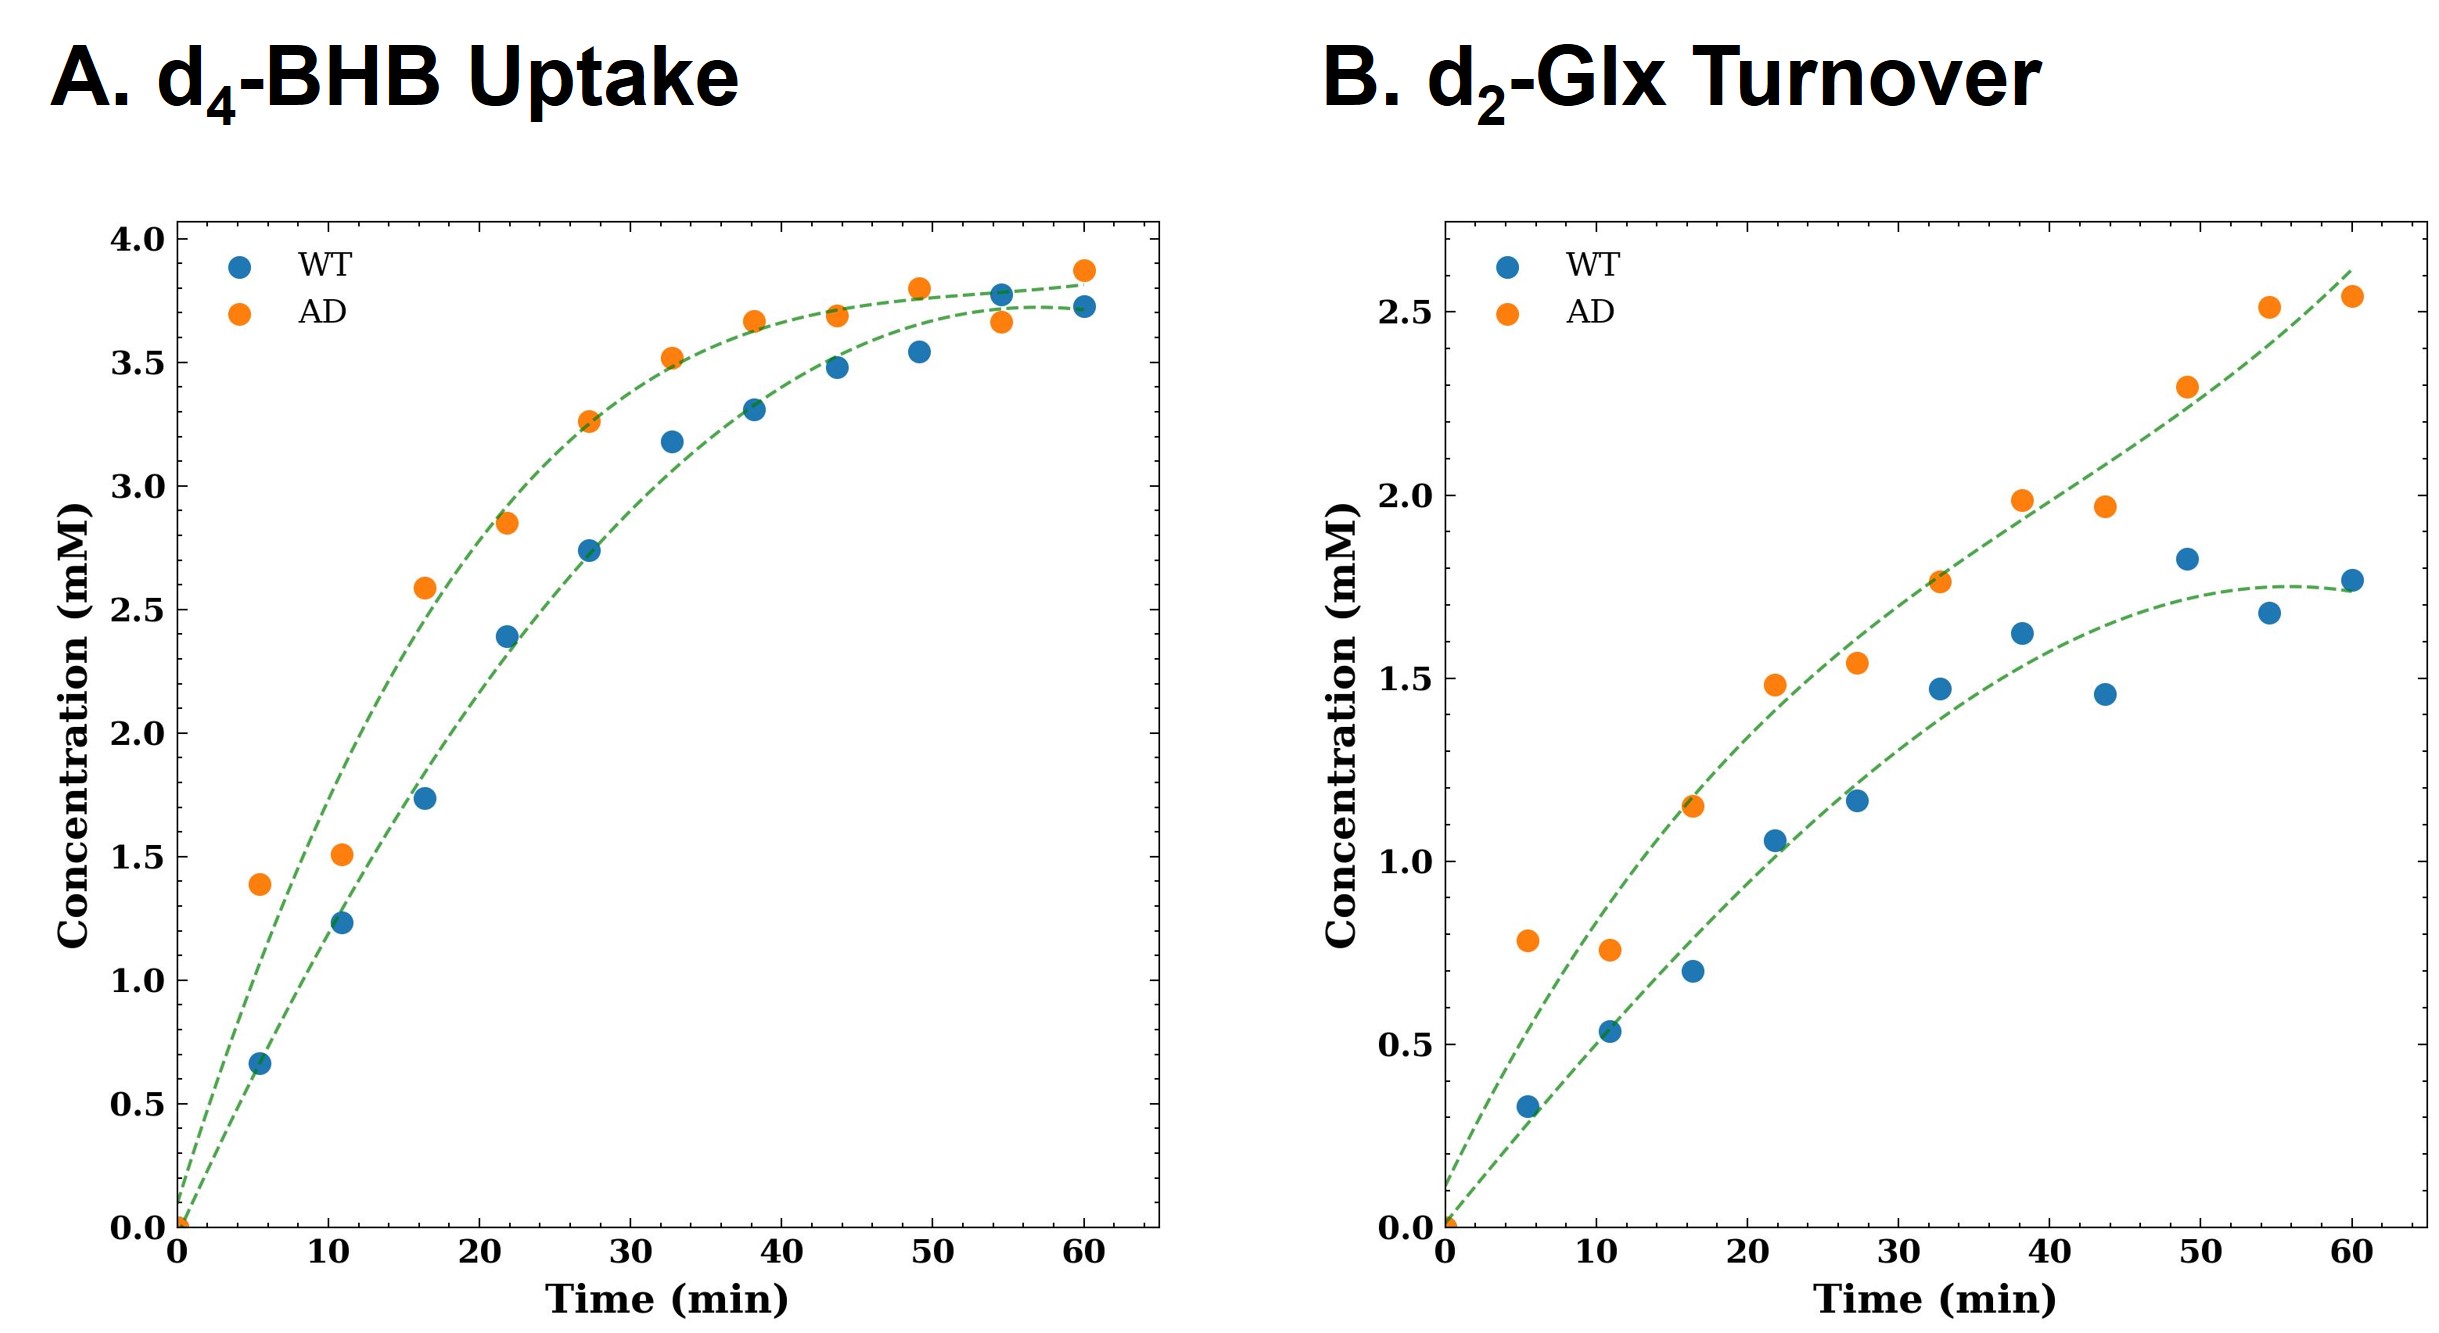
Results: Although rate of cerebral 2H4-BHB uptake was similar in wild type (WT) and AD mice, moderately enhanced labeling of 2H2-Glx was observed in AD mice compared to WT indicates relatively efficient BHB metabolism in AD.
Impact: Although BHB metabolism has been monitored in human and rodent brains using PET and 13C-MRS, inherent limitations restrict their clinical translation. Using a safe and sensitive method like 2H-MRS could be helpful in studying BHB metabolism in various neurodegenerative diseases.
Introduction
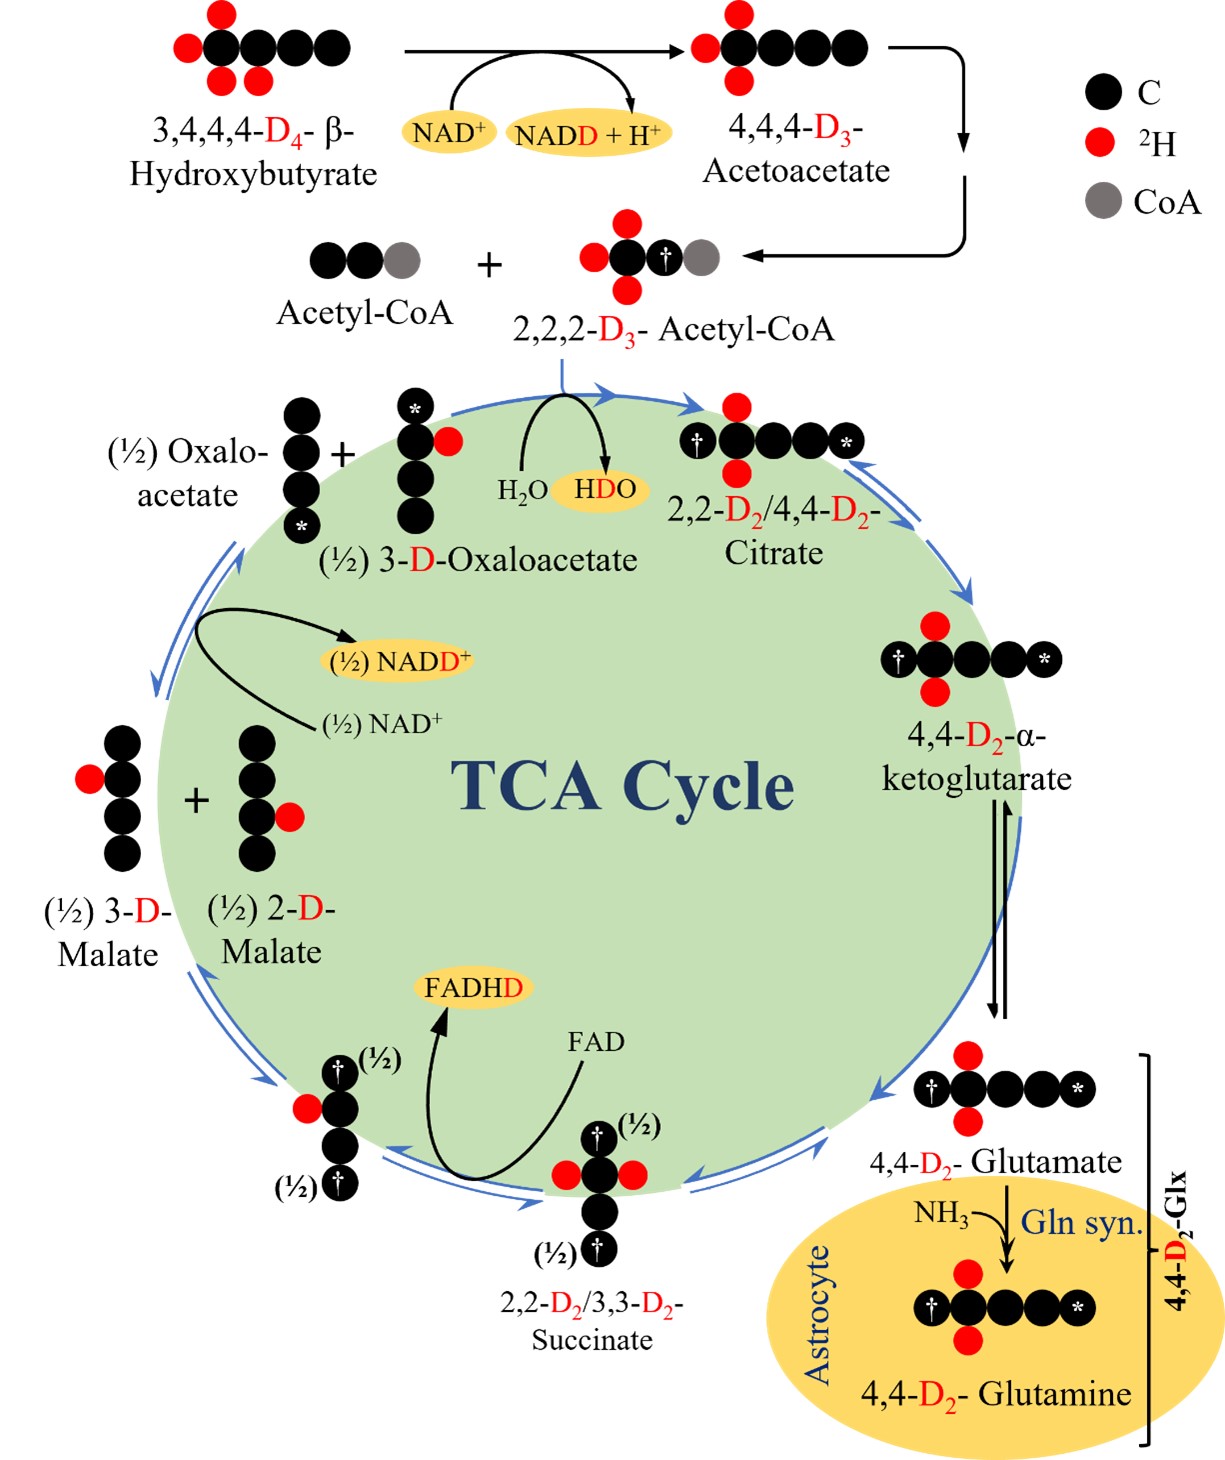
Glucose hypometabolism is a consistently reported characteristic of Alzheimer’s disease (AD)1. Disruption of glucose metabolism directly affects neurotransmitter metabolism, glutamate-glutamine cycling, and neuroenergetics leading to impaired cognitive functions and risk of oxidative damage. β-Hydroxybutyrate (BHB) serves as an alternate source of energy for the brain and could be utilized variably under conditions of poor availability or hypometabolism of glucose. Since, oxidative BHB metabolism through the TCA cycle also bypasses glycolysis (Fig. 1), monitoring its metabolism could be used for a more direct estimation of the TCA cycle. Limited studies have been performed to monitor the real-time metabolism of BHB in human and rodent brains using quantitative autoradiography2, 13C, and 1H-[13C]-MRS3-5. However, inherent limitations, like the use of radioactive tracer or low sensitivity of 13C and technical complexity have limited their clinical translation. Recently, we demonstrated the utility of 2H4-BHB in the monitoring of 2H2-Glx labeling using 2H-MRS6. Some prominent advantages of using 2H-MRS include rapid signal averaging due to short T1 of 2H improving signal-to-noise ratio (SNR) and its low natural abundance (0.01156%) resulting in nearly undetectable metabolite background signals, while 10.12 mM naturally abundant semi-heavy water (HDO) serves as an internal reference for quantification7,8. In the current study, our goal was to monitor cerebral metabolism of [3,4,4,4]-2H4-BHB (d4-BHB) in AD for the first time using 2H-MRS by observing label accumulation in Glx.Methods
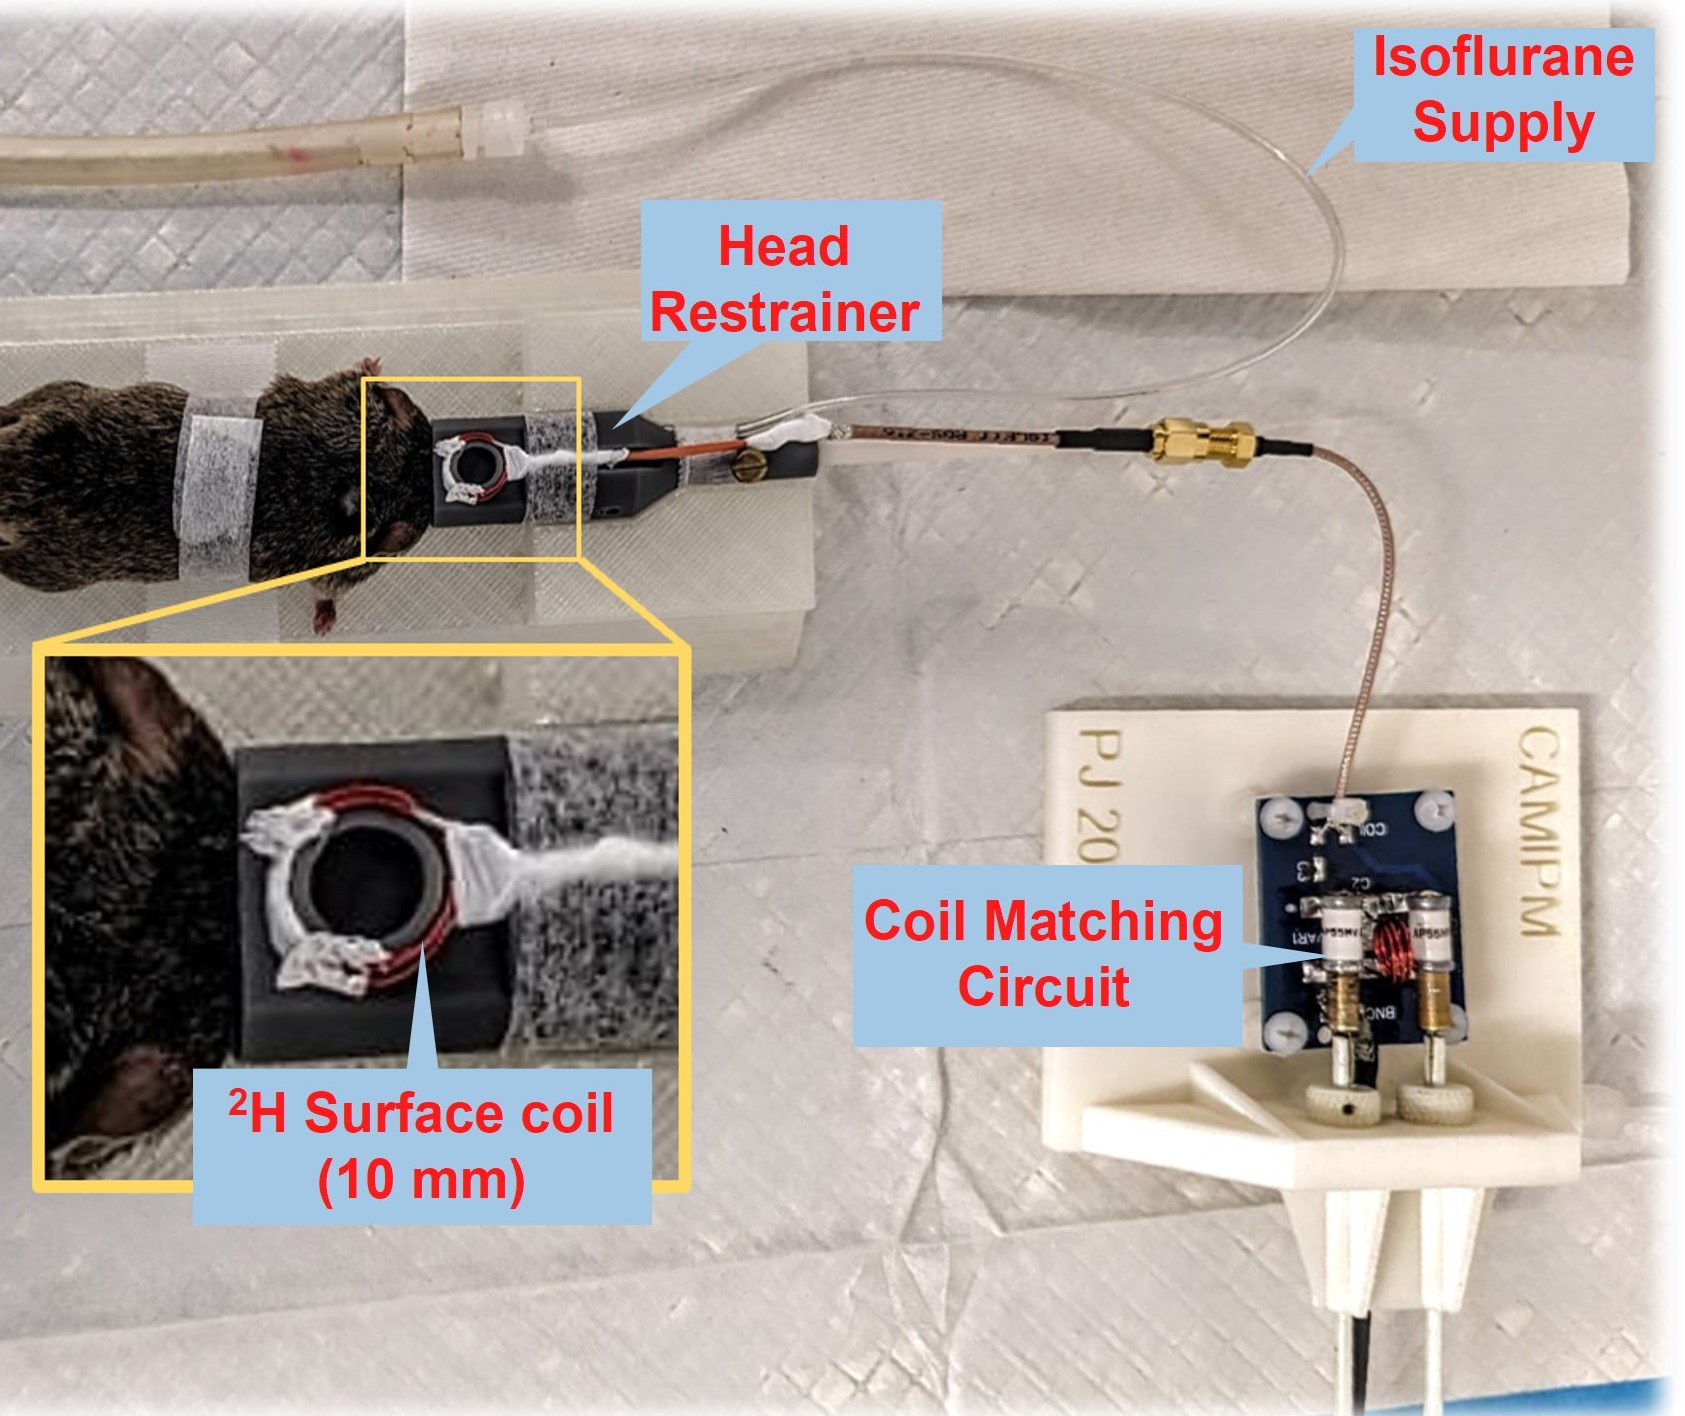
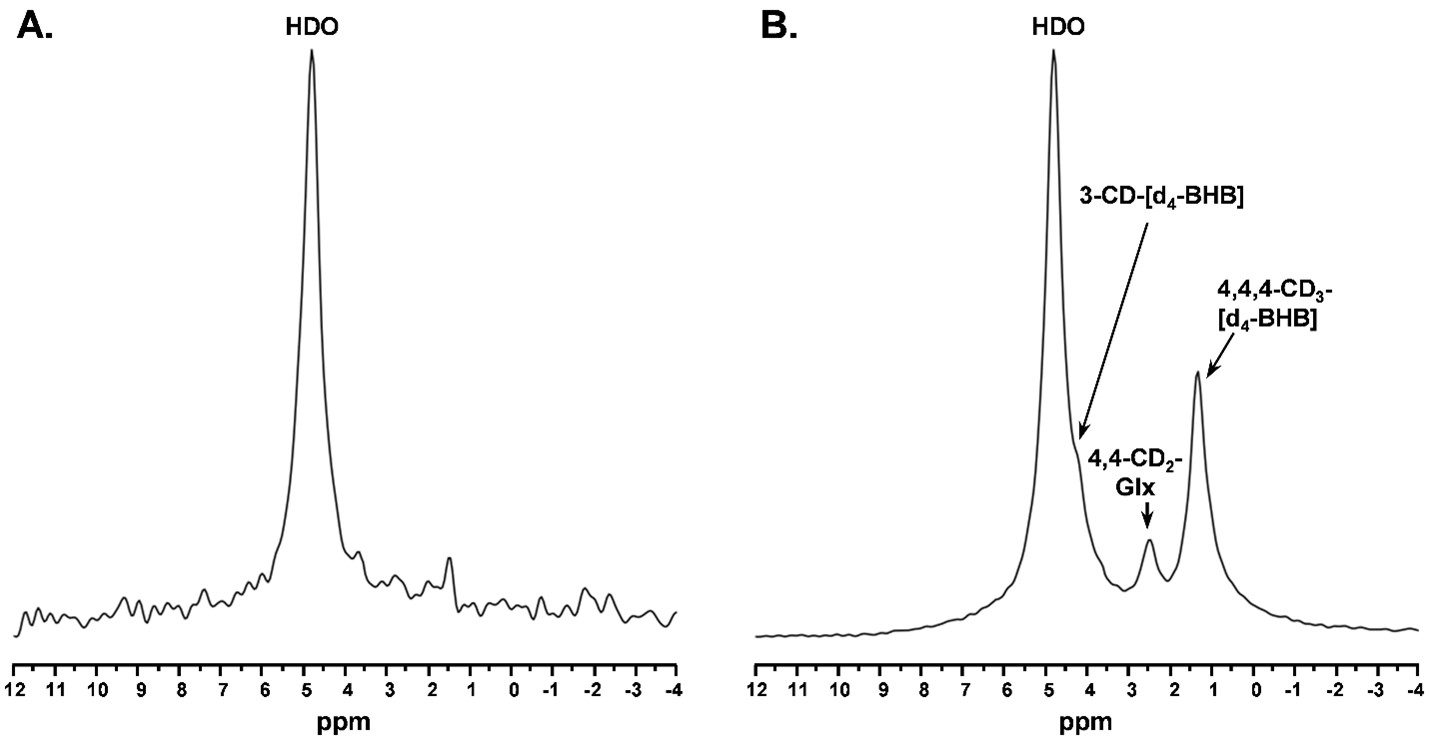
The protocol used for animal experiments was approved by the Institutional Animal Care and Use Committee of the University of Pennsylvania. Ten-month-old C57BL6/J mice (WT; n=2; 1 male and 1 female) and APPNL-F/NL-F mice9 (AD; n=2; 1 male and 1 female) fasted overnight were used for this study. Mice were anesthetized using isoflurane (1.6%) and a subcutaneous10 catheter was placed for infusion of the substrate. A home-built four-turn 2H surface coil tuned to 61.33 MHz was mounted over the head of the mice (Fig.2) and placed in a 20mm 1H transceiver volume coil. The whole assembly was placed in a 9.4T preclinical scanner (diameter 30 cm) interfaced with an Avance III HD console (Bruker, Germany) for 2H-MR spectroscopy. The baseline 2H MRS spectrum was acquired with a pulse-acquire sequence (bandwidth 1500 Hz, FA 50°, 256 points, 2000 averages, and TR 150 ms; acquisition time: 5 minutes) (Figure 1A). Following the bolus administering a dose of 25µL/g of d4-BHB (1 mol/L in saline; pH 7.0; Cayman Chemical Company, USA) a total of 12 spectra were acquired for 60 minutes. A line broadening of a 5 Hz exponential filter (Mestrelab, Spain) was used, and spectra were denoised using singular value decomposition11. The fitted peak integrals of BHB and Glx were normalized to the baseline HDO (10.12 mM12) signal for the calculation of metabolite concentrations and plotted as a function of time.Results
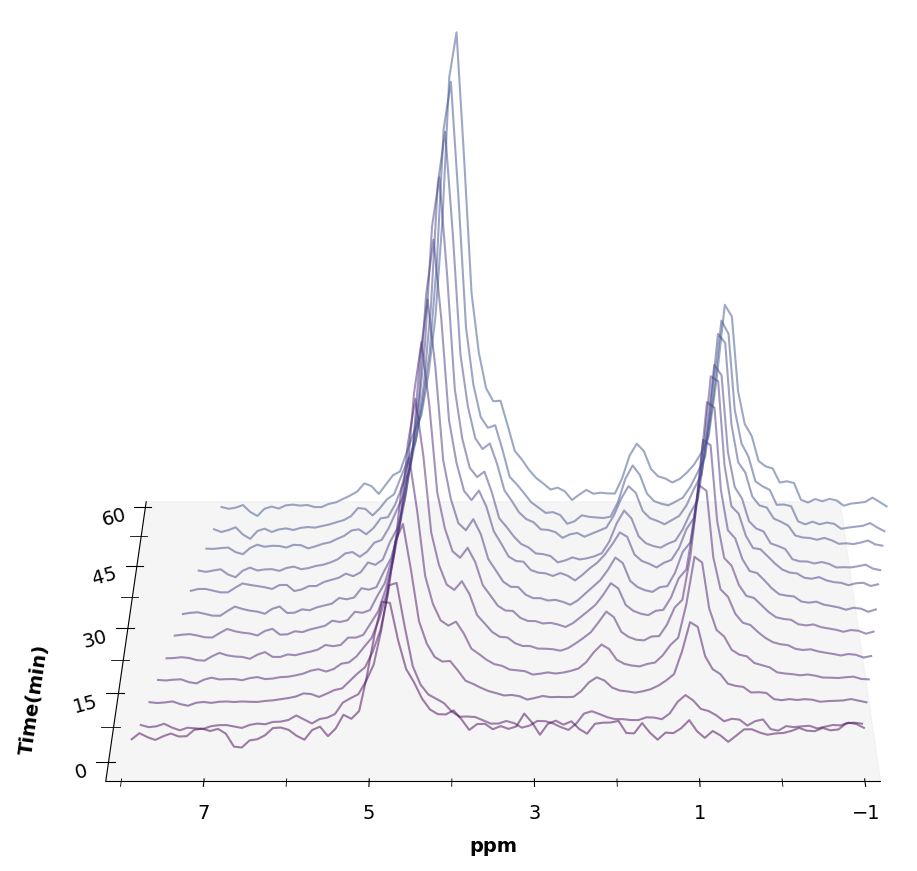
Representative spectra acquired pre- (Fig. 3A) and post-infusion (Fig. 3B) show clear resonances of HDO (4.8 ppm), d2-Glx, (2.3 ppm), and d4-BHB (1.3 and 4.1 ppm). A time-course denoised spectra presented in Figure 4 show the evolution of these signals with time post-d4-BHB administration. The average concentrations of d4-BHB (Fig. 5A) and d2-Glx (Fig. 5B) for each time point are plotted over the course of the infusion and a smooth curve was interpolated. As a result of d4-BHB metabolism, an increase in the level of d2-Glx and HDO was observed. The units are converted to µmol/g/min assuming the brain tissue density of 1.1 g/ml. The rate of d4-BHB uptake in both WT and AD mice followed a steep rise and stabilized at ~3.5 mM, ~40 minutes post-infusion, however, the rate of d2-Glx labeling was much different across WT and AD mice. In the case of WT mice, d2-Glx labeling steeply rose till 40 minutes to 1.5 mM and stabilized. However, in the case of AD mice, the d2-Glx labeling followed a relatively steeper rise till 55 minutes to 2.5 mM before stabilizing. The level of HDO continued to increase linearly throughout the infusion.Discussions
As an interesting outcome of this study, we observed a much higher labeling of d2-Glx in AD mice, even though the rate of d4-BHB uptake was similar across WT and AD mice. This could be arising due to enhanced BHB metabolism under glucose hypometabolic conditions. This is a preliminary study and results are encouraging to perform a detailed kinetic analysis following intravenous administration of d4-BHB and blood plasma collection at regular intervals to include the substrate input function required for kinetic modeling. In conclusion, 2H-MRS being a sensitive and non-invasive method can be widely applicable in AD diagnosis.Acknowledgements
This project was supported by the National Institute of Biomedical Imaging and Bioengineering of the National Institutes of Health through Grant Number P41EB02946 and the National Institute of Aging through Award Number R01AG063869. 3D printed object printed courtesy of the University of Pennsylvania Libraries’ Biotech Commons.References
- Tiwari V and Patel AB. Impaired glutamatergic and GABAergic function at early age in AβPPswe-PS1dE9 mice: implications for Alzheimer's disease. J Alzheimers Dis 2012; 28: 765-769. DOI: 10.3233/JAD-2011-111502.
- Blomqvist G, Thorell JO, Ingvar M, et al. Use of R-beta-[1-11C]hydroxybutyrate in PET studies of regional cerebral uptake of ketone bodies in humans. Am J Physiol 1995; 269: E948-959. DOI: 10.1152/ajpendo.1995.269.5.E948.
- Pan JW, de Graaf RA, Petersen KF, et al. [2,4-13 C2 ]-beta-Hydroxybutyrate metabolism in human brain. J Cereb Blood Flow Metab 2002; 22: 890-898. DOI: 10.1097/00004647-200207000-00014.
- Roy M, Beauvieux MC, Naulin J, et al. Rapid adaptation of rat brain and liver metabolism to a ketogenic diet: an integrated study using (1)H- and (13)C-NMR spectroscopy. J Cereb Blood Flow Metab 2015; 35: 1154-1162. 20150318. DOI: 10.1038/jcbfm.2015.29.
- Jiang L, Mason GF, Rothman DL, et al. Cortical substrate oxidation during hyperketonemia in the fasted anesthetized rat in vivo. J Cereb Blood Flow Metab 2011; 31: 2313-2323. 20110706. DOI: 10.1038/jcbfm.2011.91.
- Soni ND, Swain A, Jacobs P, et al. In vivo assessment of beta-hydroxybutyrate metabolism in mouse brain using deuterium ((2) H) MRS. Magn Reson Med 2023; 90: 259-269. 20230327. DOI: 10.1002/mrm.29648.
- Simoes RV, Henriques RN, Cardoso BM, et al. Glucose fluxes in glycolytic and oxidative pathways detected in vivo by deuterium magnetic resonance spectroscopy reflect proliferation in mouse glioblastoma. Neuroimage Clin 2022; 33: 102932. 20220105. DOI: 10.1016/j.nicl.2021.102932.
- Lu M, Zhu XH, Zhang Y, et al. Quantitative assessment of brain glucose metabolic rates using in vivo deuterium magnetic resonance spectroscopy. J Cereb Blood Flow Metab 2017; 37: 3518-3530. 20170515
- Saito T, Matsuba Y, Mihira N, et al. Single App knock-in mouse models of Alzheimer's disease. Nat Neurosci 2014; 17: 661-663. 20140413. DOI: 10.1038/nn.3697.
- Song KH, Ge X, Engelbach JA, et al. Subcutaneous deuterated substrate administration in mice: An alternative to tail vein infusion. Magn Reson Med 2023 20231017
- Brender JR, Kishimoto S, Merkle H, et al. Dynamic Imaging of Glucose and Lactate Metabolism by (13)C-MRS without Hyperpolarization. Sci Rep 2019; 9: 3410. 20190304. DOI: 10.1038/s41598-019-38981-1.
- De Feyter HM, Behar KL, Corbin ZA, et al. Deuterium metabolic imaging (DMI) for MRI-based 3D mapping of metabolism in vivo. Sci Adv 2018; 4: eaat7314. 20180822. DOI: 10.1126/sciadv.aat7314.
Figures