4030
Probing alterations of brain microstructure in 3xTg-AD mouse via water and metabolites diffusion time-dependence1College of Biomedical Engineering & Instrument Science, Zhejiang University, Hangzhou, China, 2MR Research&Development Digital, Siemens Shenzhen Magnetic Resonance Ltd, Shenzhen, China, 3Department of Endocrinology, School of Medicine, Sir Run Run Shaw Hospital, Zhejiang University, Hangzhou, China, 4Hangzhou Institute of Medicine, Chinese Academy of Sciences, Hangzhou, China, 5MR Collaboration, Siemens Healthcare Ltd, Shanghai, China
Synopsis
Keywords: Alzheimer's Disease, Diffusion/other diffusion imaging techniques, DW-MRS
Motivation: Diffusion-weighted MR Spectroscopy(DW-MRS) gives access to diffusion properties of endogenous intracellular metabolites to characterize brain cell microstructureµenvironment, which could potentially reflect changes in neuropathology during early Alzheimer's disease(AD).
Goal(s): To measure the time-dependent diffusion and kurtosis of the intracellular metabolites and water in the 3xTg-AD mouse.
Approach: In-vivo DW-MRS was applied to measure the hippocampus location at different diffusion-times(Td) in four 3xTg mice and four wild-type-C57BL/6 mice(200-day-old/females).
Results: The intracellular metabolites change distinctly compared to water in Td-dependency and restricted diffusion between AD and control group. The Kurtosis of metabolites increased significantly in early-AD while water diffusion showed no difference between 2 groups.
Impact: This work provides a unique insight into the diffusion time-dependency and kurtosis measurements of intracellular metabolites and water to probe the microstructural changes during the early presymptomatic stages of AD, which helps revealing some underlying processes during AD pathogenesis.
Introduction
DW-MRS allows for studying molecular diffusivity to reveal the microstructural and microenvironmental properties in vivo. Metabolites are intracellular and cell‐type specific (such as neuron-specific NAA and astrocyte-specific Cho/Ins). By measuring diffusion time(Td) dependency and kurtosis of metabolite diffusion with DW-MRS, we may probe the microstructural and microenvironmental properties in brain tissue with improved precision and specificity1–3. Recently, the diffusion Td-dependency of brain metabolites has been measured in the mouse and human brain, showing promising results as a potential biomarker for brain cell morphology4,5.This work aims to explore the metabolites and water diffusion properties in the 3xTg-AD mouse. While the previous work reported an increased Ins apparent diffusivity6, decreased extracellular lactate fraction7, and decreased levels of NAA8,9. Our goal is to find the Kurtosis or Td-dependent diffusion change at the early-stage of AD which can be used as the early marker for the potential alternations of brain cell microstructure.
Methods
Instrument: Experiments were performed on a 7T Bruker system, equipped with 570mT/m gradients and surface receive coils. In vivo Experiment: Four 200-day-old females 3xTg mice and four wild-type C57BL/6 mice (age and sex-matched) anesthetized with 1.5~2% isoflurane were scanned. The DW-MRS acquisitions were performed using a diffusion-weighted STEAM sequence (TE=25.5ms, diffusion gradient duration(δ)=10ms) in the hippocampus region. The scan parameters included: voxel size=2.5*7*2.5 mm3; bandwidth=4kHz and 2176 complex-datapoints. Spectra at different diffusion weightings (b=30, 3030, 6030, 10030 and 20030s/mm2, 128(metabolites)/8(water) repetitions) were acquired at Td/TM/TR=23.2/8.078/2000ms and Td/TM/TR=253.2/238.078/2200ms.Data Processing: Spectra were processed including coil combination, spectral registration, and phase/frequency correction10. Also, we performed eddy current correction using a non-water-suppressed reference scan11. For metabolites, each spectrum was analyzed with LCModel12. Fitting was performed by using a nonlinear least-square regression, based on the trust-region-reflective algorithm implemented in MATLAB. For each Td, the diffusion-weighted signal S as a function of b was fitted to estimate the apparent diffusivity of water or metabolite and kurtosis, using equation13 and constraints as follows:
$$\ln (\frac{{{S}_{b}}}{{{S}_{0}}})=Db(\frac{DK}{6}b-1)$$
$$\text{constraints}\left\{ \begin{matrix} \frac{3}{DK}>{{b}_{\max }} \\ -\frac{3}{2K}<\ln (\frac{{{S}_{{{b}_{\max }}}}}{{{S}_{0}}}) \\\end{matrix} \right.$$
The constraints are determined by the fact that the symmetry-axis and vertex of the quadratic function for the Kurtosis model cannot exceed the lowest signal(max b-value).
Statistical Analysis: The paired t-test was applied to assess Td-dependence intra-groups, and the unpaired t-test was applied to assess diffusion properties inter-groups.
Results
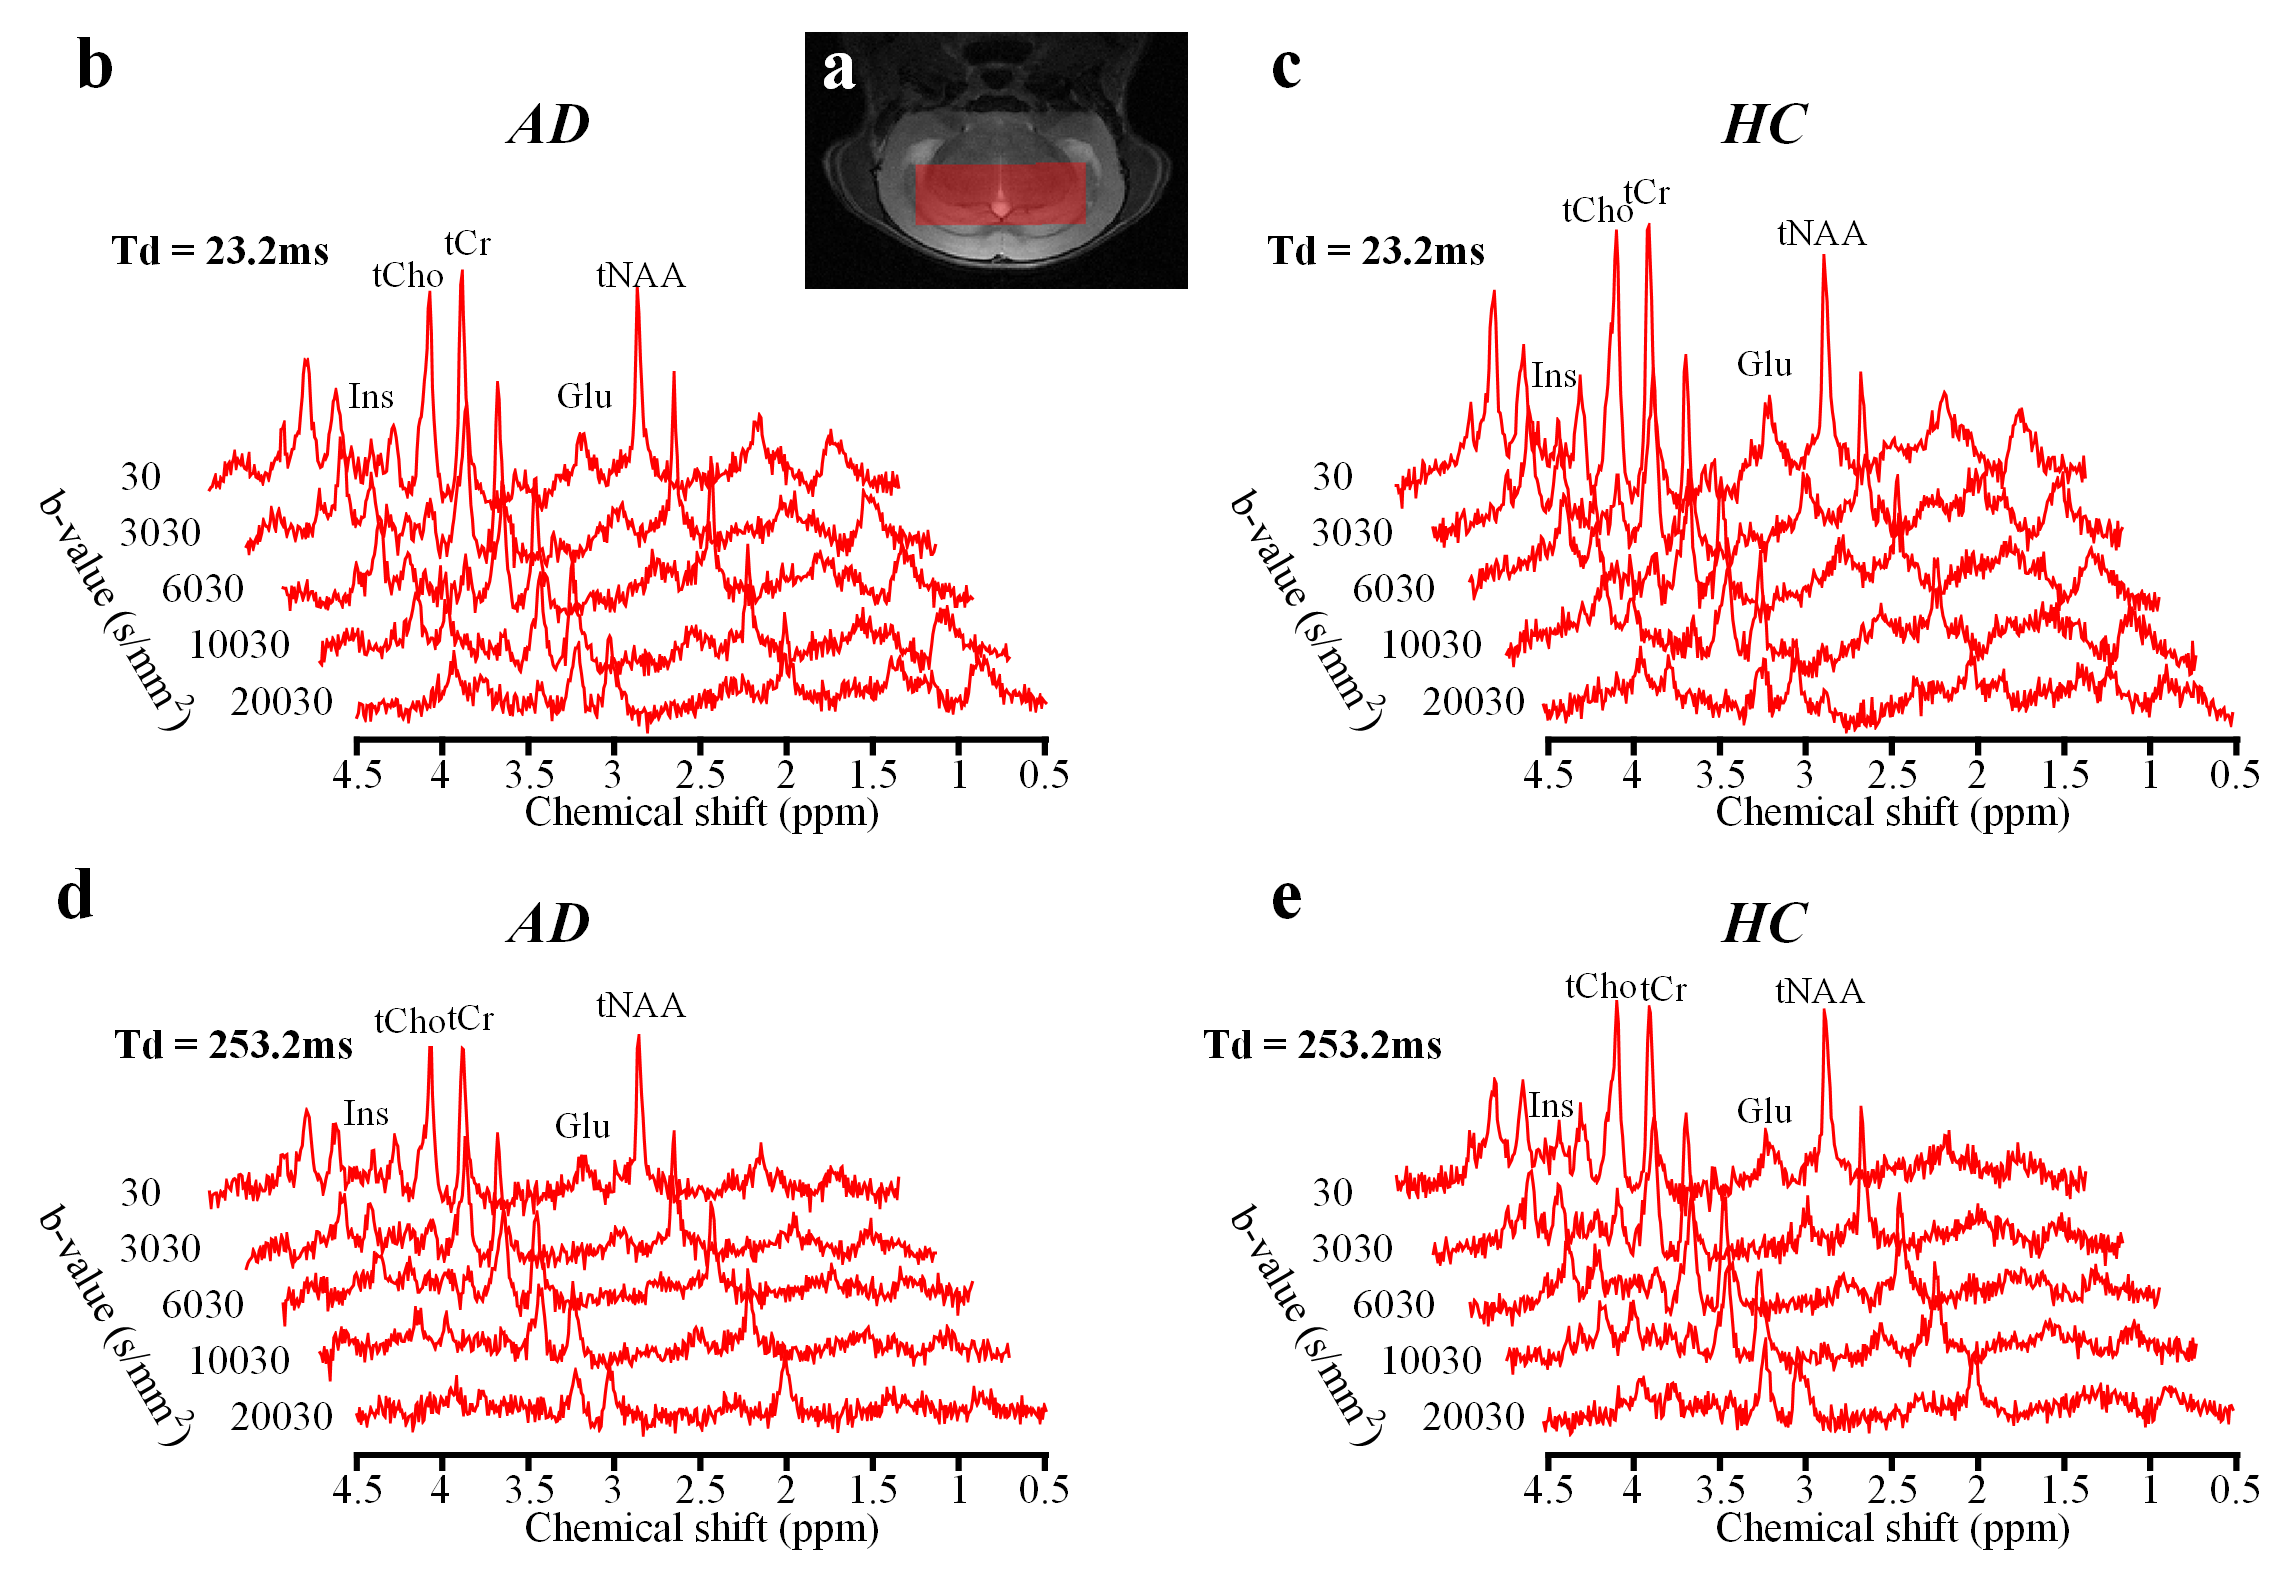
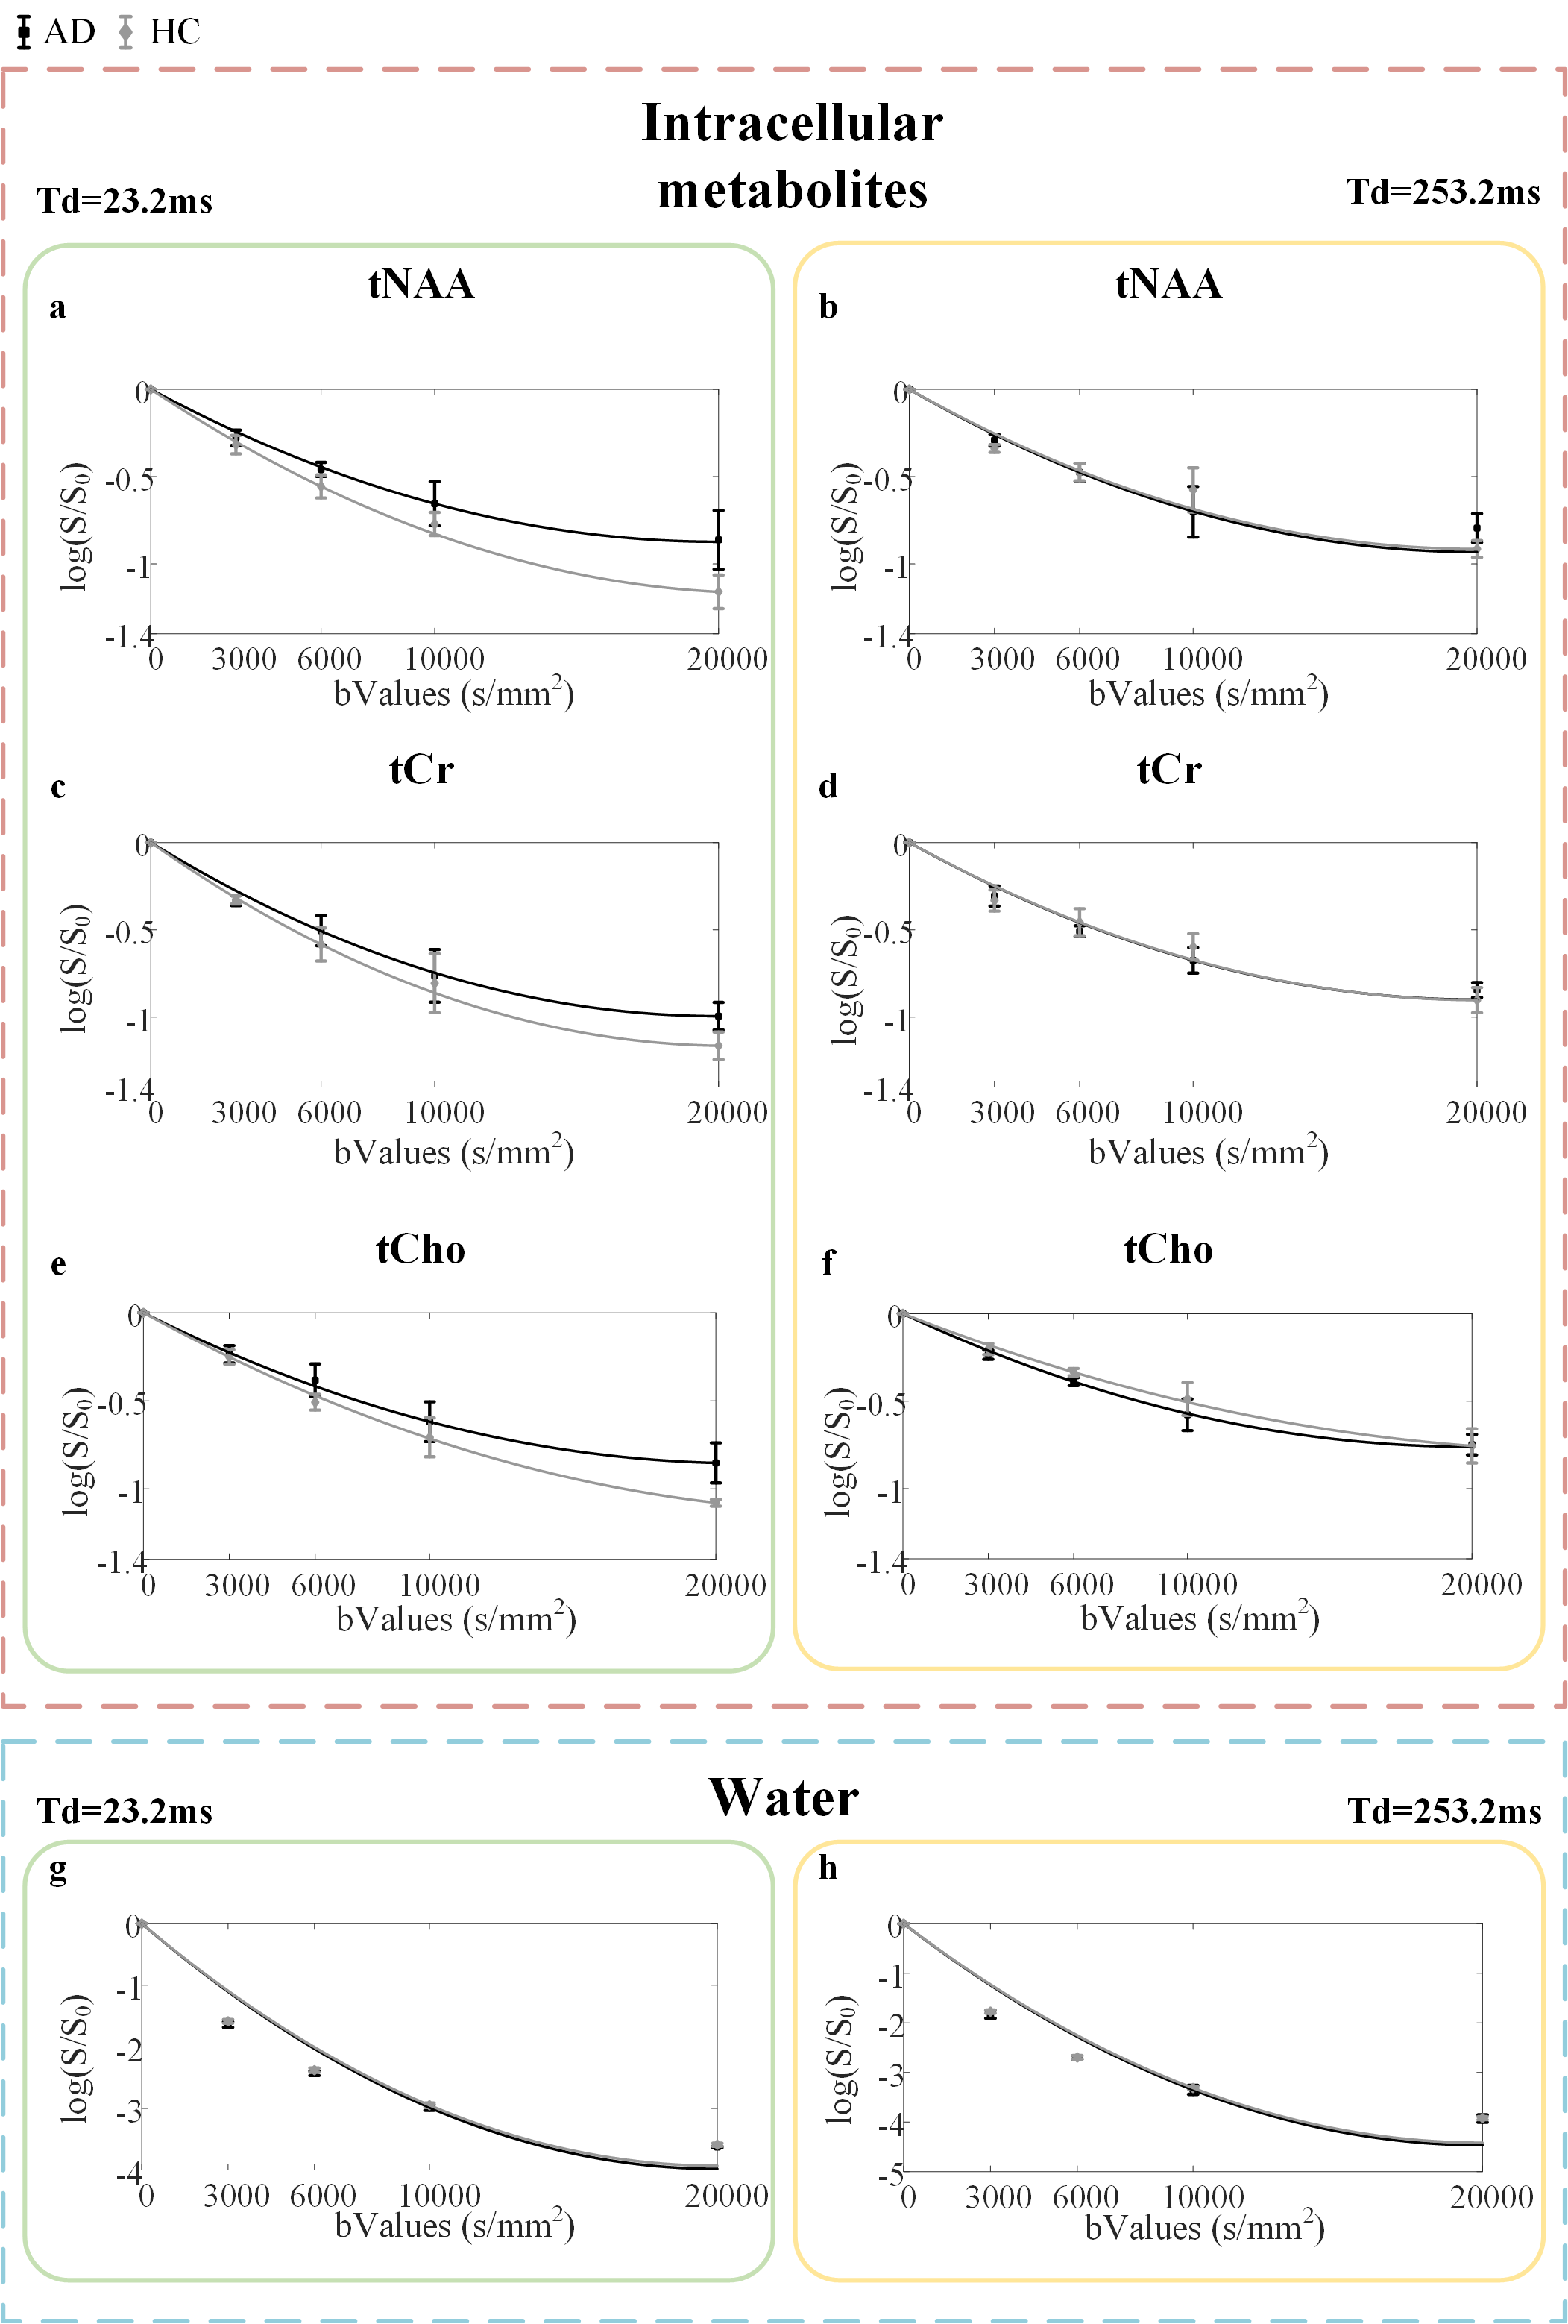
Representative diffusion-weighted spectra are shown for AD(Fig.1b,d) and HC mouse(Fig.1c,e), illustrating the signal attenuation in the hippocampus at different Td.Figure.2 presents the two groups of three main metabolites and water logarithm signal attenuation and fits with kurtosis.
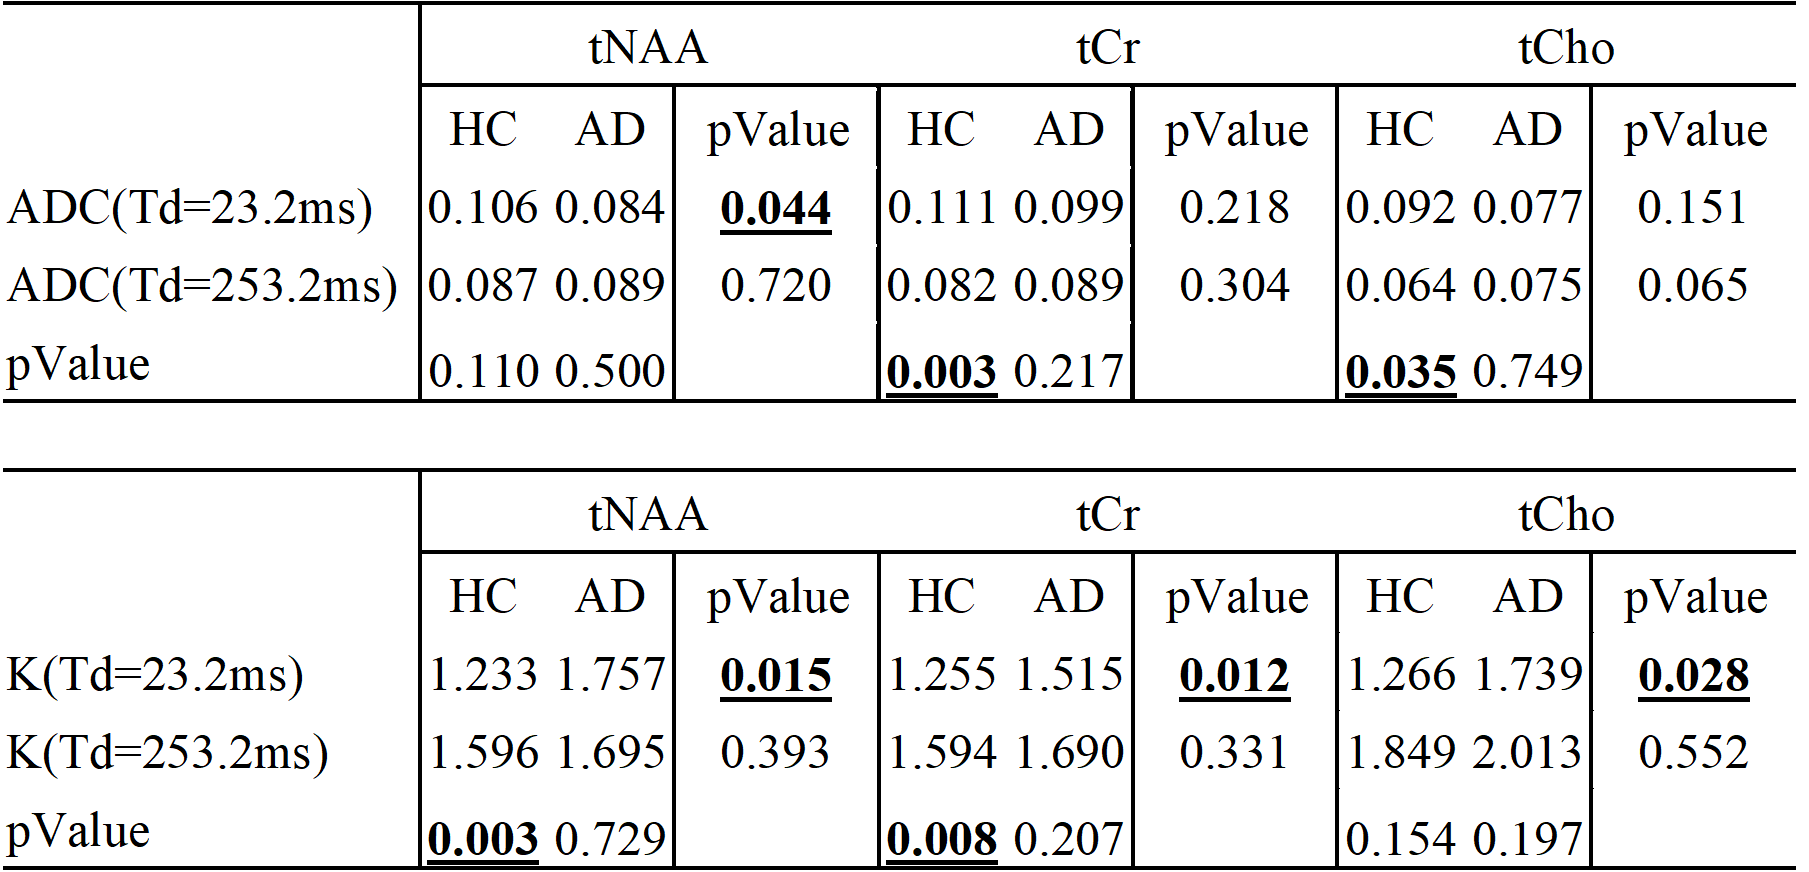
For metabolites, the ADCs were decreased and the Kurtosis increased of all three main metabolites along with the increasing Td in HC mice, but this Td-dependency trend was not seen in AD mice for neither ADCs nor Kurtosis. Also, in AD mice, the tNAA ADC was significantly lower, and the Kurtosis of all three metabolites was significantly higher compared with the HC group at Td=23.2ms(Table.1).
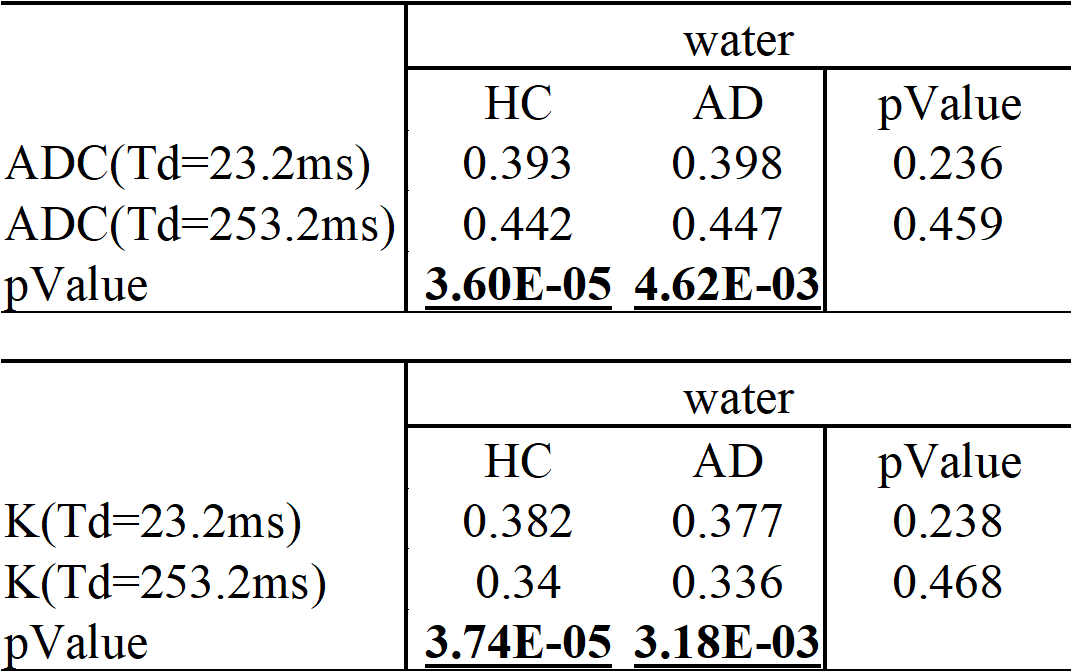
For water, the Td-dependence shows opposite behavior to metabolites. Also, there is no difference found between 2 groups(Table.2).
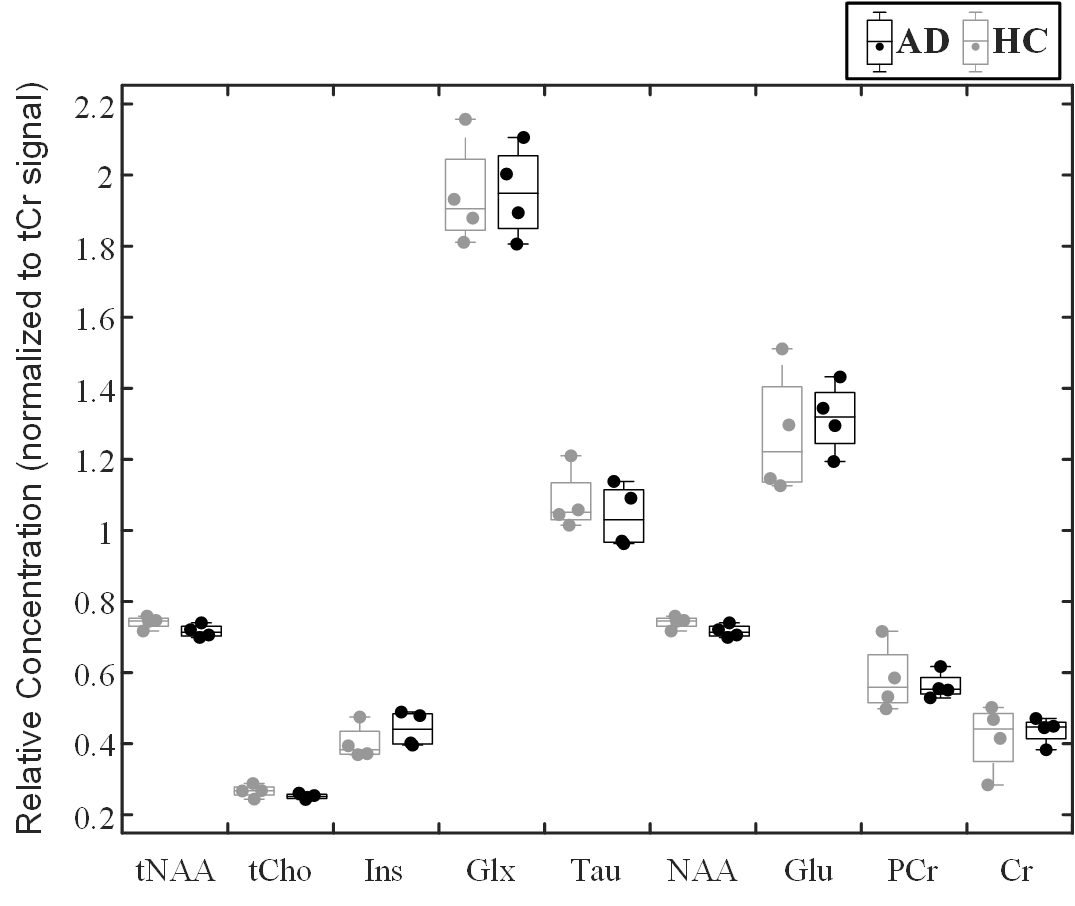
Figure.3 shows metabolite concentrations of the 2 groups, no change was found in metabolite concentrations between AD and HC mice at this stage.
Discussion
In this study, we used the kurtosis time-dependent model to probe brain microstructure by the diffusion changes of the water and metabolites in 3xTg-AD. Measurements of purely intracellular metabolites Td-dependence(up to 253.2ms) show opposite behavior to water, with metabolites kurtosis increasing as a function of Td, which was also reported in one recent animal study4.In Table.1, the AD group shows no significant difference in intracellular metabolites Td-dependence and higher kurtosis compared with the HC group, which is a sign of disrupted intracellular structure in early AD compared to normal aging.
At the same time, there is no significant difference in the water diffusion properties between AD and HC, which shows that the globally distributed water molecular is not capable of detecting early-stage intracellular changes in AD while DW-MRS is more sensitive to the very small alternations of brain microstructure.
Moreover, we demonstrated the concentration of main metabolites in brain, and the changes of metabolite levels in AD reported at a later stage by some previous studies6,8,14 were not found. It seems possible that marked morphological atrophy was clearly shown at the 6-month in 3xTg-AD15.
Conclusion
This study has found the alternations of intracellular metabolites and water diffusion time-dependence in a relatively early-stage of 3xTg mouse model of Alzheimer’s disease. The intracellular metabolites show very different or opposite diffusion behavior compared to water in diffusion time-dependency and spatial restriction in AD mice.Acknowledgements
No acknowledgement found.References
1. Ligneul, C. et al. Diffusion-weighted magnetic resonance spectroscopy enables cell-specific monitoring of astrocyte reactivity in vivo. Neuroimage 191, 457–469 (2019).
2. Marchadour, C., Brouillet, E., Hantraye, P., Lebon, V. & Valette, J. Anomalous Diffusion of Brain Metabolites Evidenced by Diffusion-Weighted Magnetic Resonance Spectroscopy in Vivo. J Cereb Blood Flow Metab 32, 2153–2160 (2012).
3. Palombo, M. et al. New paradigm to assess brain cell morphology by diffusion-weighted MR spectroscopy in vivo. Proc Natl Acad Sci U S A 113, 6671–6676 (2016).
4. Mougel, E., Valette, J. & Palombo, M. Investigating exchange, structural disorder and restriction in Gray Matter via water and metabolites diffusivity and kurtosis time-dependence. Preprint (2023).
5. Döring, A. et al. Time dependent diffusion and kurtosis of human brain metabolites. ISMRM (2023).
6. Ligneul, C. et al. Assessing metabolic and structural alterations of brain cells in the APP/PS1/tauP301L mouse model of Alzheimer’s disease using MRS and diffusion-weighted MRS in vivo. ISMRM (2016).
7. Sophie Malaquin. Investigating changes in brain lactate compartmentation using diffusion-weighted MRS in APP/PS1 mice. ISMRM (2023).
8. Sabbagh, J. J., Kinney, J. W. & Cummings, J. L. Alzheimer’s disease biomarkers in animal models: closing the translational gap. American Journal of Neurodegenerative Disease 2, 108 (2013).
9. Scuderi, C. et al. Ultramicronized palmitoylethanolamide rescues learning and memory impairments in a triple transgenic mouse model of Alzheimer’s disease by exerting anti-inflammatory and neuroprotective effects. Transl Psychiatry 8, 32 (2018).
10. Zhou, K., Wang, Z., Lin, D., Hsu, Y.-C. & Wang, M. Optimization and comparison of coil combination and spectral registration strategies for in-vivo DW-MRS. ISMRM (2023).
11. Klose, U. In vivo proton spectroscopy in presence of eddy currents. Magnetic Resonance in Medicine 14, 26–30 (1990).
12. Provencher, S. W. Automatic quantitation of localized in vivo 1H spectra with LCModel. NMR Biomed 14, 260–264 (2001).
13. Jensen, J. H. & Helpern, J. A. Quantifying Non-Gaussian Water Diffusion by Means of Pulsed-Field-Gradient MRI. ISMRM (2003).
14. Dedeoglu, A., Choi, J.-K., Cormier, K., Kowall, N. W. & Jenkins, B. G. Magnetic resonance spectroscopic analysis of Alzheimer’s disease mouse brain that express mutant human APP shows altered neurochemical profile. Brain Res 1012, 60–65 (2004).
15. Vanzulli, I. et al. Disruption of oligodendrocyte progenitor cells is an early sign of pathology in the triple transgenic mouse model of Alzheimer’s disease. Neurobiology of Aging 94, 130–139 (2020).
Figures