4029
Longitudinal T2 MRI and spectroscopy are sensitive to neuronal damage in an inducible TDP-43 mouse model of ALS1Translational Imaging, Genentech, South San Francisco, CA, United States, 2Neuroscience, Genentech, South San Francisco, CA, United States
Synopsis
Keywords: Other Neurodegeneration, Neurodegeneration, ALS
Motivation: MRI is commonly used to monitor different neuropathologies, but has not been widely used for ALS research.
Goal(s): We sought to investigate the utility of longitudinal MRI and MRS to assess the course of disease progression in an inducible TDP-43 mouse model of ALS
Approach: T2, volume and NAA/tCr (N-acetyl aspartate/total creatine) were measured longitudinally in disease-relevant regions.
Results: These metrics significantly changed in the 6-week induction phase of the model and reversed in the 6-week recovery phase, which was consistent with Amino-Cupric-Silver staining for degenerating neurons. NAA/tCr exhibited the greatest change: −29±14% at peak disease.
Impact: We have demonstrated that T2 mapping, volumetric MRI, and MRS are sensitive to neuronal damage in a mouse model of ALS. These non-invasive endpoints therefore have the potential to be used clinically to monitor ALS progression and therapeutic efficacy.
Introduction
Amyotrophic lateral sclerosis (ALS) is a neurodegenerative disease characterized by the loss of upper and lower motor neurons in the brain and spinal cord, resulting in progressive muscle paralysis and death. Non-invasive imaging, especially MRI, can help monitor the progression of disease pathology in the brain1,2, but has had limited use in ALS research3. In this study, we investigated the utility of longitudinal MRI and MRS to assess disease progression in an inducible TDP-43 mouse model of ALS. Volumetric MRI was employed to assess atrophy of brain regions, T2 mapping for sensitivity to demyelination and inflammation, and MRS to estimate the change in concentration of N-acetyl aspartate (NAA), which is localized in neurons and thus a marker of neuronal integrity4.Methods
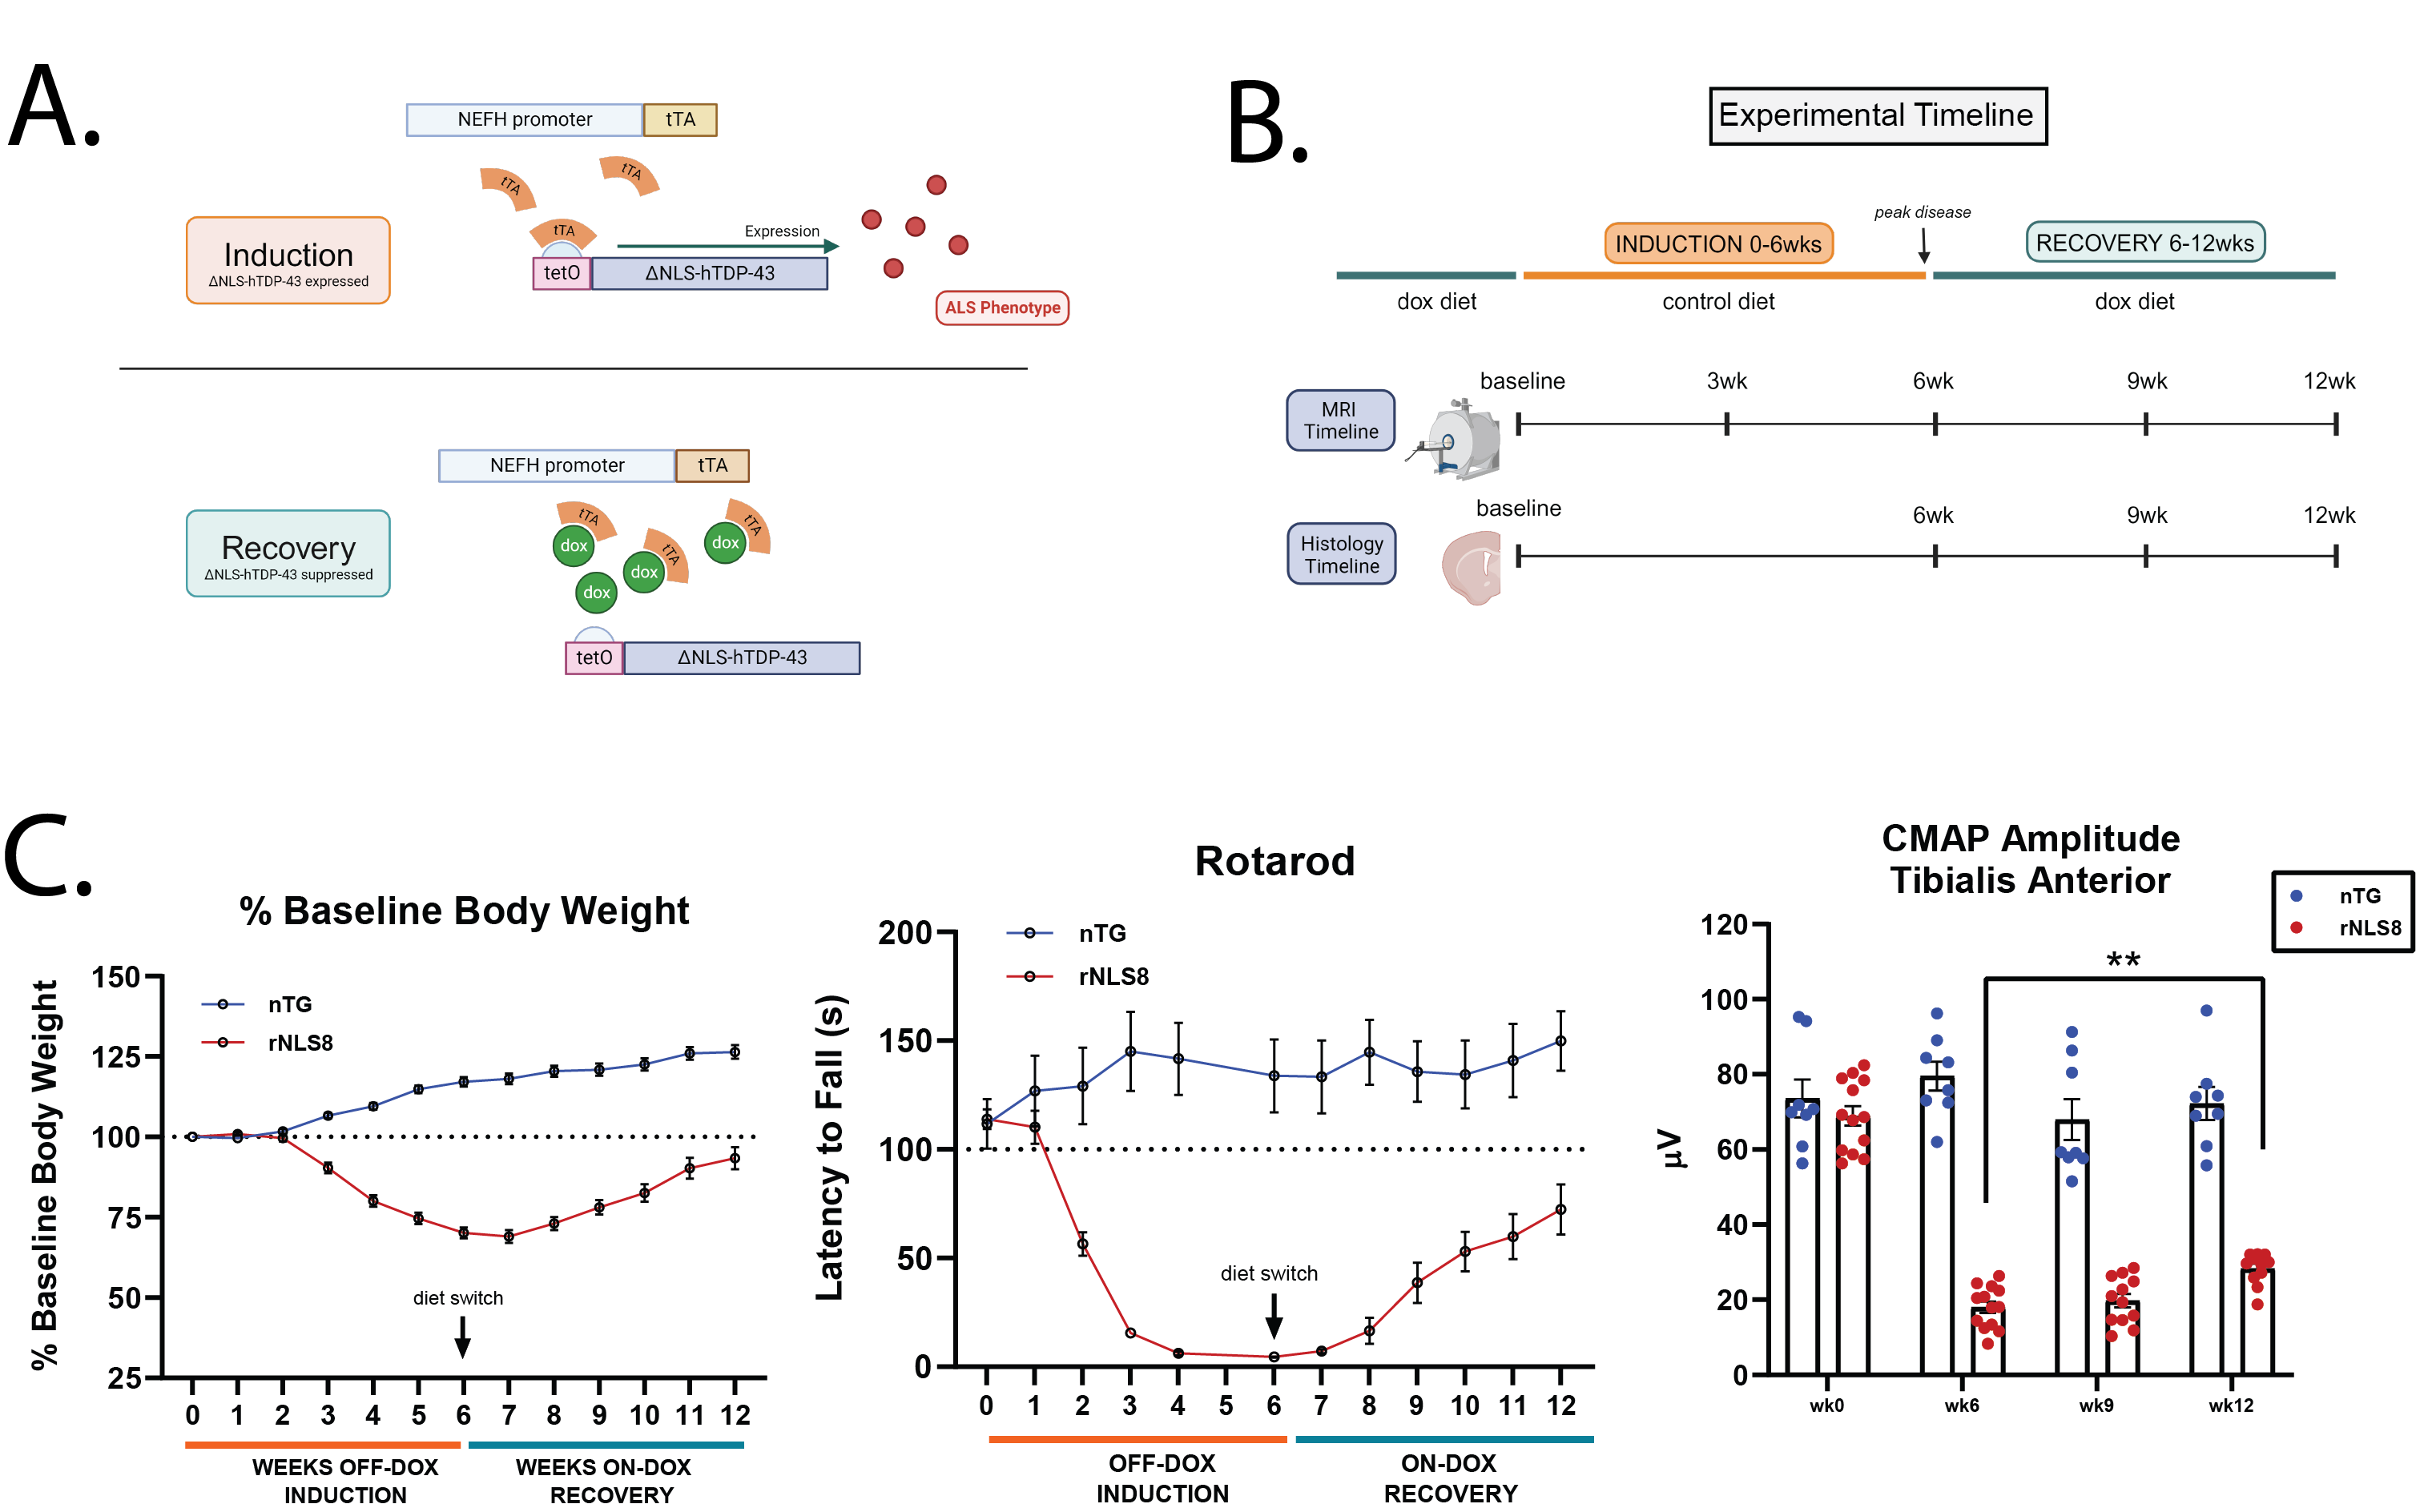
Animal modelAll animal procedures were approved by the institutional AAALAC-accredited review board. Non-transgenic (nTG) and NEFH-hTDP-43ΔNLS (rNLS8) mice were initially maintained on doxycycline-containing diet (200mg/kg, BioServ-S3888). They were switched onto control diet (BioServe S2407) for a 6-week induction period, then switched back to doxycycline diet for a 6-week recovery period before takedown. Timelines for imaging and histology are shown in Fig1B.
Rotarod
Mice were trained on the rotarod for 5min at 5rpm one day prior to the first test. For each test, mice were placed on the rotarod, which accelerated from 4-40rpm and the average latency of 3 falls was recorded.
Histology
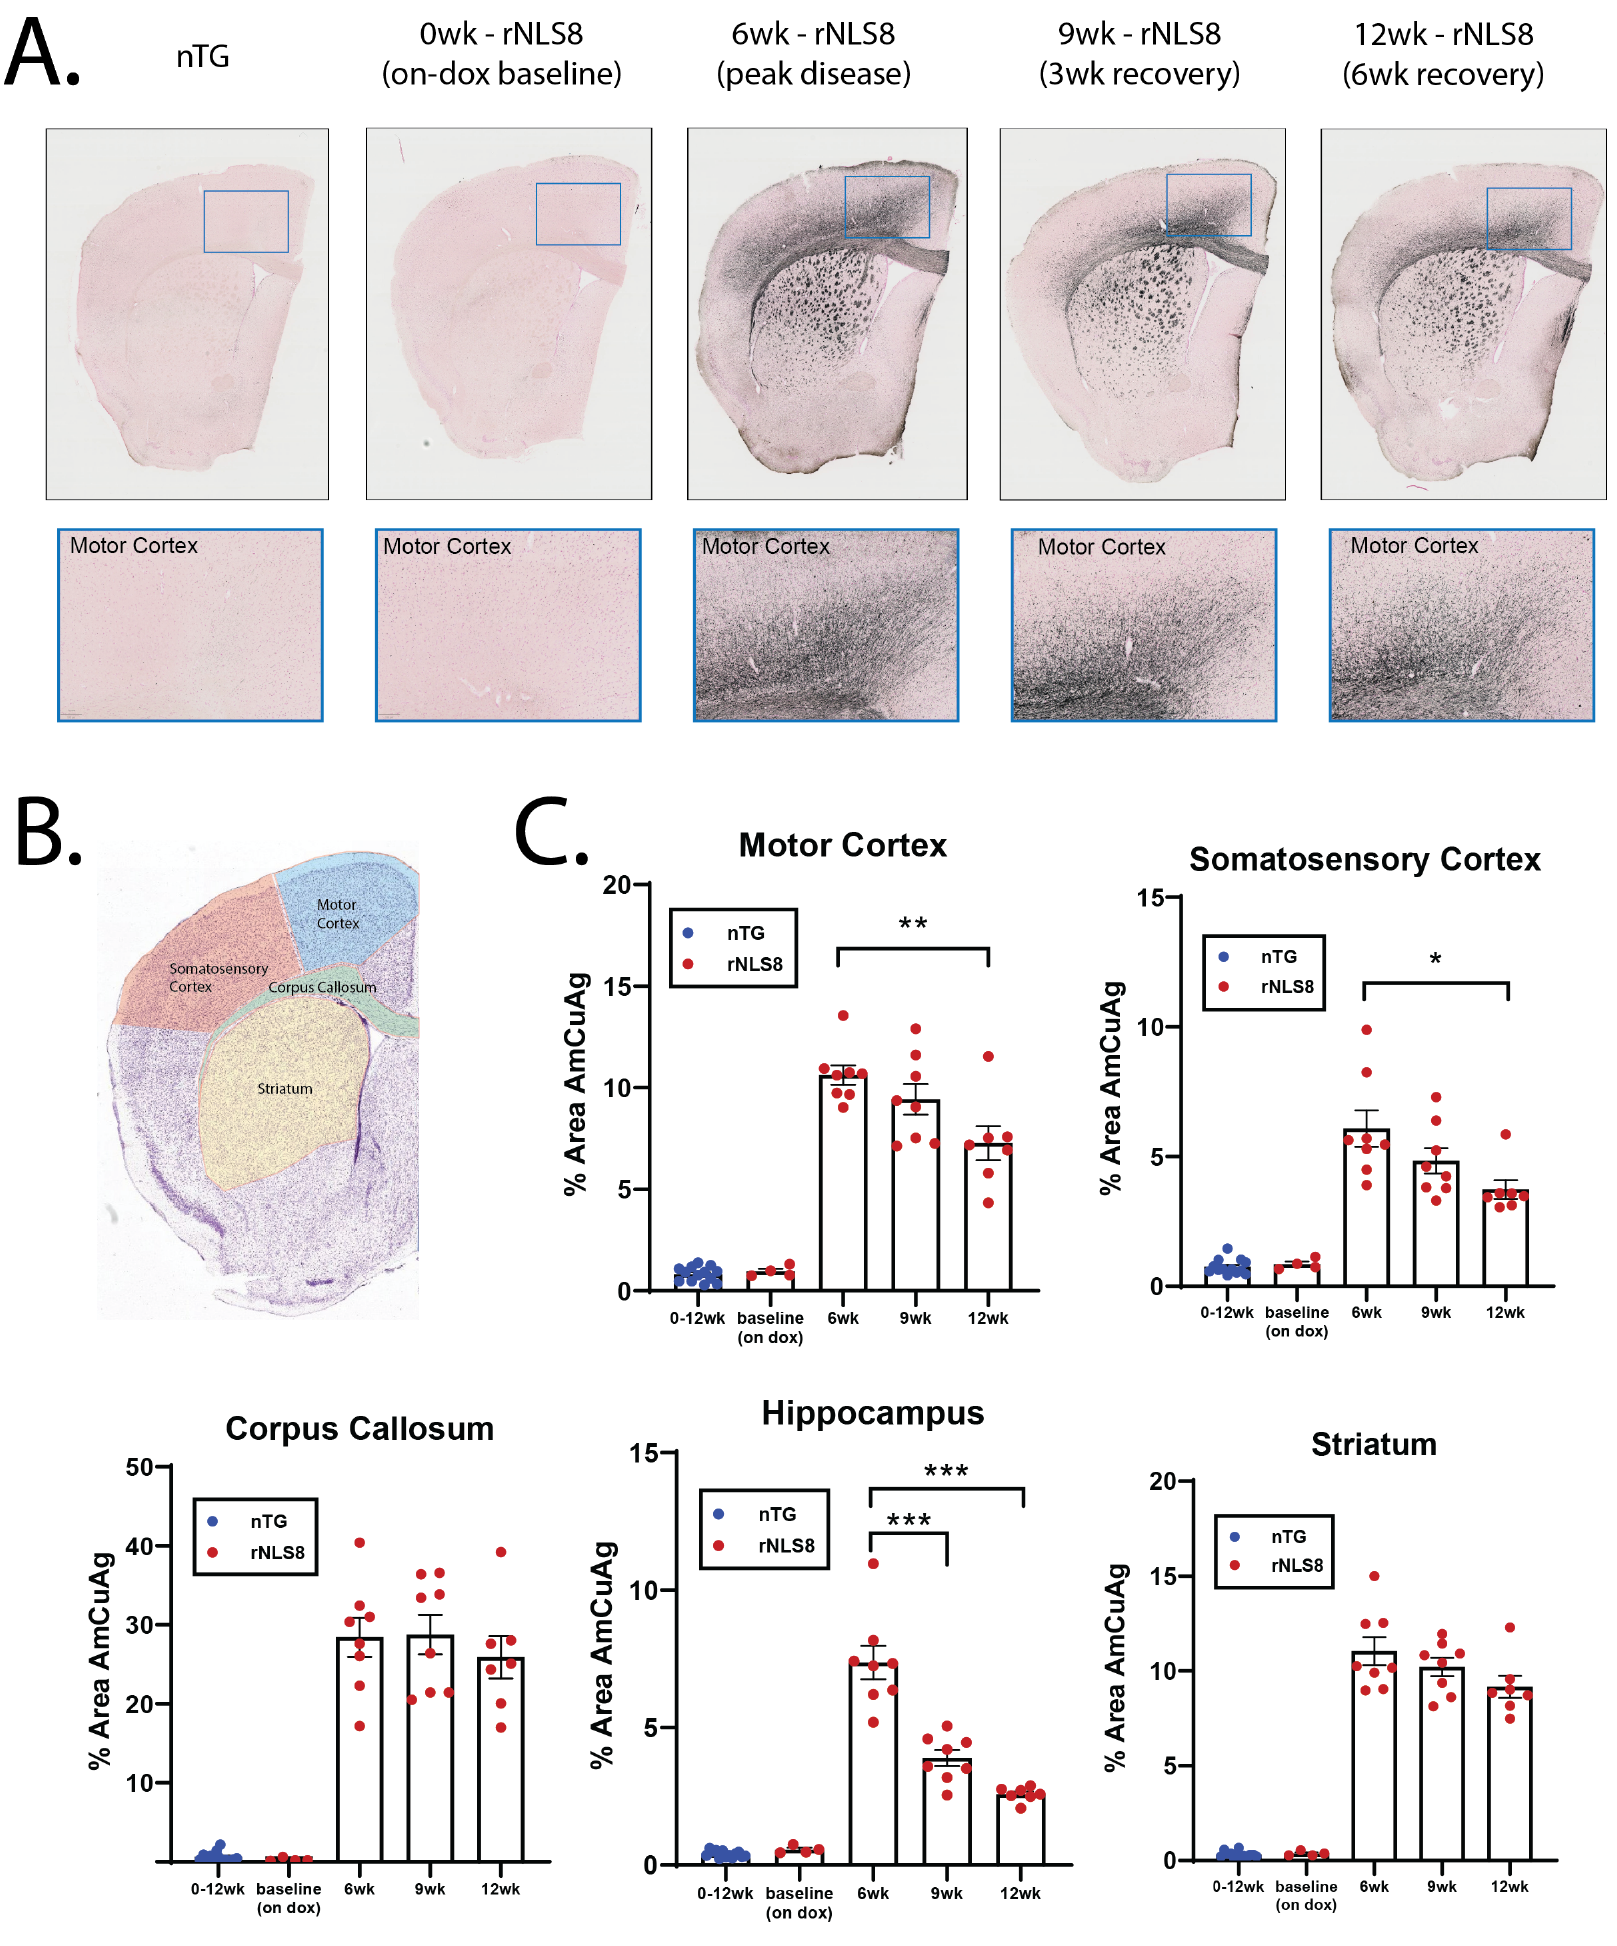
Mice were transcardially perfused with PBS then 4% PFA. Hemibrain sectioning and Amino-Cupric-Silver (AmCuAg) staining were performed by NeuroScience Associates to reveal degenerating neurons5. A total of n=13 nTG and n=27 rNLS8 mice were included in the histological analysis, which included the mice designated for MRI (n=8 nTG; n=15 rNLS8). Hemibrain images were analyzed in QuPath for quantification of AmCuAg staining across the motor cortex, somatosensory cortex, corpus callosum, striatum, and hippocampus.
MRI and analysis
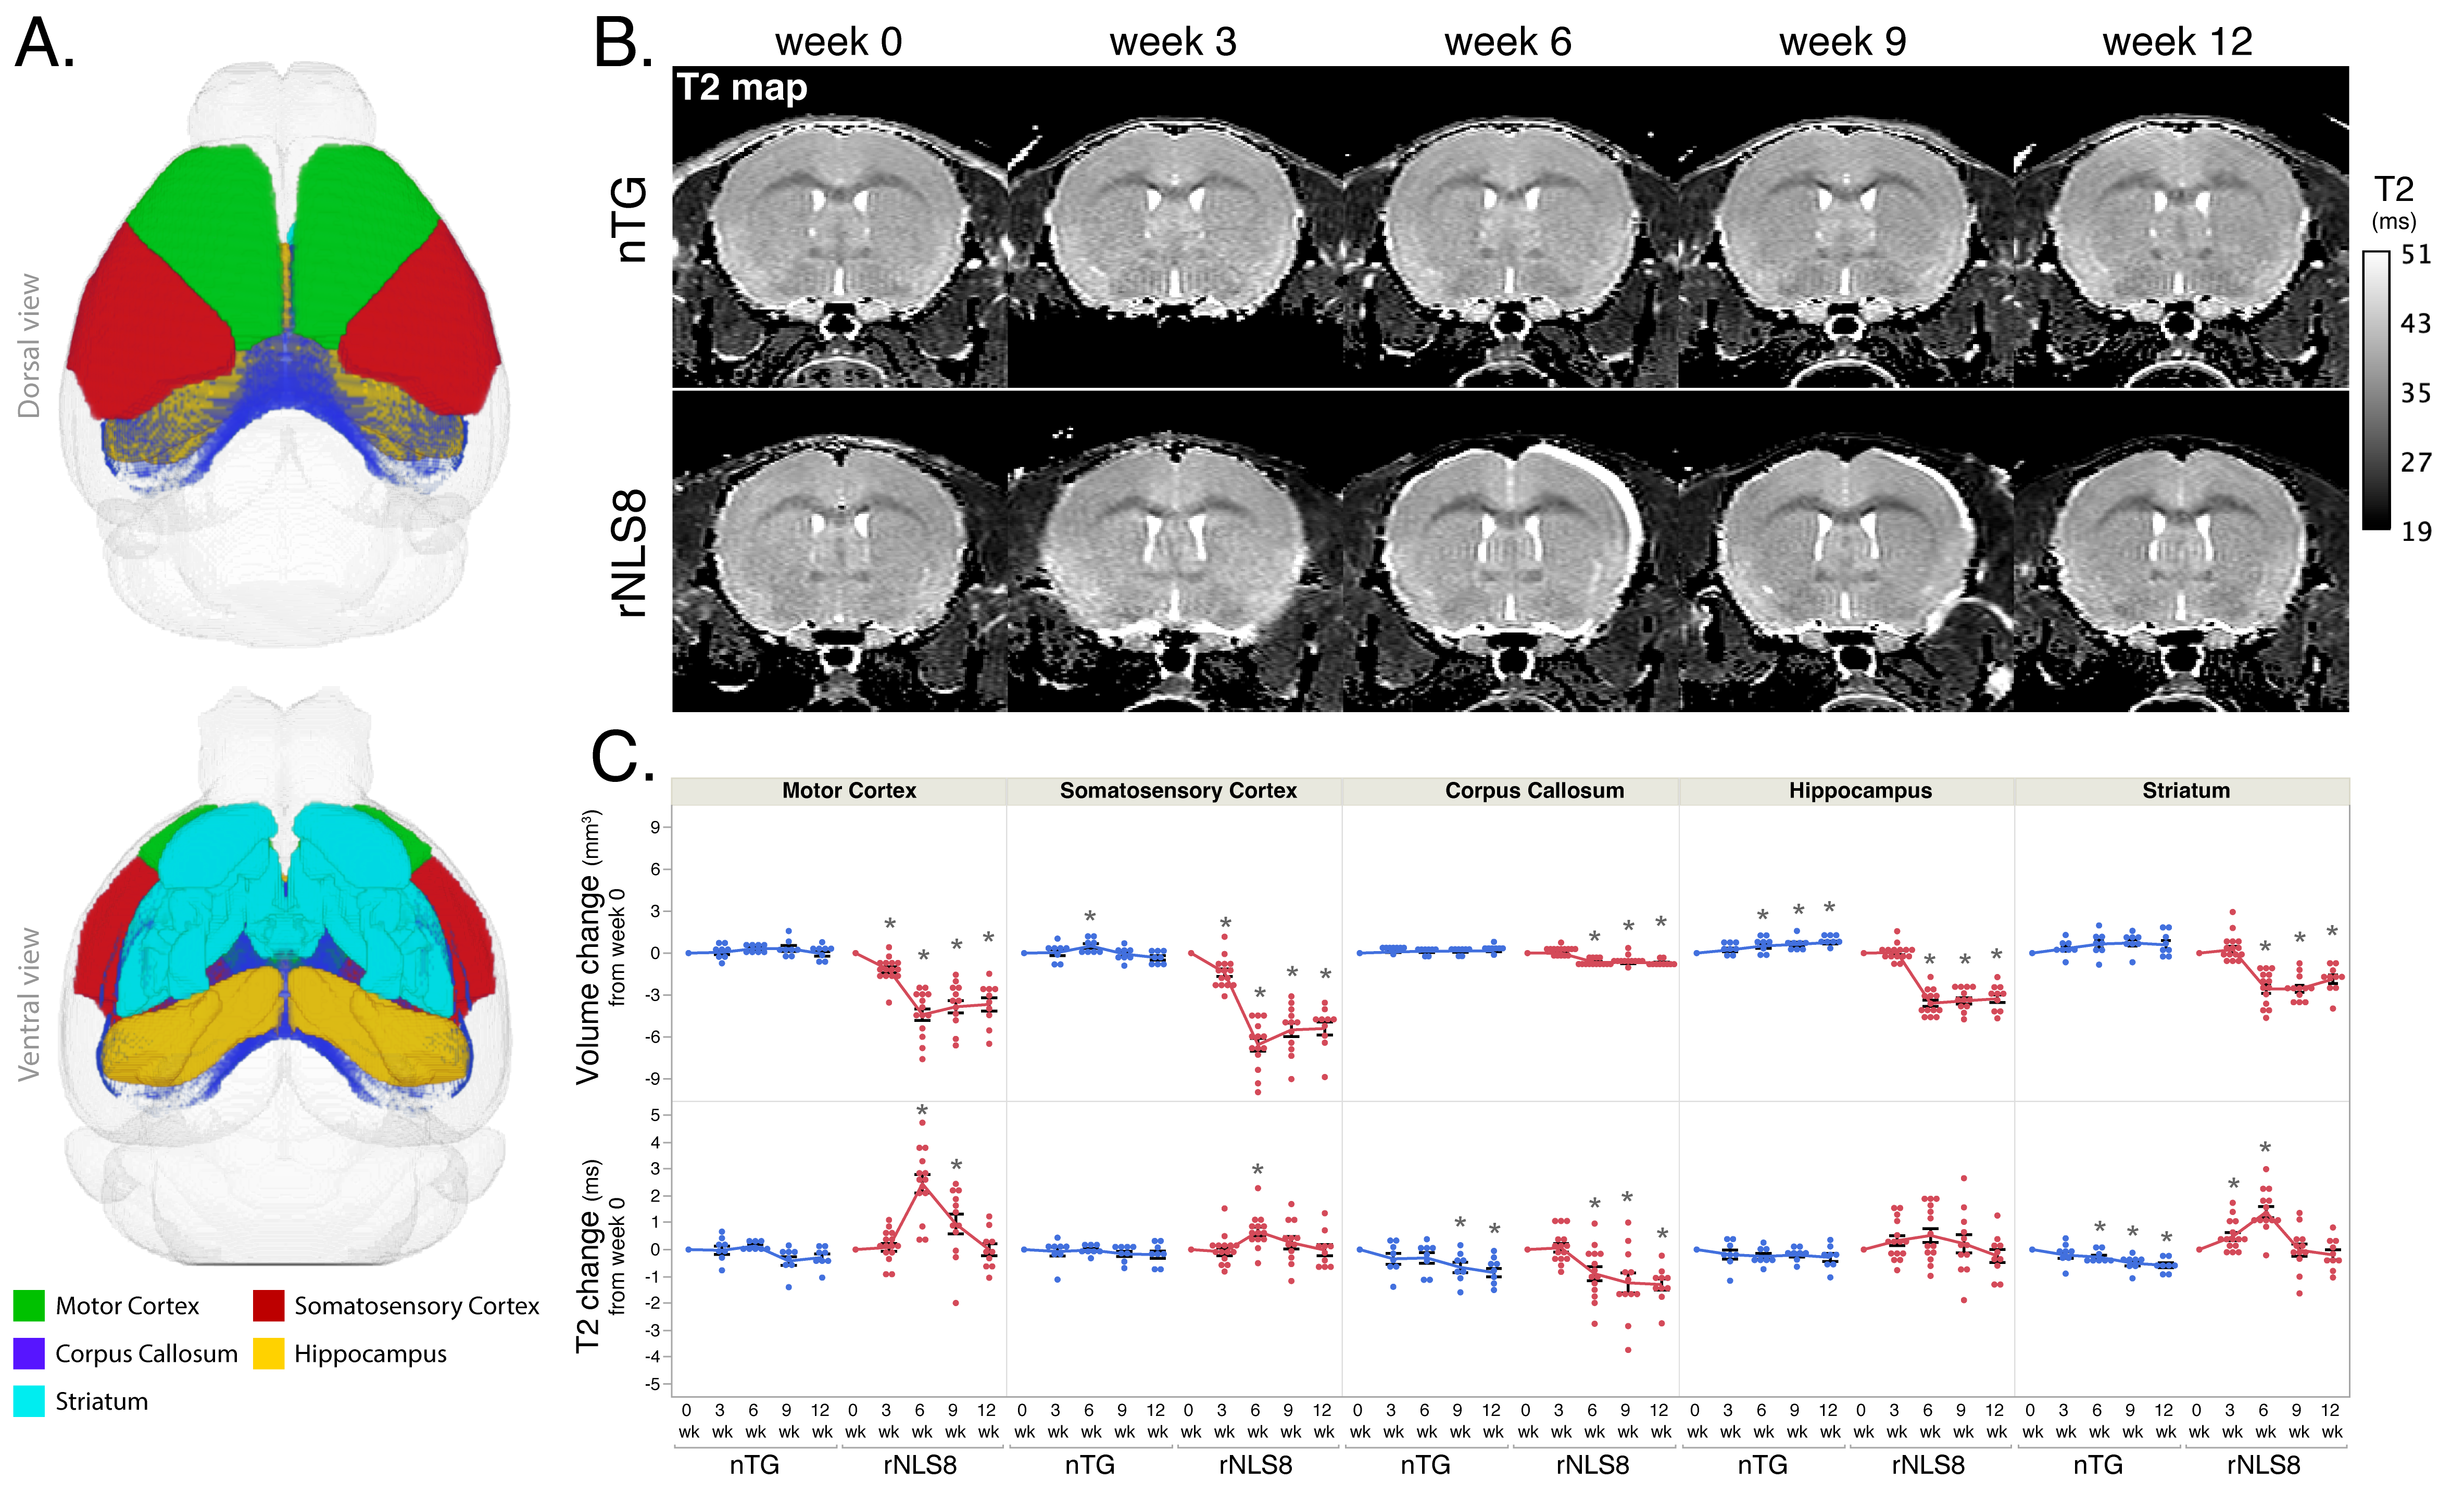
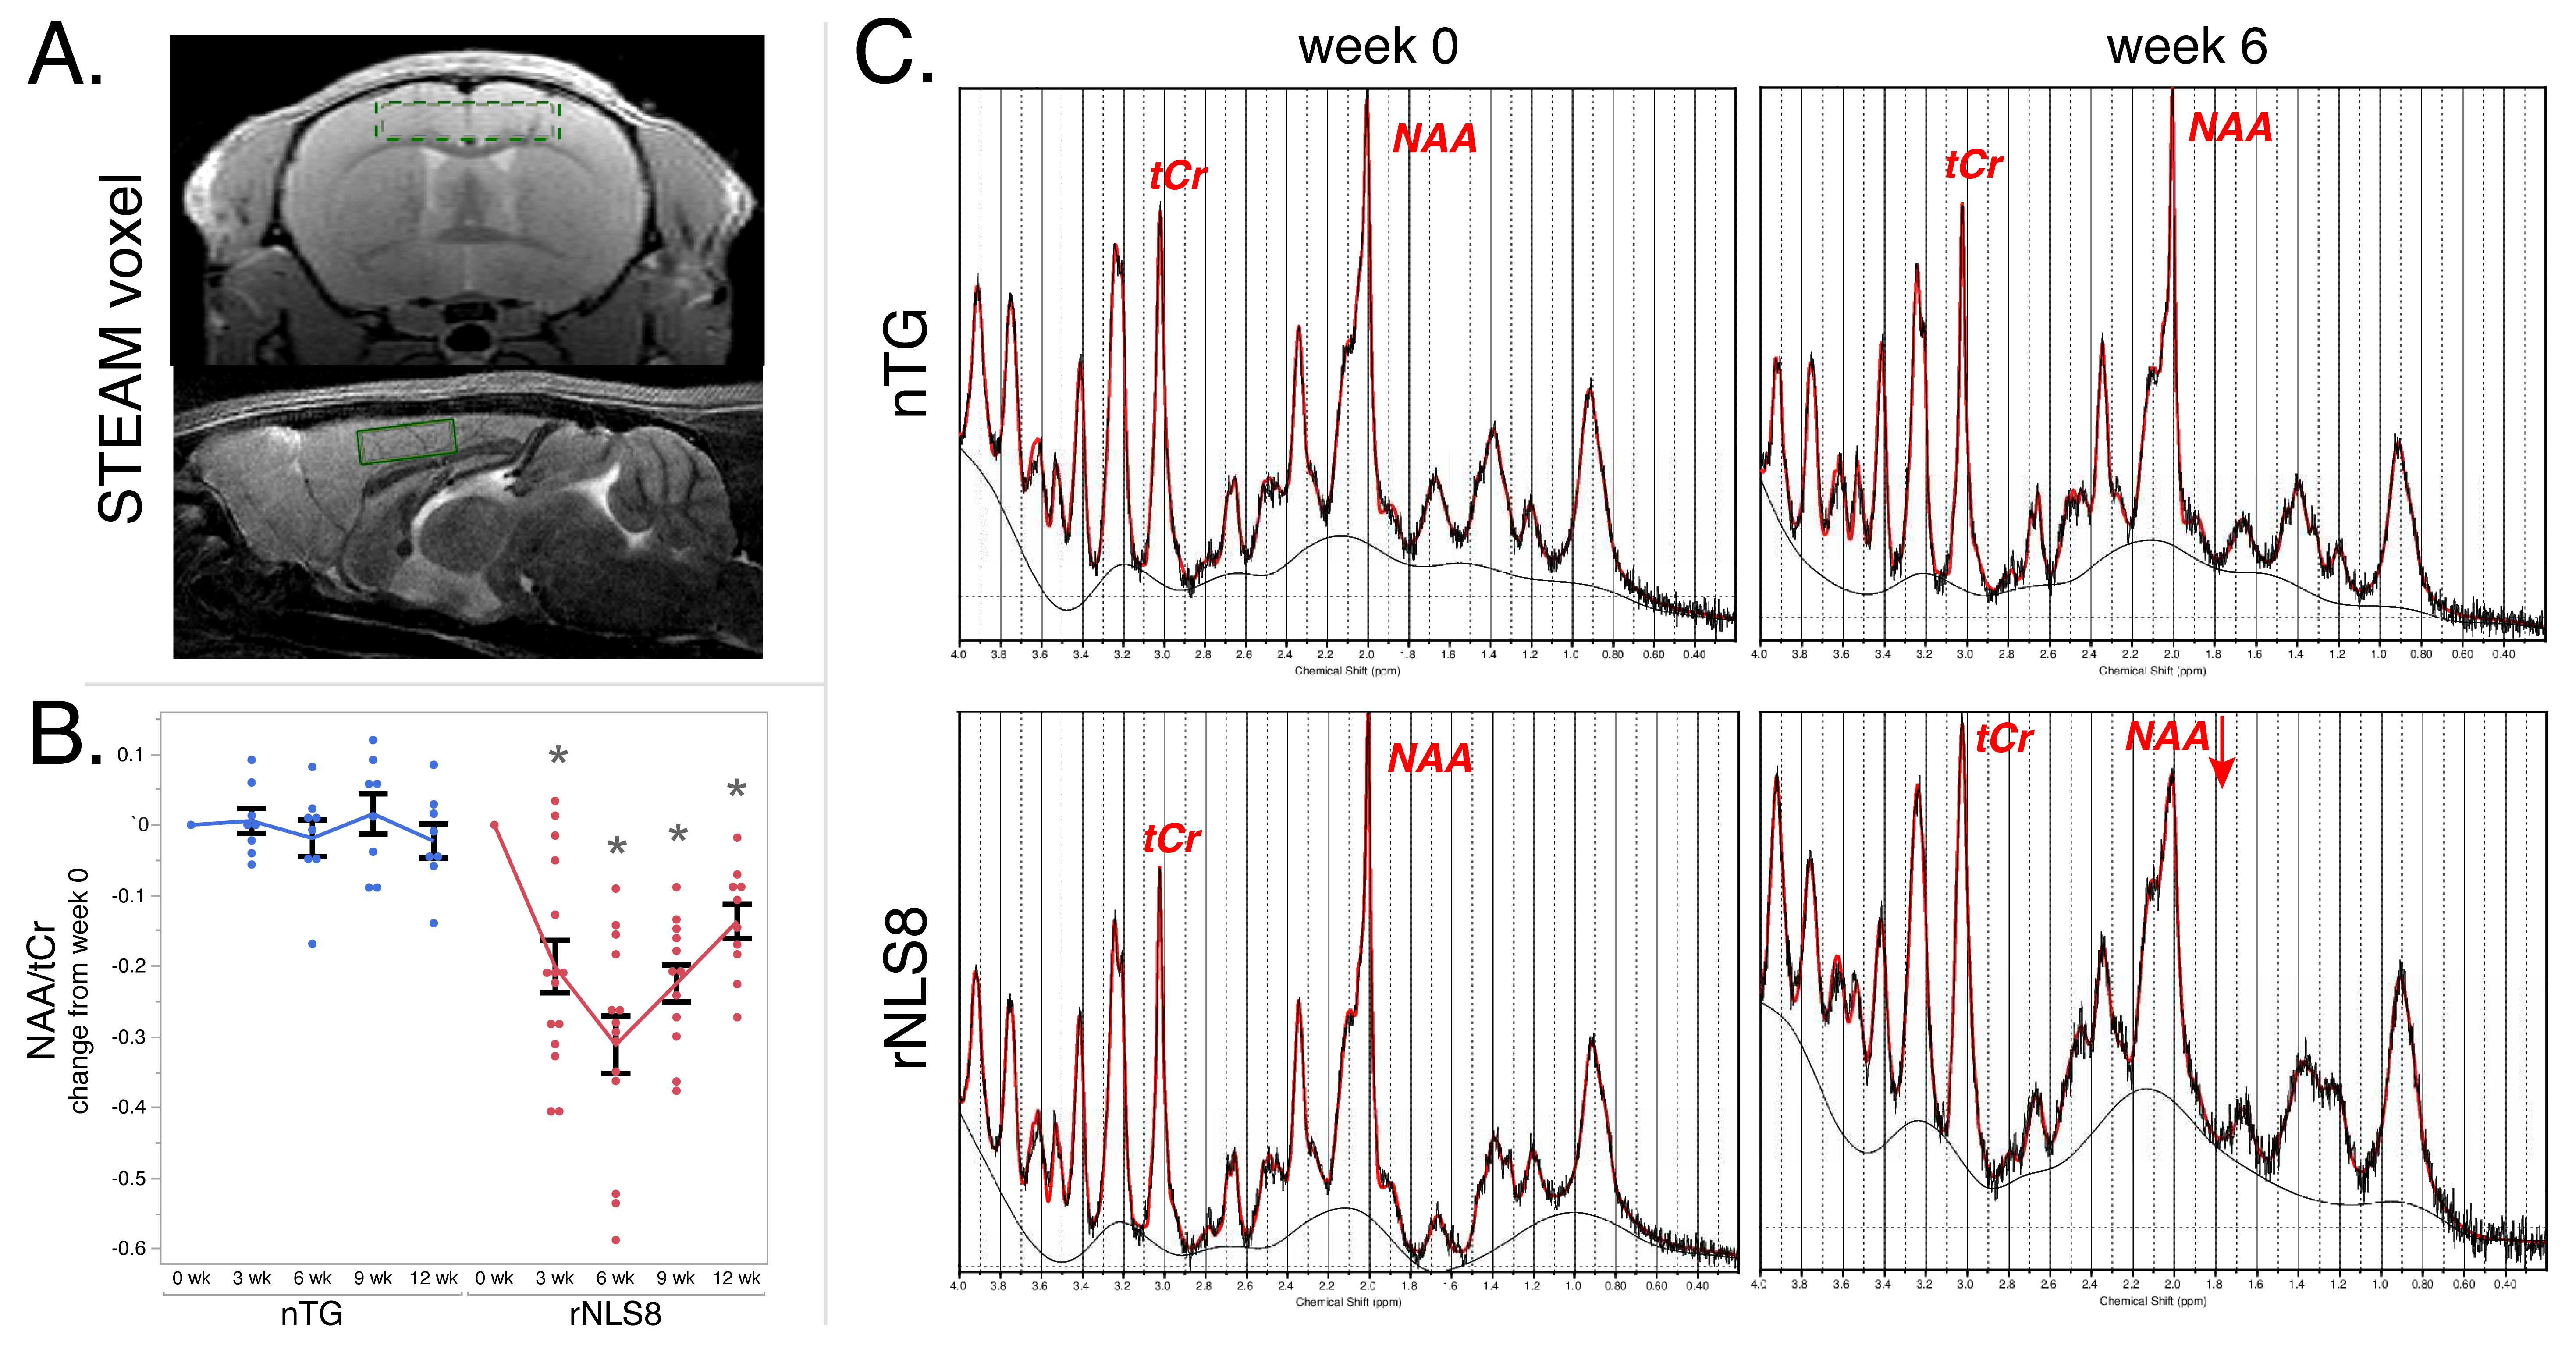
Animals were anesthetized with ~2% isoflurane and maintained at 37ºC. Imaging was performed on a Bruker 7T with a volume transmit and cryoprobe receive coil. Whole brain T2 mapping was done with an MSME sequence and these parameters: TR=5.2s, TE1/spacing/TE12=6.5/6.5/78ms, matrix=256×256×56, resolution=75×75×300μm3. For image analysis, all brains were registered to the common coordinate framework v36 and regional volumes were extracted using ANTx27. Average T2 and volume were calculated in the same regions as histology (Fig3A). STEAM MRS was done with a 4×0.8×2.5mm3 voxel in the motor cortex (Fig4A) and these parameters: TE/TM/TR=3/10/5000ms, NEX=128, and localized shimming. Spectra were analyzed using LCModel8 to obtain the ratio of NAA to total creatine (tCr)9.
Results
Fig1A-B describes the mechanism of induction and recovery in rNLS8 mice and the experimental timeline. The rNLS8 mice exhibited motor deficits during the 6-week induction phase (Fig1C), which significantly improved after 6 weeks of recovery. The phenotype correlated with increased AmCuAg staining (Fig2A,C) with the highest amount of staining occurring at 6 weeks. After the 6-week recovery period, the AmCuAg signal significantly reduced in the motor cortex, somatosensory cortex, and hippocampus.Fig3B shows T2 maps from representative animals in each group and Fig3C shows longitudinal changes in volume and T2. The volume of all regions significantly reduced in the rNLS8 group during the induction period and while some recovery followed, it did not return to baseline levels. T2 significantly increased in the motor cortex, somatosensory cortex and striatum and fully recovered to baseline levels. The motor cortex exhibited the greatest change in T2 of 2.5±1.2ms.
Fig4B shows longitudinal changes in NAA/tCr, and Fig4C shows representative spectra at baseline and 6 weeks. NAA/tCr significantly reduced at 3 weeks (-0.20±1.4) and 6 weeks (-0.31±1.5) and then reversed but not to baseline levels.
Discussion and Conclusion
Significant changes in T2, volume and NAA/tCr were observed after 6 weeks of induction, and these changes reversed after a 6-week recovery period. Changes in MRI metrics were corroborated by AmCuAg staining. NAA/tCr exhibited the greatest change: −29±14% at 6 weeks. Other groups have reported that during the recovery period in this model, neuronal loss is unchanged, but markers of ALS-associated protein aggregation are decreased, and muscle innervation is increased10. This indicates a recovery of motor neuron function following the clearance of the pathogenic hTDP-43ΔNLS protein. These changes could be driving the reversal of the MRI metrics.Taken together, these data suggest that MRI endpoints have the potential to be used clinically to monitor ALS progression, and preclinically as an indicator of therapeutic efficacy.
Acknowledgements
No acknowledgement found.References
- Kalra S, Müller HP, Ishaque A, Zinman L, Korngut L, Genge A, Beaulieu C, Frayne R, Graham SJ, Kassubek J. A prospective harmonized multicenter DTI study of cerebral white matter degeneration in ALS. Neurology. 2020 Aug 25;95(8):e943-e952.
- Kalra S. Magnetic Resonance Spectroscopy in ALS. Frontiers in Neurology. 2019 May 10;10:482.
- Filippi M, Agosta F, Abrahams S, Fazekas F, Grosskreutz J, Kalra S, Kassubek J, Silani V, Turner MR, Masdeu JC. EFNS guidelines on the use of neuroimaging in the management of motor neuron diseases. European Journal of Neurology. 2010 Apr;17(4):526-e20.
- Michaelis T, Boretius S, Frahm J. Localized proton MRS of animal brain in vivo: models of human disorders. Progress in Nuclear Magnetic Resonance Spectroscopy. 2009 Jul;55(1):1-34.
- Switzer RC 3rd. Application of silver degeneration stains for neurotoxicity testing. Toxicology Pathology. 2000 Jan-Feb;28(1):70-83.
- Wang Q, Ding SL, Li Y, Royall J, Feng D, Lesnar P, Graddis N, Naeemi M, Facer B, Ho A, Dolbeare T. The Allen mouse brain common coordinate framework: a 3D reference atlas. Cell. 2020 May 14;181(4):936-53
- Koch S, Mueller S, Foddis M, Bienert T, von Elverfeldt D, Knab F, Farr TD, Bernard R, Dopatka M, Rex A, Dirnagl U. Atlas registration for edema-corrected MRI lesion volume in mouse stroke models. Journal of Cerebral Blood Flow & Metabolism. 2019 Feb;39(2):313-23.
- Provencher SW. Estimation of metabolite concentrations from localized in vivo proton NMR spectra. Magnetic Resonance in Medicine. 1993 Dec;30(6):672-9.
- Buonocore MH, Maddock RJ. Magnetic resonance spectroscopy of the brain: a review of physical principles and technical methods. Reviews in the Neurosciences. 2015 Dec 1;26(6):609-32.
- Walker AK, Spiller KJ, Ge G, Zheng A, Xu Y, Zhou M, Tripathy K, Kwong LK, Trojanowski JQ, Lee VM. Functional recovery in new mouse models of ALS/FTLD after clearance of pathological cytoplasmic TDP-43. Acta Neuropathologica. 2015 Nov;130(5):643-60.
Figures