4027
A Comparative Study of DTI and SANDI for Discriminating Alzheimer's Pathology in a 5xFAD Mouse Model1Department of Radiology and Imaging Sciences, Indiana University, Indianapolis, IN, United States, 2Indiana University School of Medicine, Indianapolis, IN, United States
Synopsis
Keywords: Alzheimer's Disease, Alzheimer's Disease, DTI, SANDI
Motivation: This study aims to assess DTI and SANDI's ability to detect Alzheimer's disease (AD) in a 5xFAD mouse model.
Goal(s): Employ logistic regression and ROC curve analysis on data from 166 brain regions to compare the performance of DTI and SANDI.
Approach: Data collection from 5xFAD mice, brain region segmentation, logistic regression modeling, and ROC curve generation.
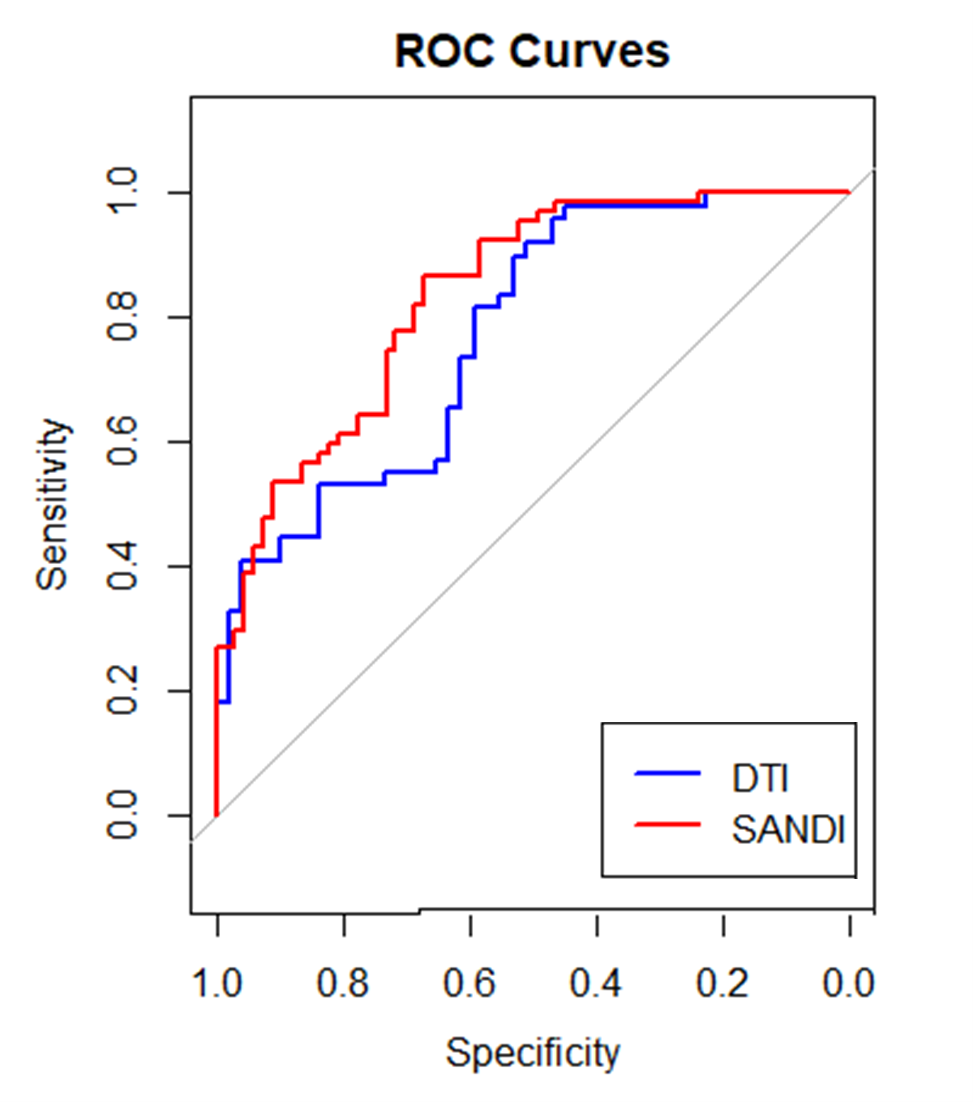
Results: SANDI exhibits superior AD detection capabilities compared to DTI, as evidenced by a higher AUC value, indicating enhanced sensitivity and specificity. These findings highlight SANDI's potential for nuanced preclinical AD biomarkers.
Impact: Implementing SANDI over DTI may improve early detection of Alzheimer's, potentially leading to better patient outcomes through earlier intervention and more targeted therapeutic strategies in preclinical settings.
Background and Purpose
Alzheimer’s disease (AD) is characterized by distinct neuropathological changes, early detection is crucial. In this comparative study, we assessed the potential of Diffusion Tensor Imaging (DTI) and Soma And Neurite Density Imaging (SANDI) to differentiate AD pathology in 5xFAD transgenic mice, using C57BL/6 mice as controls. Both imaging techniques were evaluated for their ability to delineate microstructural alterations in 166 brain regions to identify a more sensitive imaging biomarker for AD.Methods
In a controlled comparative study, two groups of mice, the Alzheimer's disease model 5xFAD (n=5) and the wild-type control C57BL/6 (n=5), were scanned using a 9.4T MRI system. DTI scans were performed using optimized b-values to capture diffusion anisotropy and mean diffusivity, while SANDI scans utilized higher b-values designed to resolve cell soma and neurite density. Brain segmentation into 166 regions was automated with a mouse brain atlas and verified manually. For SANDI analysis, the parameters included Diffusivity (DE), Intracellular Volume Fraction (DIN), the fraction of extracellular water (fit_fextra), neurite density index (fit_fneurite), soma density index (fit_fsoma), and soma size index (fit_Rsoma). These metrics were extracted using compartment models that account for the intracellular, extracellular, and cerebrospinal fluid compartments. T-Test and effect size were preformed to select the significant labels in each parameter. Following this, a one-way ANOVA was applied to each parameter to identify those with the most significant mean differences between the AD and control groups. Logistic regression models incorporating these SANDI parameters and conventional DTI metrics with Fractional Anisotropy (FA), Axial Diffusivity (AD), Mean Diffusivity (MD), and Radial Diffusivity (RD) were developed to predict AD pathology. ROC curve analysis quantified the models' diagnostic accuracy, with AUC values serving as the primary measure of performance. All statistical analyses were performed using R4.3.1.Results
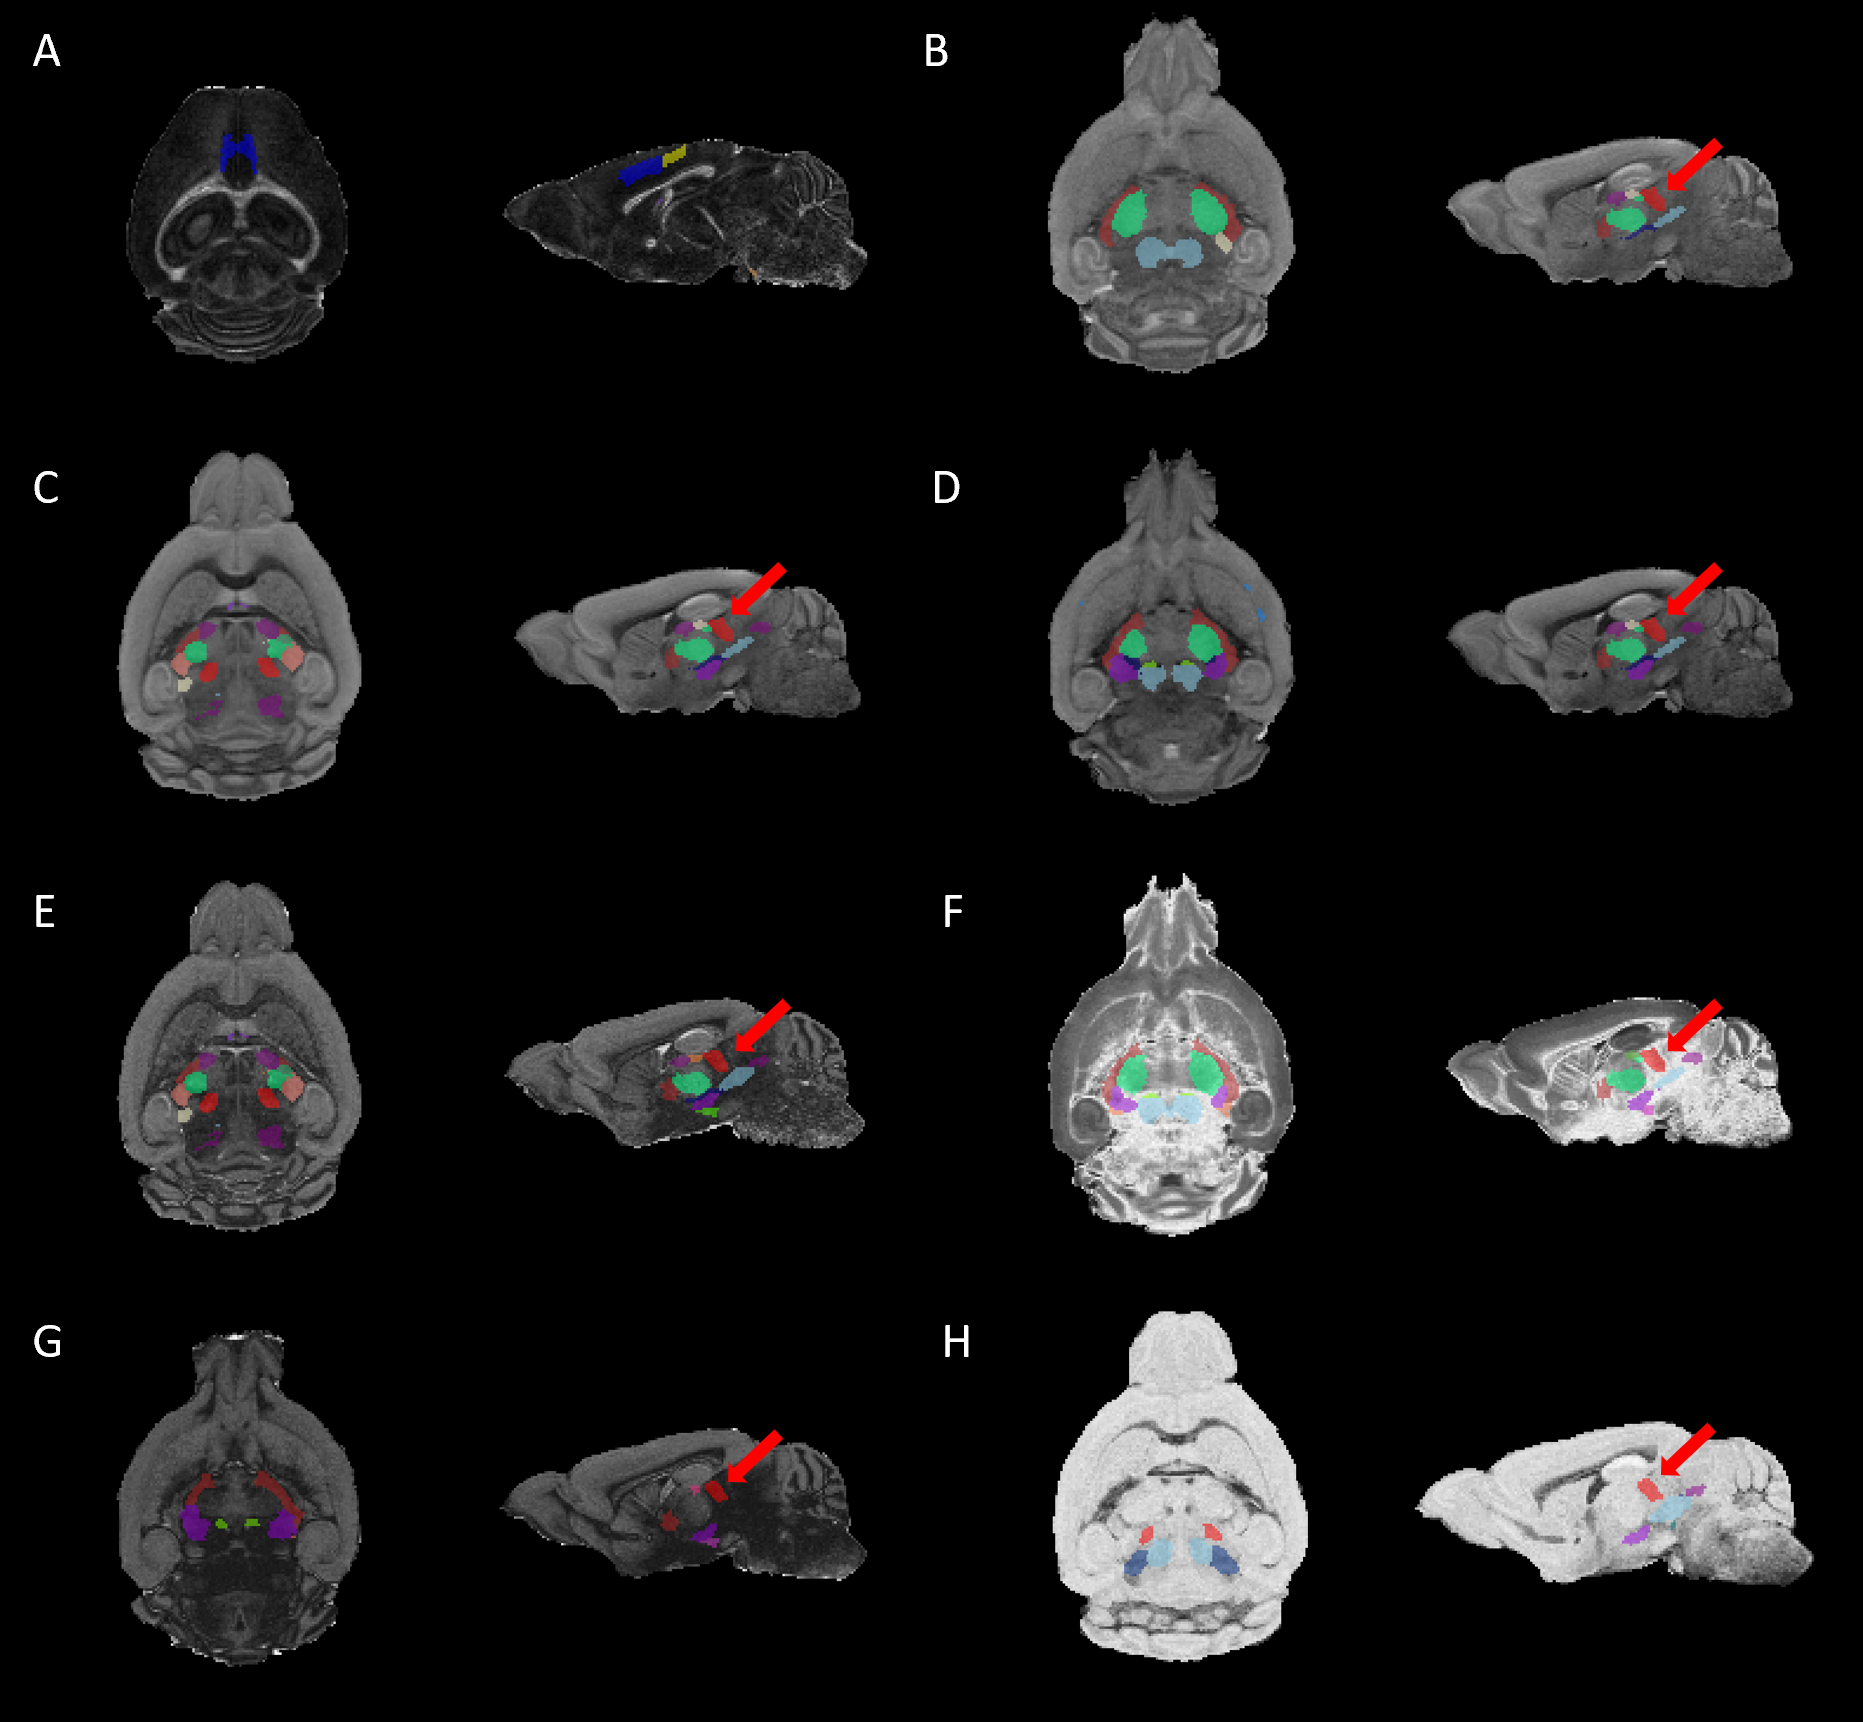
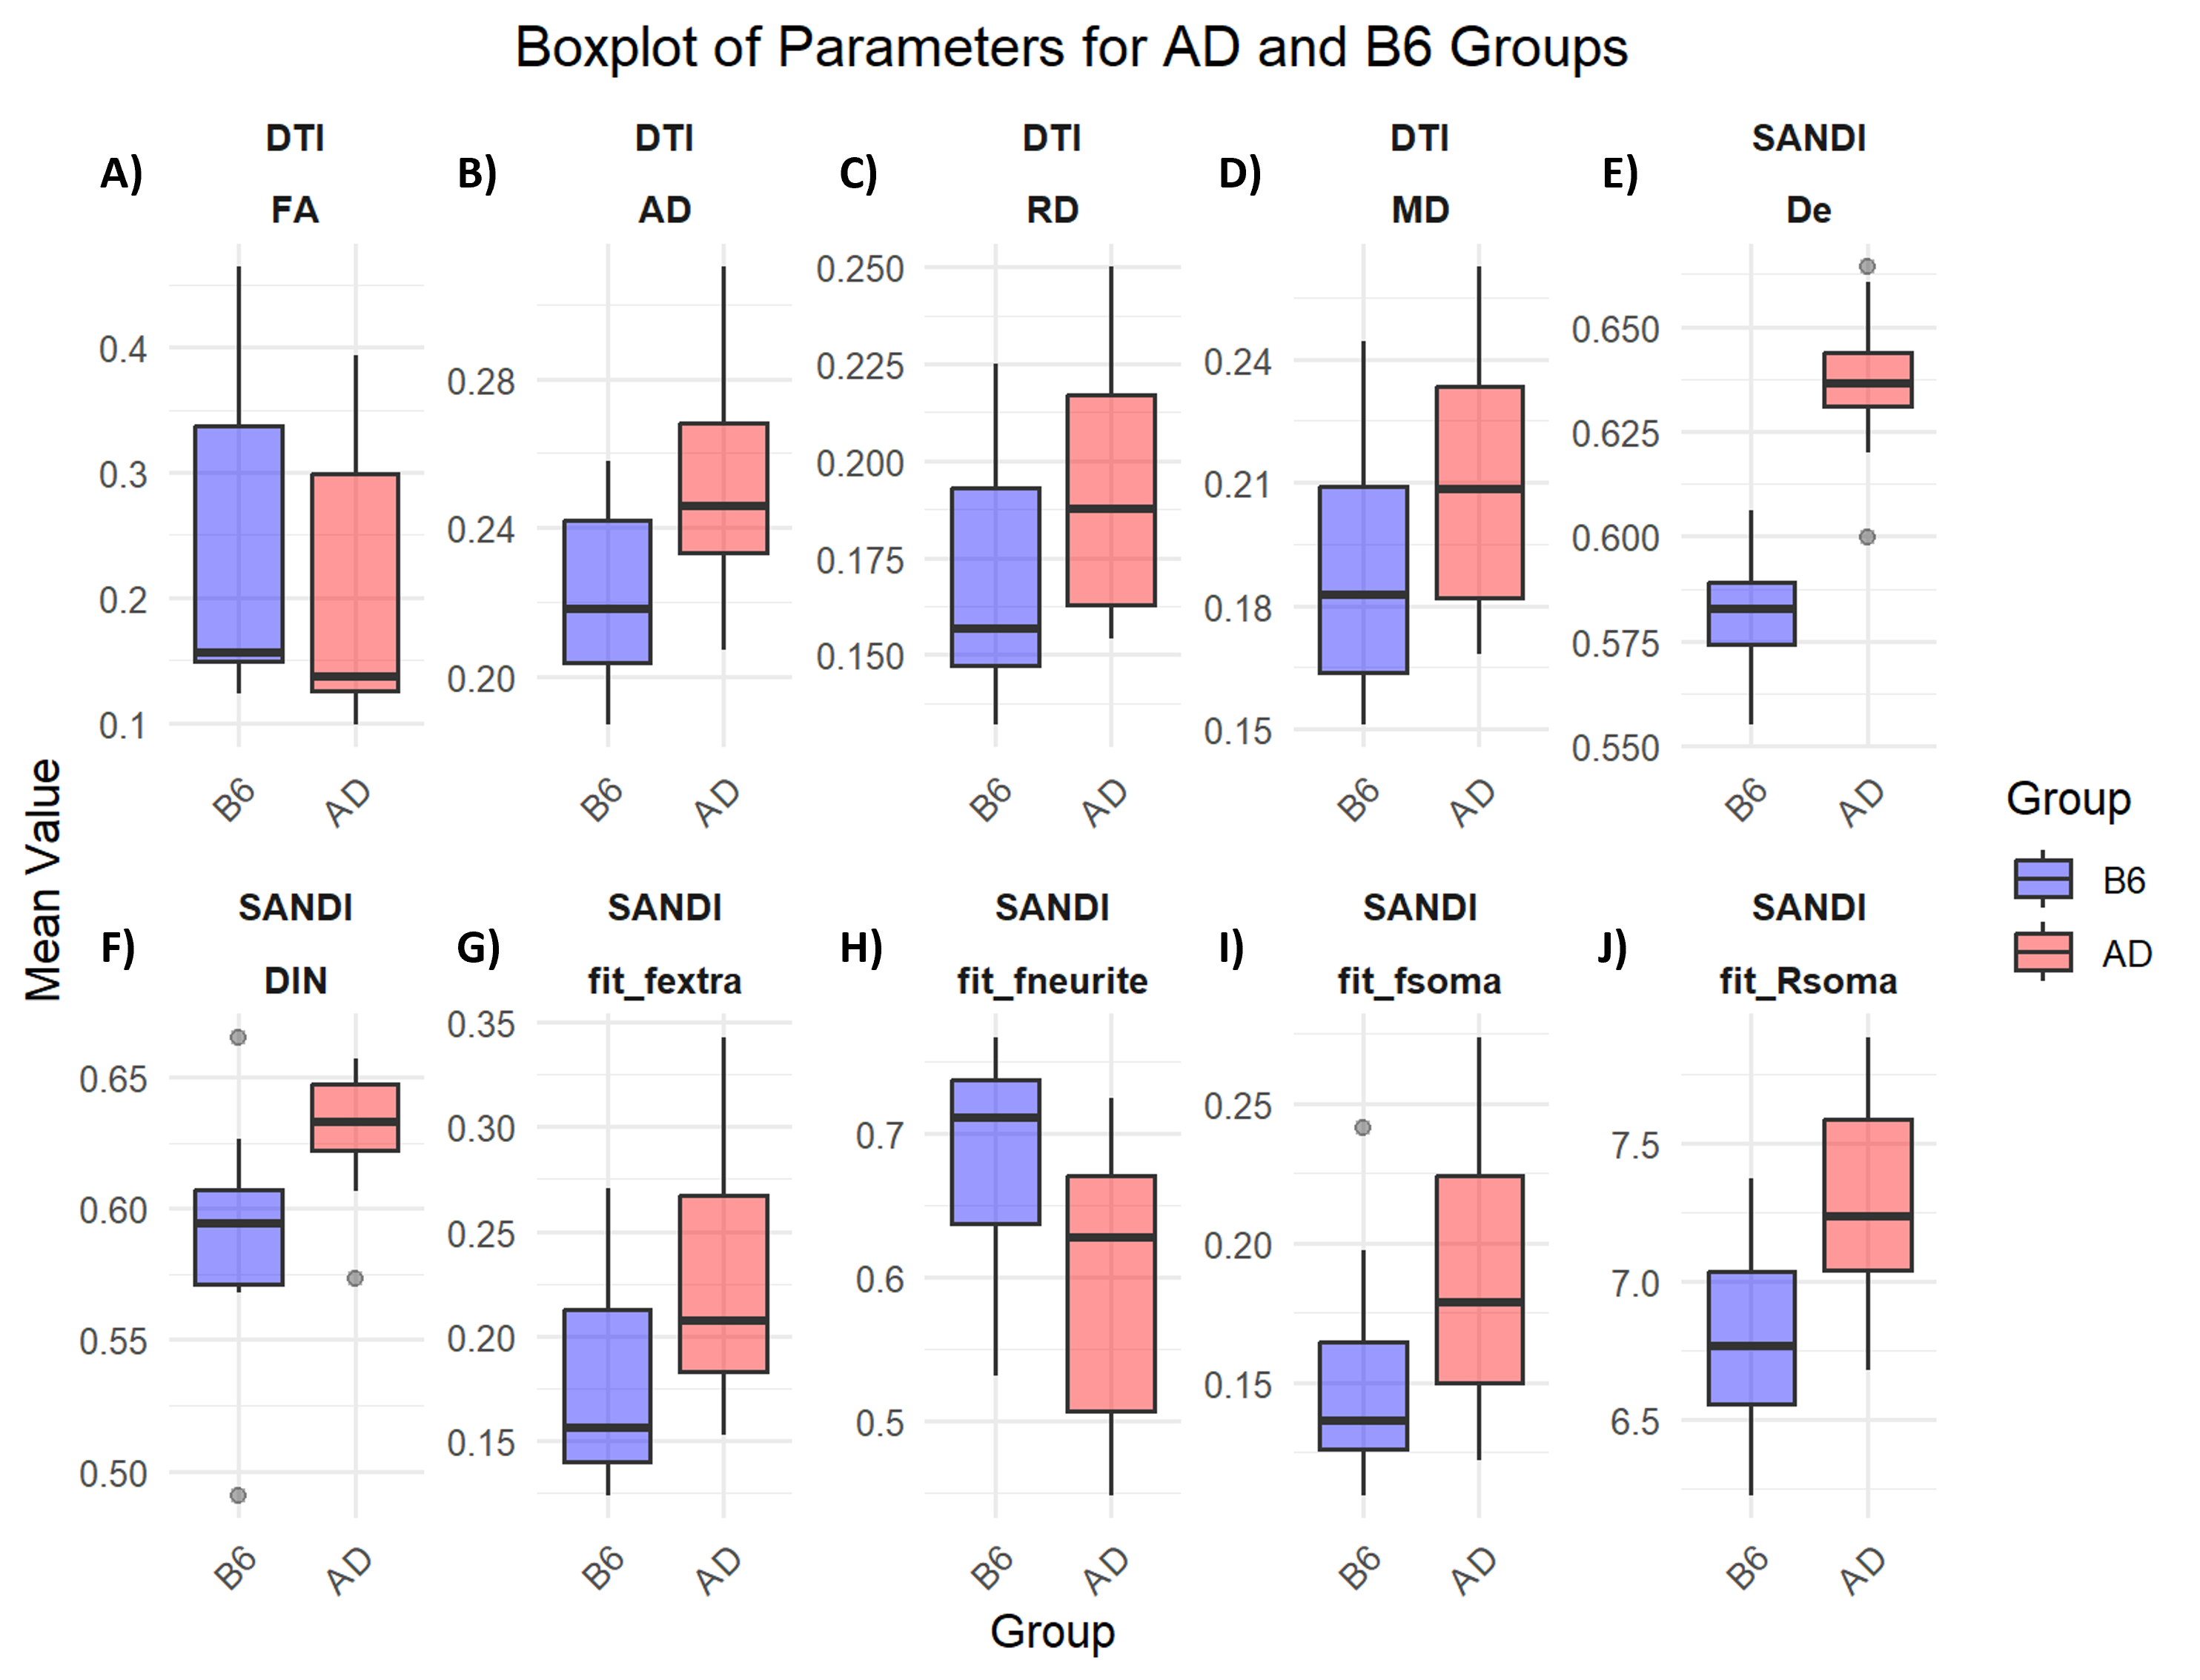
The analysis within the DTI parameters yielded no labels with a large effect size (Cohen's d > 0.8) for FA. To compensate, labels with a moderate effect size (Cohen's d > 0.5) were selected for FA, identifying 5 such labels for inclusion in the logistic regression models. For the other DTI metrics, namely AD, MD, and RD, labels surpassing the larger effect size threshold of 0.8 were used, resulting in 8 significant labels for AD, 7 for MD, and 15 for RD. In comparison, SANDI parameters showed a broader distribution of significant differences, particularly notable in 8 labels for De, 2 for DIN, 16 for fit_fextra, 13 for fit_fneurite, 3 for fit_fsoma, and 4 for fit_Rsoma. Notably, in the DTI analysis, some regions (Figure 1) exhibited highly significant associations with AD, MD, and RD, with p-values below 0.01 and Cohen's d values exceeding 0.8. Among all labels, label 3 with a moderate effect size outperformed others in terms of FA. Within the SANDI, some regions (Figure 1) stood out as the top-performing marker, demonstrating large effect sizes across fit_fextra, fit_fneurite, fit_fsoma, and fit_Rsoma parameters. Their robust performance across all four parameters underscores its potential as a valuable biomarker. Accroding to one-way ANOVA analysis, the parameters that demonstrated the most robust difference, as indicated by the highest mean difference and lowest adjusted p-value, was fit_Rsoma from the SANDI parameters. It showed a profound mean difference in the AD group compared to the control, with an adjusted p-value of 0 across several comparisons. In the ROC curve analysis, labels were carefully selected based on their effect sizes to construct the most predictive models for each imaging technique. For DTI, despite FA not reaching the higher effect size benchmark (Cohen's d > 0.8), labels with a moderate effect size (Cohen's d > 0.5) were incorporated, yielding 5 labels. On the other hand, labels for AD, MD, and RD parameters were chosen for their large effect sizes (Cohen's d > 0.8). The resulting logistic regression model for DTI presented an AUC of 0.772. In contrast, the SANDI model incorporated labels that surpassed the effect size threshold of 0.8 across its parameters, showcasing a higher predictive accuracy with an AUC of 0.834, hence underscoring the enhanced capacity of SANDI to discriminate AD pathology.Conclusions
SANDI provides a more sensitive measure of AD-related changes in brain microstructure than DTI, suggesting its greater utility as a biomarker in preclinical models. This study advocates for the use of SANDI in early AD diagnosis and as a potential tool for tracking disease progression and response to treatment.Acknowledgements
This project was supported by NIH R01 NS125020 and Roberts Drug Discovery Fund & TREAT-AD Center Grant.References
1. Ianuş, Andrada et al. “Soma and Neurite Density MRI (SANDI) of the in-vivo mouse brain and comparison with the Allen Brain Atlas.” NeuroImage vol. 254 (2022): 119135. doi:10.1016/j.neuroimage.2022.119135
2. Palombo, Marco et al. “SANDI: A compartment-based model for non-invasive apparent soma and neurite imaging by diffusion MRI.” NeuroImage vol. 215 (2020): 116835. doi:10.1016/j.neuroimage.2020.116835
3. Maharjan, Surendra et al. “Age-dependent microstructure alterations in 5xFAD mice by high-resolution diffusion tensor imaging.” Frontiers in neuroscience vol. 16 964654. 17 Aug. 2022, doi:10.3389/fnins.2022.964654
4. Oblak, Adrian L et al. “Comprehensive Evaluation of the 5XFAD Mouse Model for Preclinical Testing Applications: A MODEL-AD Study.” Frontiers in aging neuroscience vol. 13 713726. 23 Jul. 2021, doi:10.3389/fnagi.2021.713726
5. Igarashi, Hironaka et al. “Longitudinal GluCEST MRI Changes and Cerebral Blood Flow in 5xFAD Mice.” Contrast media & molecular imaging vol. 2020 8831936. 25 Nov. 2020, doi:10.1155/2020/8831936
6. Yoo, Chi-Hyeon et al. “Neurodegenerative Changes in the Brains of the 5xFAD Alzheimer's Disease Model Mice Investigated by High-Field and High-Resolution Magnetic Resonance Imaging and Multi-Nuclei Magnetic Resonance Spectroscopy.” International journal of molecular sciences vol. 24,6 5073. 7 Mar. 2023, doi:10.3390/ijms24065073
Figures