4024
Functional and structural connectivity changes in neocortical regions of the brain in a mouse model of Alzheimer’s disease1iHuman institute, ShanghaiTech University, Shanghai, China, 2High Magnetic Field Laboratory, Hefei Institutes of Physical Science, Chinese Academy of Sciences, Shanghai, China
Synopsis
Keywords: Alzheimer's Disease, Alzheimer's Disease, fMRI; DTI; brain function and structure
Motivation: The early diagosis of Alzheimer's disease clinically using non-invasive techniques is important, find the relationship of brain structural and functional connectivity will helpful to diagnosing.
Goal(s): We used multimodal MRI technique to elucidate the differences between different ages of AD and WT mice and analyze the relationship between brain structure and brain function.
Approach: We used rs-fMRI to measure the functional connectivity, used DTI to measure the microstructure and structural connectivity of the brain.
Results: Our results showed higher structural connectivity causes higher functional connectivity, but in gustatory region, the functional connectivity had a negative correlation with structure.
Impact: Early diagnose is the important part to delay the progression of AD, the relationship of structural and functional connectivity is helpful to drug discovery. Our results suggest several potential early biomarkers for study in young versus old, humans and mice.
Introduction
Alzheimer’s disease (AD) causes cognitive decline with aging, hypothetically due to the accumulation of beta-amyloid (Aβ) plaques. Thus, it is important to provide a reference for early clinical diagnosis using imaging methods. The mouse model 3xTg-AD is increasingly used to study AD because it lacks major physical or behavioral deficiencies when young, but develops Aβ plaques and tau protein with age[1]. With aging, cognitive function declines, reflecting changes to the underlying brain structure[2]. As the increased deposition of Aβ is progressive throughout the adult lives of 3xTg-AD mice, a longitudinal study of networks across the whole brain is needed, especially as human AD patients have greatly altered brain networks[3].Determining the relationship between brain structural and functional connectivity can help researchers reveal the mechanisms of Alzheimer’s disease[4]. We studied structural-functional relationships using multimodal magnetic resonance imaging (MRI).Materials and methods
We used different age of AD and WT mice (22wk 3xTg-AD:10; 22wk WT:10; 40wk 3xTg-AD:10; 40wk WT:10). Diffusion tensor imaging (DTI), performed both in vivo and ex vivo, and resting-state functional magnetic resonance imaging (rs-fMRI) were on a 9.4T Bruker system. The mice were anesthetized with intraperitoneal bolus injections of 25% urethane dissolved in distilled water at the dosage of 0.7 ul/g.All MRI data are preprocessed and groups were compared using t-test and p values were corrected for multiple comparisons by sequential goodness of fit metatest (SGoF) for family-wise error rate (FWER).Results
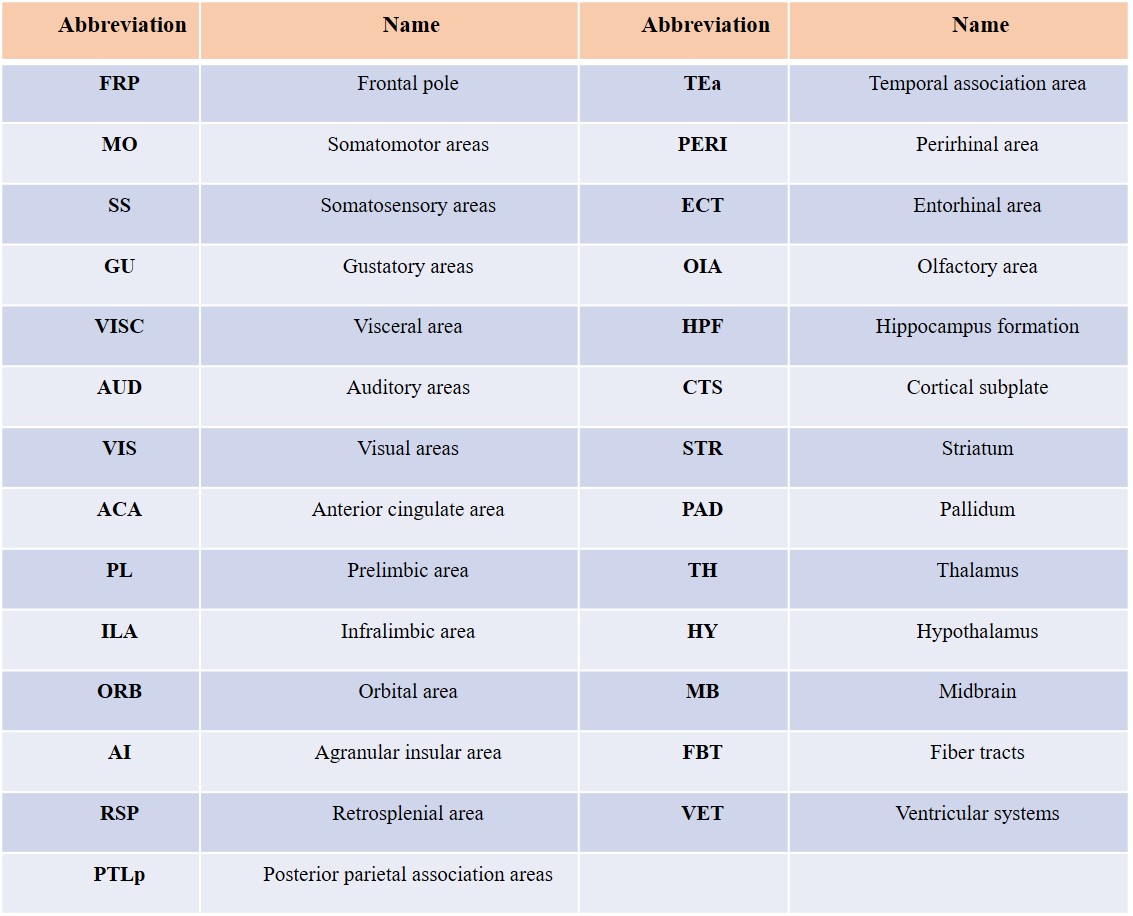
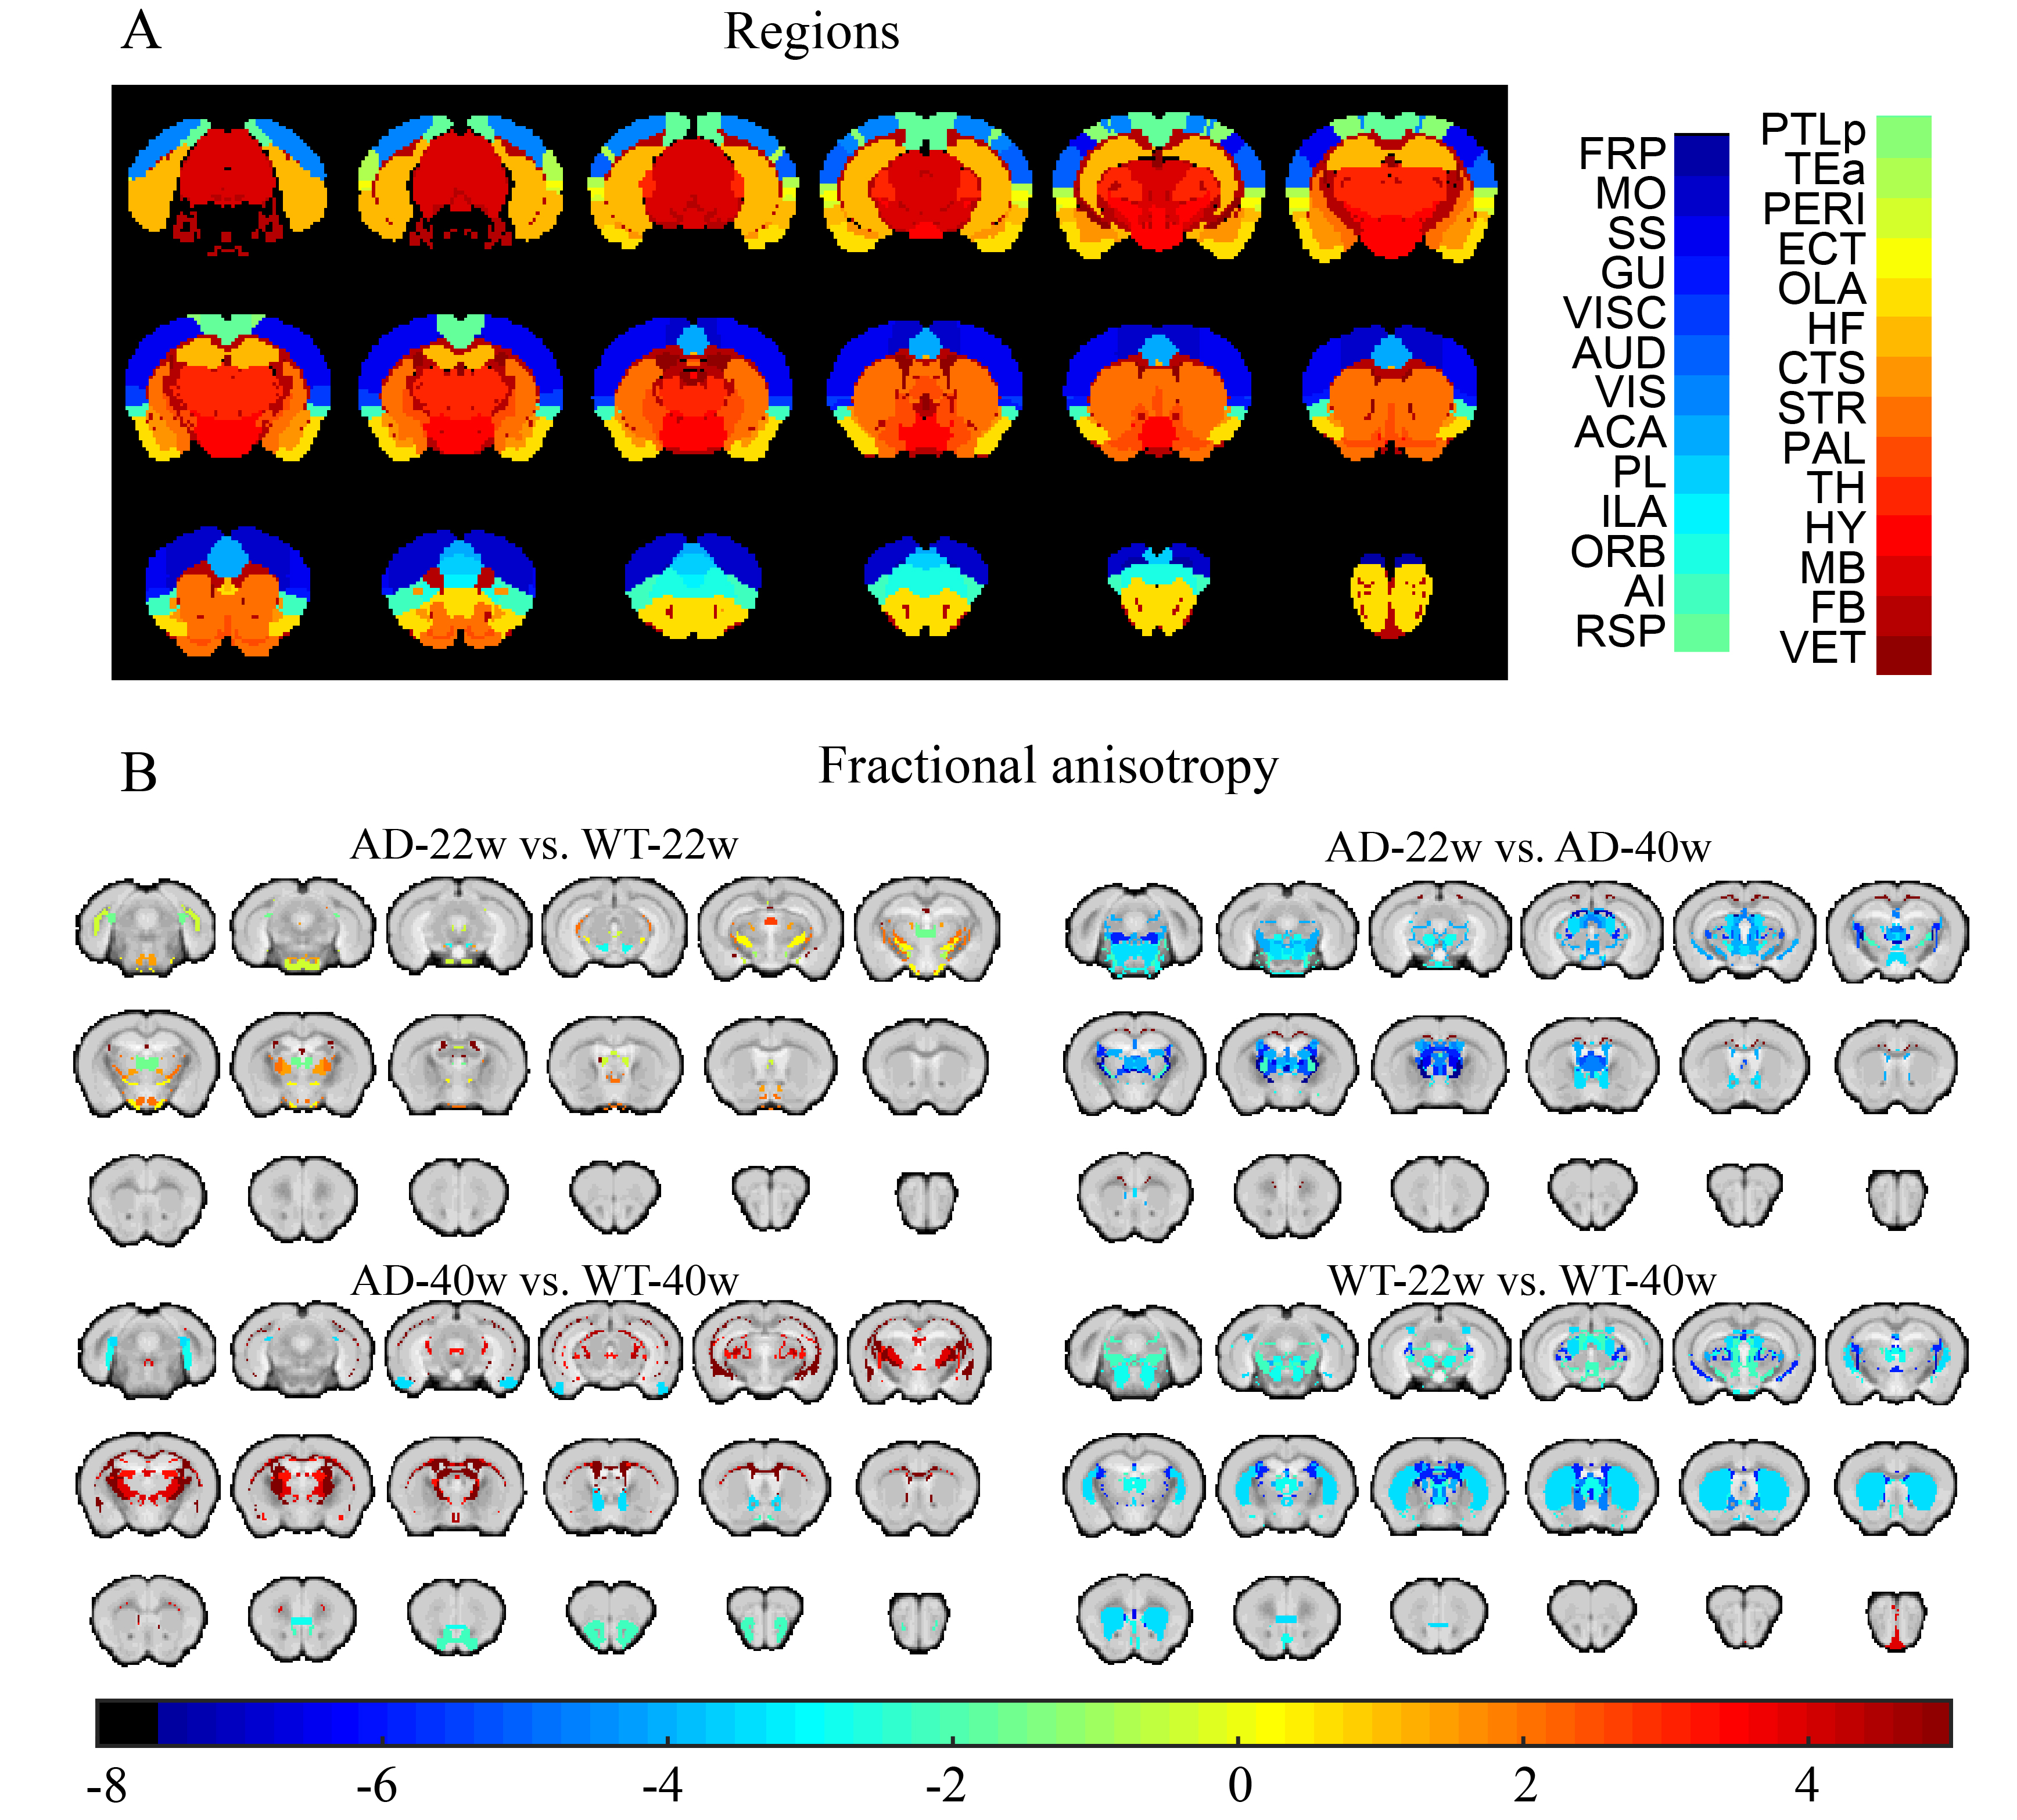
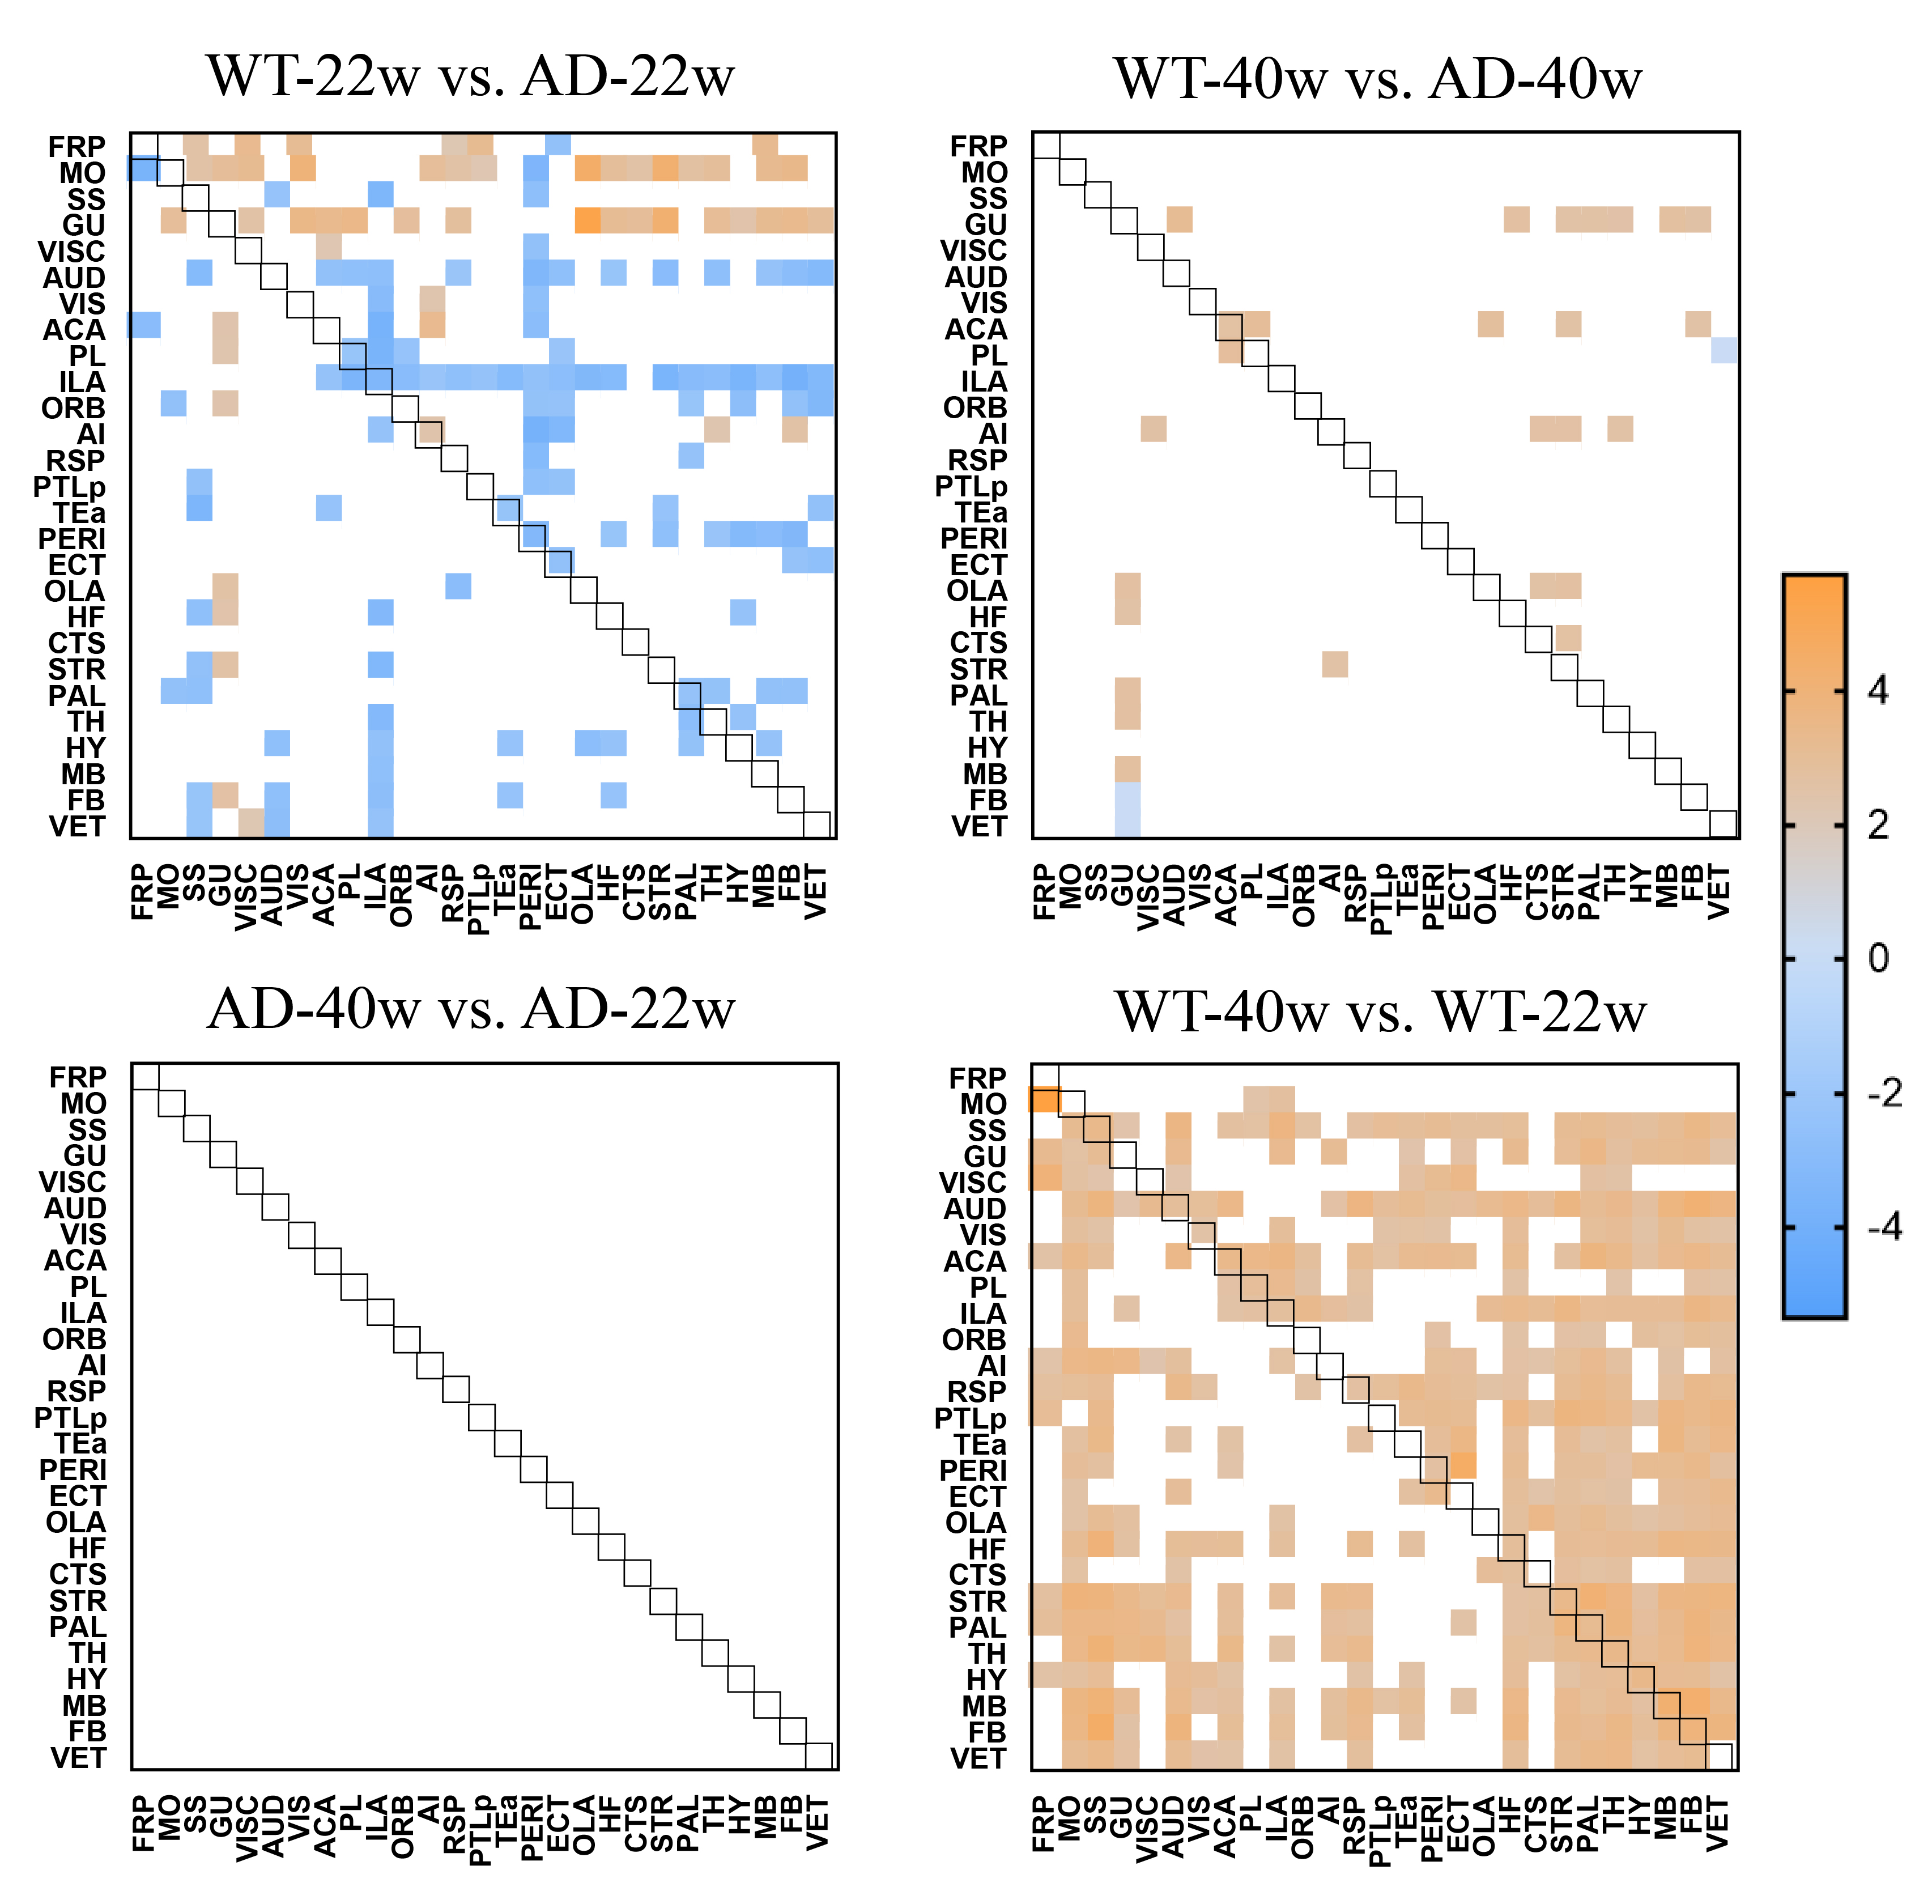
We used fractional anisotropy (FA) calculated from in vivo DTI to measure the brain’s structure. FA is the most commonly used DTI parameter and a non-specific biomarker of microstructural architecture and neuropathology, higher FA is correlated with higher integrity of myelin[5]. Compared at 22 weeks, the AD mice have higher FA than WT mice. Compared at 40 weeks, in neocortical and olfactory areas, WT mice have higher FA, in other regions, AD mice have higher. When 22 weeks is compared to 40 weeks for the same genotype, we found FA increased as age increased (Fig. 2).Calculated from fMRI, FC increased in normal mice from 22 weeks to 40 weeks, but this was not observed in AD mice (Fig. 3). At 22 weeks, there were brain regions of both higher and lower FC in AD mice versus WT mice. The FC higher regions in WT mice are all neocortical regions, others are lower in WT mice. At 40 weeks, only GU and AI of neocortical regions have significant FC decline with subcortical regions in AD mice.
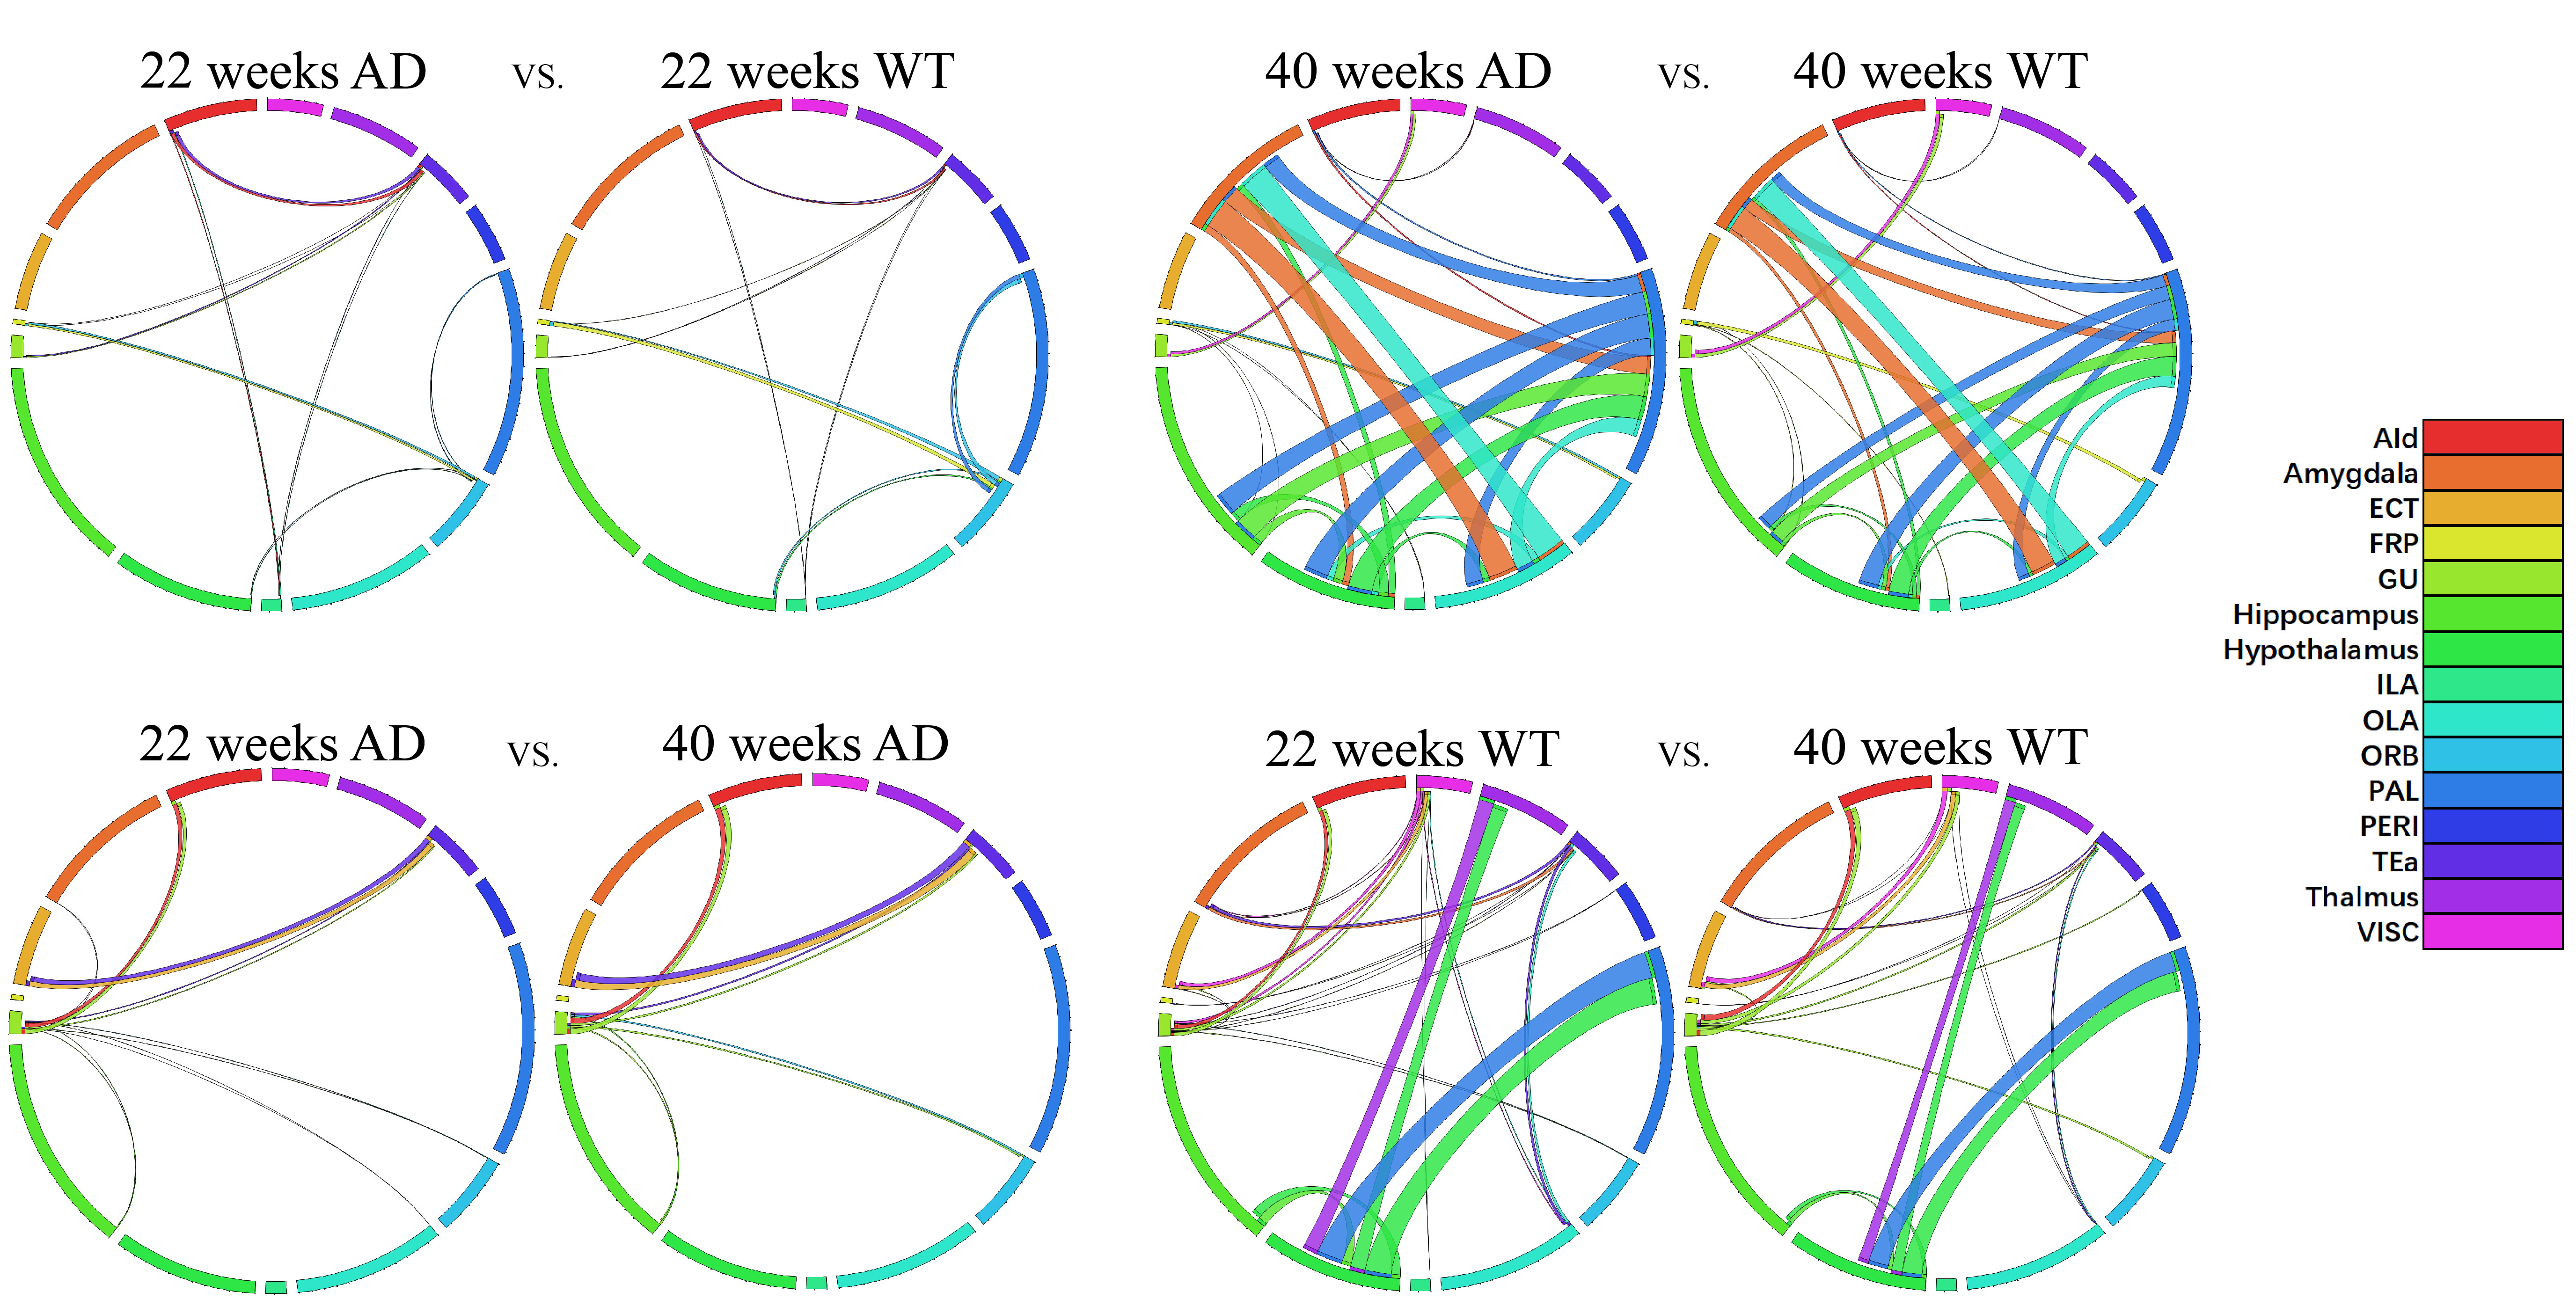
The ex vivo DTI results indicated that at 22 weeks, the SC changed in neocortical regions, only ORB have SC decreases with hypothalamus and PAL in AD mice. At 40 weeks, the SC of subcortical regions like hippocampus, hypothalamus, and PAL all increased in AD mice; the SC between neocortical regions all decreases in AD mice versus WT mice. All SC increased in AD mice as age increases, and the SC of hypothalamus decreased and other regions increased in WT mice as age increased (Fig. 4).
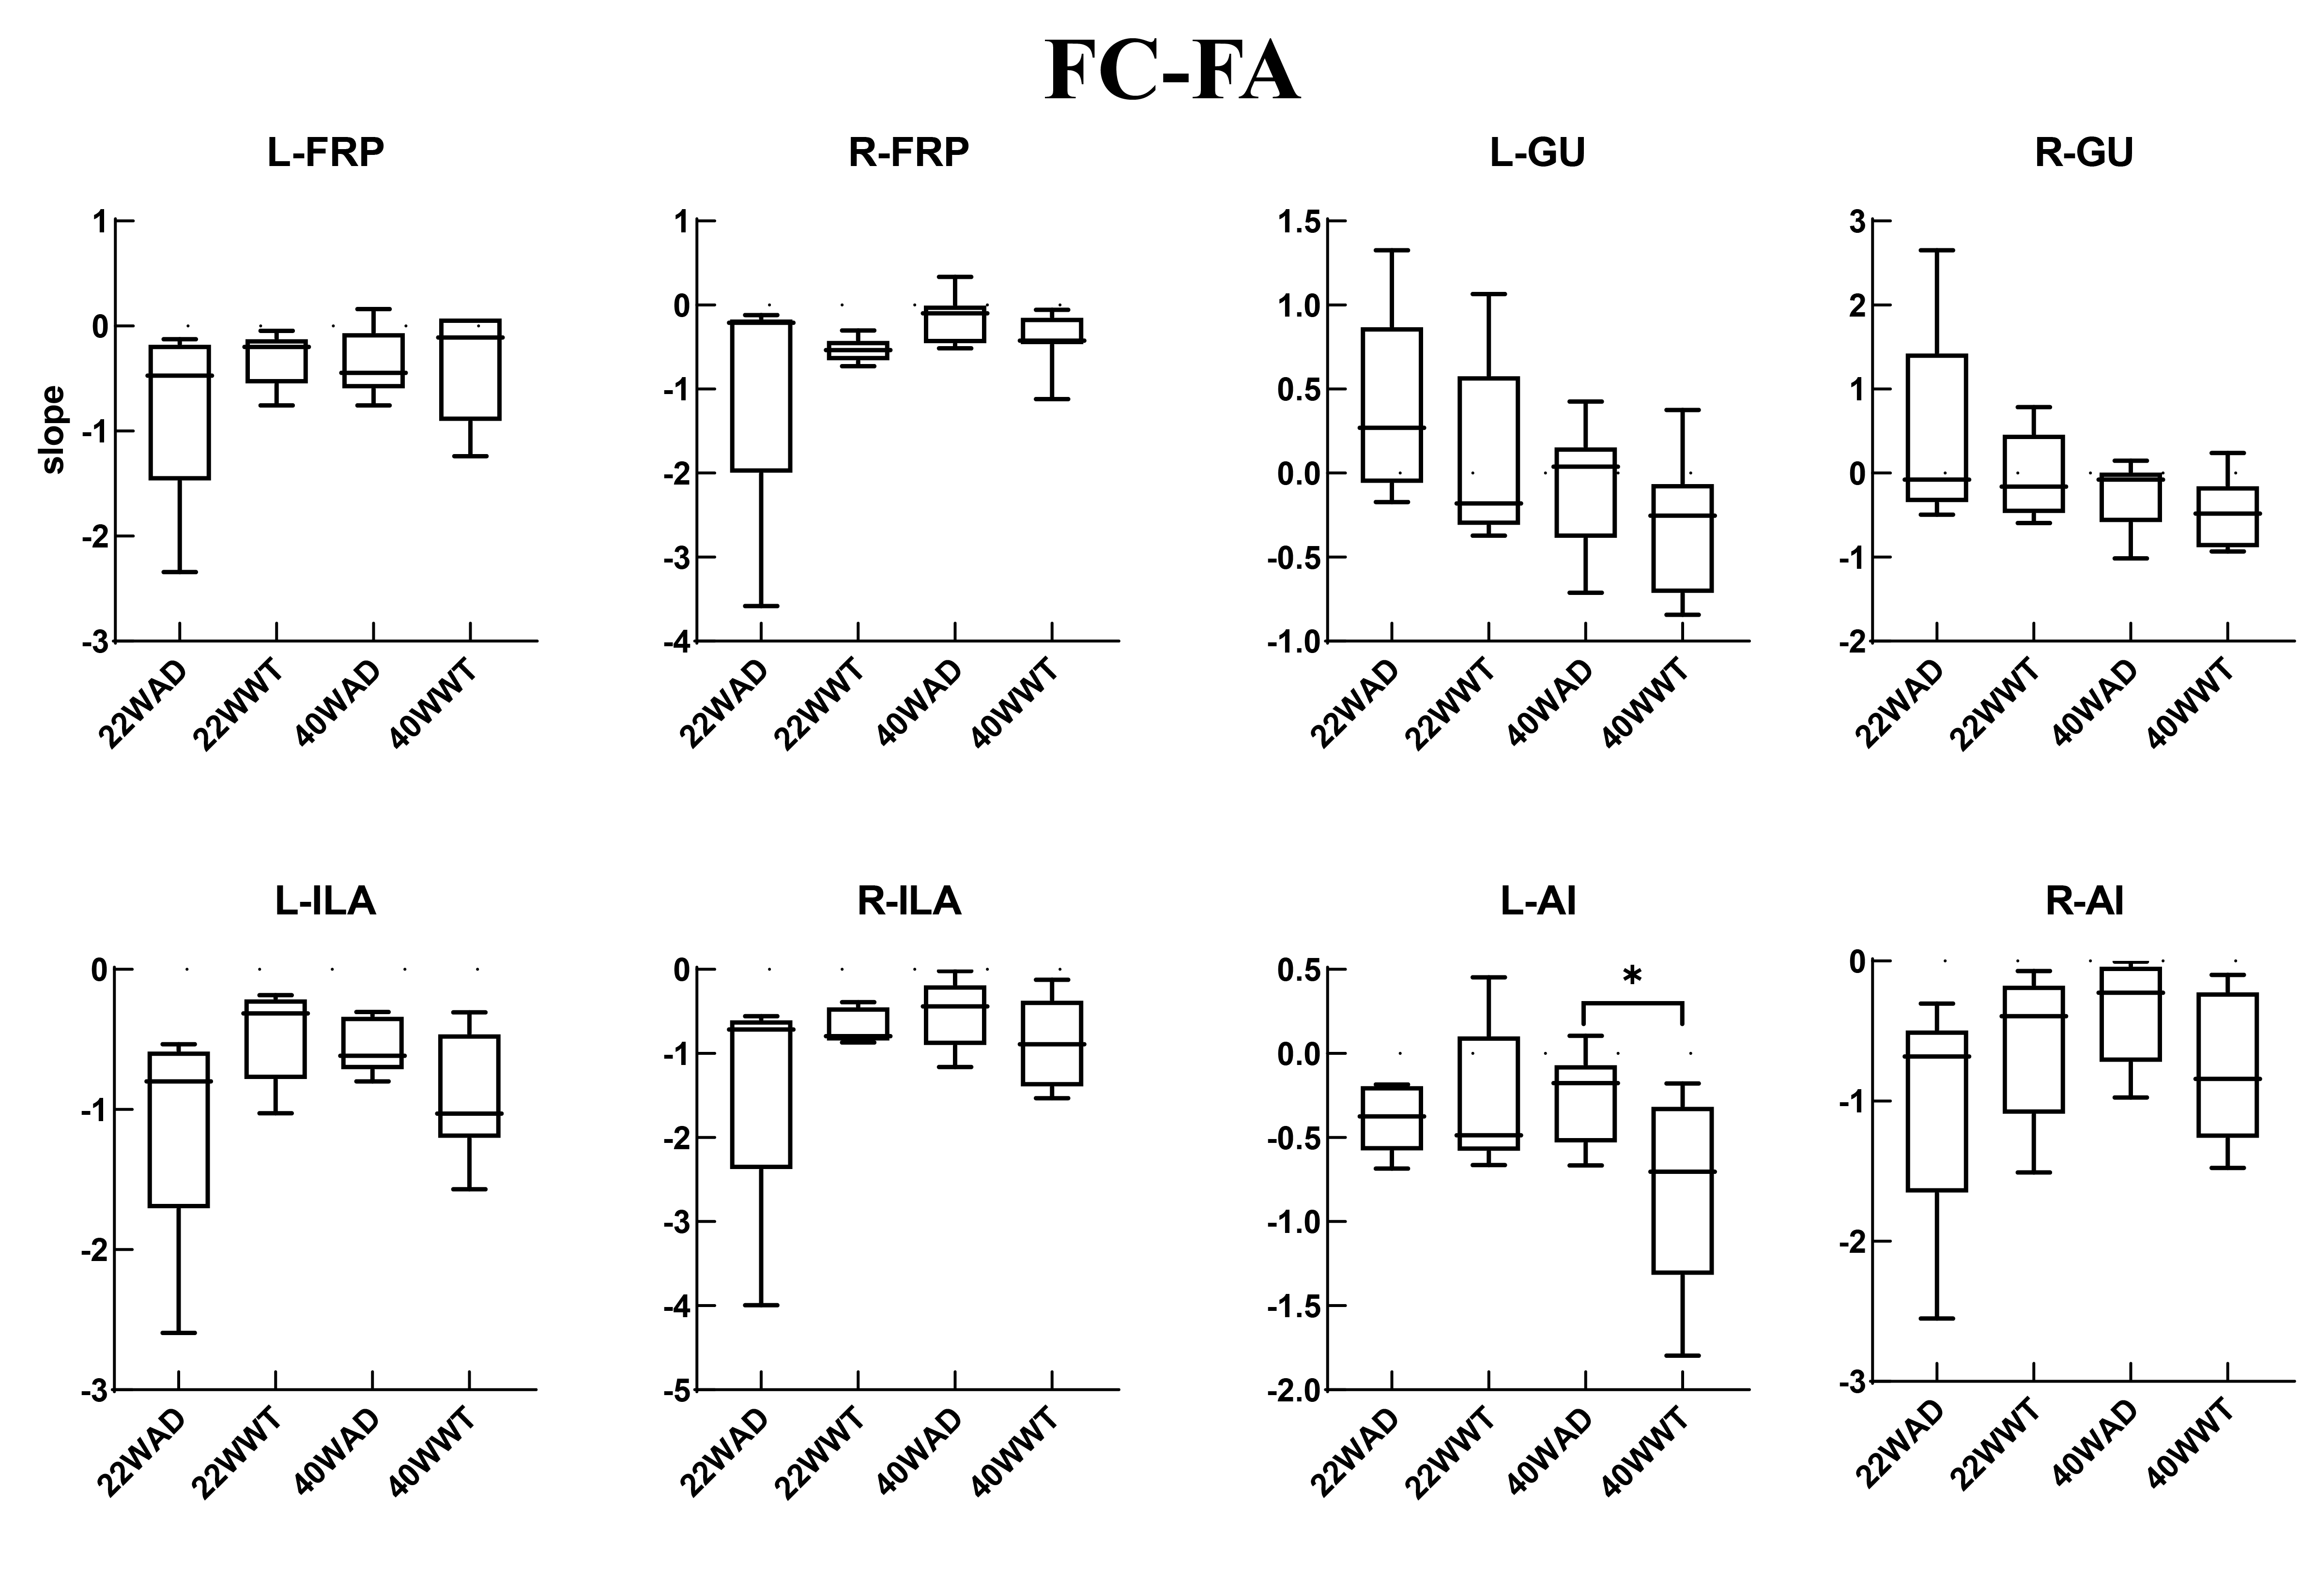
We chose certain cortical regions to test the relationship between FC and FA (Fig. 5). The results showed that different regions have different correlations. The results showed FRP, ILA, and AI had a negative correlation between FC and FA, and in GU regions, the slope of the linear regression decreases in WT mice and also as age increases.
Discussion
In subcortical regions where the FC of AD mice was higher than normal mice in 22 weeks, it may be due to a compensatory effect at the early stage due to the accumulation of Aβ plaques and tau protein aggregation in the AD mice. In neocortical regions of 22 weeks and the whole brain of 40 weeks where the FC of AD mice was lower than normal mice, this may because synapses are injured in AD mice [6, 7]. Our results of in vivo DTI and FC supports the hypothesis that there exists an indirect correlation[8, 9], and the indirect correlation is hard to detect. Because in AD mice, neuroinflammation will cause synapse loss. In conclusion, we demonstrated at early stages in 3xTg-AD mice, the neocortex displays altered structure and function earlier than subcortical regions. Our results showed that the GU region has a different structural/functional correlation than other cortical regions. As gustatory function declines in AD patients, this may be a biomarker for diagnosing AD at an early stage, and can help in drug discovery and further preclinical research.Acknowledgements
This work was finally supported by these grants: Collaborative Key Foundation of ShanghaiTech University, the Shanghai Municipal Government, National Natural Science Foundation of China Grant 81950410637 (GJT), Hefei Science Center Grant 2022HSC-CIP003 (QY), and Grant 3210055 (HL).
References
1. Oddo, S., et al., Triple-transgenic model of Alzheimer's disease with plaques and tangles:: Intracellular Aβ and synaptic dysfunction. Neuron, 2003. 39(3): p. 409-421.
2. da Silva, P.H.R., et al., Brain Structural-Functional Connectivity Relationship Underlying the Information Processing Speed. Brain Connectivity, 2020. 10(3): p. 143-154.
3. Dubois, B., et al., Timely Diagnosis for Alzheimer's Disease: A Literature Review on Benefits and Challenges. Journal of Alzheimers Disease, 2016. 49(3): p. 617-631.
4. Damoiseaux, J.S. and M.D. Greicius, Greater than the sum of its parts: a review of studies combining structural connectivity and resting-state functional connectivity. Brain Structure & Function, 2009. 213(6): p. 525-533.
5. Lochner, C., et al., Evidence for fractional anisotropy and mean diffusivity white matter abnormalities in the internal capsule and cingulum in patients with obsessive–compulsive disorder. Journal of Psychiatry & Neuroscience, 2012. 37(3): p. 193-199.
6. Nakamura, T., et al., Noncanonical transnitrosylation network contributes to synapse loss in Alzheimer's disease. Science, 2021. 371(6526): p. 253-+.
7. Rajendran, L. and R.C. Paolicelli, Microglia-Mediated Synapse Loss in Alzheimer's Disease. Journal of Neuroscience, 2018. 38(12): p. 2911-2919.
8. Koch, M.A., D.G. Norris, and M. Hund-Georgiadis, An Investigation of Functional and Anatomical Connectivity Using Magnetic Resonance Imaging. NeuroImage, 2002. 16(1): p. 241-250.
9. Straathof, M., et al., A systematic review on the quantitative relationship between structural and functional network connectivity strength in mammalian brains. Journal of Cerebral Blood Flow & Metabolism, 2019. 39(2): p. 189-209.
Figures