4023
Free-breathing simultaneous quantification of fat fraction, R2*, and T1 at 0.55T: Validation in a clinical cohort1Department of Radiology and Biomedical Imaging, University of California San Francisco, San Francisco, CA, United States, 2Department of Radiology, New York University Grossman School of Medicine, New York, NY, United States, 3Department of Radiology, Northwestern University Feinberg School of Medicine, Chicago, IL, United States
Synopsis
Keywords: Liver, Low-Field MRI
Motivation: Improve accessibility of MRI by measuring quantitative liver biomarkers at 0.55T.
Goal(s): Perform and validate free-breathing radial stack-of-stars for simultaneous measurement of liver fat fraction, R2*, and T1 on a 0.55T system in patients with chronic liver disease.
Approach: 11 subjects undergoing 3T MRI were offered a 0.55T examination. Fat fraction and R2* were compared at both field strengths. Composite T1 was compared to water-only T1.
Results: Fat fraction at 0.55T was highly correlated to 3T, with minimal bias and variance. R2* correlation did not achieve statistical significance. Composite T1 was linearly related to water-only T1.
Impact: Free-breathing simultaneous measurement of important liver biomarkers is achievable in a low-cost commercially available MRI system, which promises to help make the benefits of MRI more accessible to patients who need it.
Introduction
MRI has a crucial role in assessing chronic liver disease. Robust multi-echo methods at 1.5T and 3T permit measurement of fat fraction (FF), iron deposition (R2*), and native T11. To make MRI-based liver assessment more accessible and cost-effective, low-cost mid-field scanners at 0.55T have been developed. However, commercially-available 0.55T systems suffer from limited signal-to-noise ratio (SNR) and reduced gradient performance. These limitations render traditional breath-held multi-echo techniques for fat and iron quantification impractical. To address these challenges, a novel free-breathing radial stack-of-stars approach has been introduced2. This method enables simultaneous measurement of FF, R2*, and T1 in a single acquisition, overcoming problems associated with breath holding, which can be challenging for medically compromised patients or those with language barriers. In this pilot study, patients scheduled for clinical evaluation of chronic liver disease at 3T were also scanned at 0.55T using the free-breathing approach. Our hypothesis was that fat fraction at 0.55T would match that at 3T, R2* at 0.55T and 3T would exhibit a linear relationship, and composite T1 and water-only T1 would differ based on the underlying fat fraction.Methods
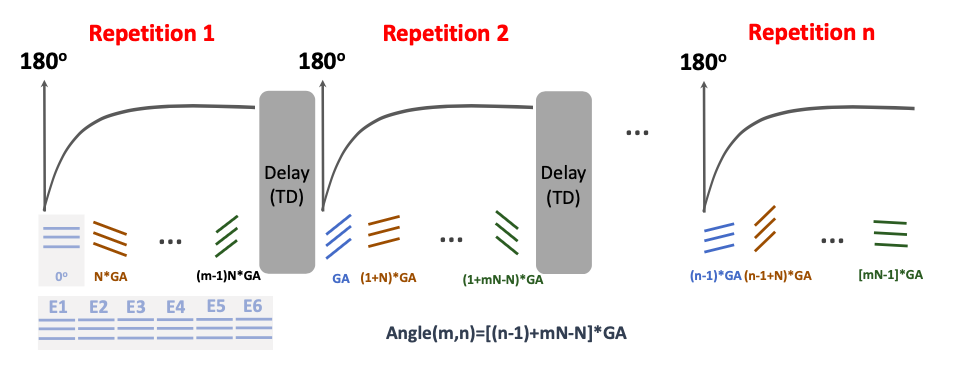
In this IRB-approved prospective study, patients scheduled to have clinically-indicated 3T examinations for chronic liver disease were approached and asked to undergo a 0.55T scan. 3T imaging was performed using a Signa Premier MR imager (GE Medical Systems), according to our chronic liver disease protocol that included commercially available sequence for quantifying proton density fat fraction and R2* (IDEAL-IQ). 0.55T imaging was performed on a MAGNETOM Free.Max (Siemens Healthineers) with an 80 cm bore. Each patient received a free-breathing GraspT1-Dixon acquisition, which consisted of inversion-recovery (IR)-prepared 3D golden-angle stack-of-stars sampling with advanced iterative reconstruction enforcing combined low-rank subspace and spatiotemporal sparsity constraints2. During data acquisition, the IR preparation was periodically applied, followed by multi-echo acquisition to achieve fat/water separation at different inversion times as shown in Fig. 1. This enabled simultaneous estimation of FF, R2*, composite T1 and water-only T1. Additional sequence parameters included: FOV 380x380 mm, matrix 192x192, in plane resolution 2x2 mm, slice number 16, slice thickness 5 mm, echo times 1.96, 4.11, 6.26, 8.41, 10.60, 12,7ms, TR 14.7ms, 40-repetitions with total imaging time of 5 minutes.A fellowship-trained abdominal radiologist analyzed each image by placing an ROI over the right hepatic lobe in the 3T and 0.55T images at identical locations. Mean and standard deviation were recorded. Analysis was performed using Prism 8.0 (Graphpad Inc) using linear regression and Bland-Altman analysis.
Results
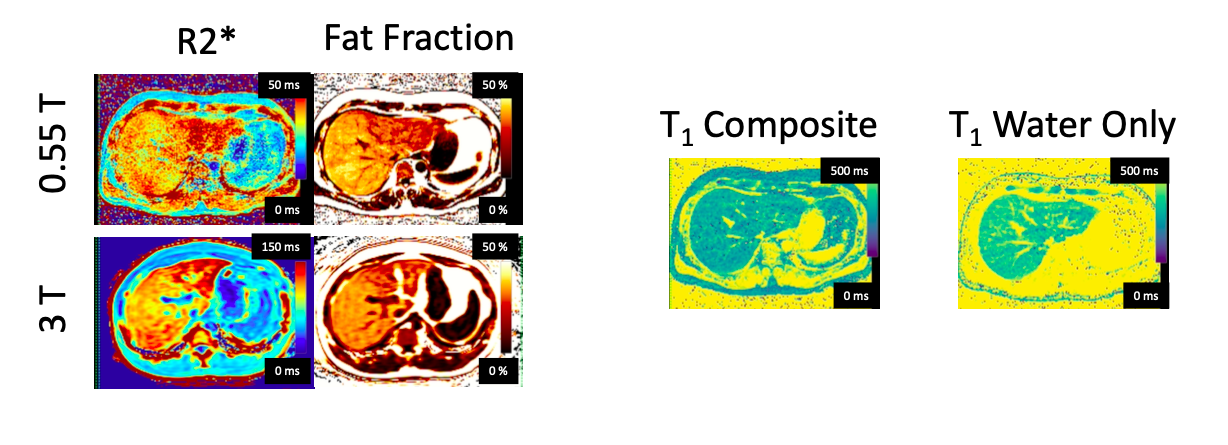
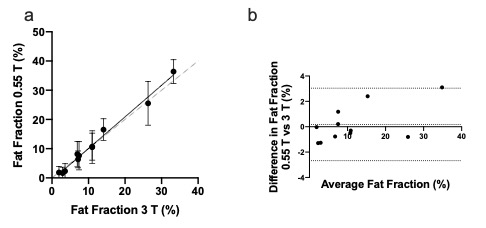
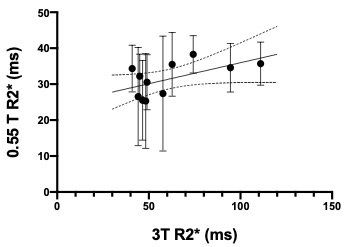
11 subjects were prospectively enrolled with median age 64 (range 41-69), 6/11 female. Median body mass index was 30.7 (range 25.8-41.6). Example quantitative images are shown in Figure 2. Fat fraction at 3T had range 1.9%-33.3%. Fat fractions at 3T and 0.55T were linearly correlated (p< 0.0001) with slope 1.08 (95%CI:0.99-1.17). Bland-Altman analysis revealed a bias of 0.17% and 95% limits of agreement from -2.6% to 3.1% (Figure 3).R2* at 3T had range 46.6-111 s-1. Linear regression of R2* at 3T and 0.55T yielded a slope of 0.055 (95%CI:-0.007-0.24, P = 0.06). Many of the R2* maps suffered from low signal-to-noise, as shown by the large error bars in Figure 4.
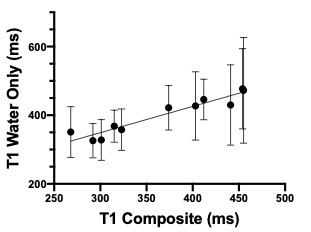
Composite T1, which includes the effects of fat and water, was consistently shorter than the fat-only T1, as expected. There was a linear relationship between the two T1 values, with a slope of 0.76 (95%CI 0.58-0.94, P < 0.0001) (Figure 5).
Discussion and Conclusion
We have implemented a method for free-breathing simultaneous measurement of FF, R2*, and T1 at 0.55T and tested it in patients with a broad range of FF, BMI, and R2* values. FF at 0.55T was in very high agreement with the 3T commercial sequence, with small bias and limits of agreement of approximately 3 fat percent units. We expected R2* at the two field strengths to be linearly related3. However, linear regression did not achieve statistical significance, likely due to the low SNR of the R2* maps at 0.55T. A larger range of R2* values above 100 s-1 is also required. We were able to generate water-only T1 maps without the confounding effects of fat. Native liver T1 is currently under investigation as a biomarker of liver injury4 and future studies will test the role of 0.55T-derived T1 values in these processes.By combining the cost savings of a mid-field MRI system and the robustness of free-breathing MRI, this method promises to improve the accessibility of MRI-based liver biomarker quantification.
Acknowledgements
No acknowledgement found.References
1. Guglielmo FF, Barr RG, Yokoo T, et al. Liver Fibrosis, Fat, and Iron Evaluation with MRI and Fibrosis and Fat Evaluation with US: A Practical Guide for Radiologists. RadioGraphics. 2023;43(6):e220181. doi:10.1148/rg.220181
2. Feng L, Liu F, Soultanidis G, et al. Magnetization‐prepared GRASP MRI for rapid 3D T1 mapping and fat/water‐separated T1 mapping. Magn Reson Med. 2021;86(1):97-114. doi:10.1002/mrm.28679
3. Hernando D, Zhao R, Yuan Q, et al. Multicenter Reproducibility of Liver Iron Quantification with 1.5-T and 3.0-T MRI. Radiology. October 2022:213256. doi:10.1148/radiol.213256 \
4. Dekkers IA, Lamb HJ. Clinical application and technical considerations of T 1 & T 2 (*) mapping in cardiac, liver, and renal imaging. BJR. 2018;91(1092):20170825. doi:10.1259/bjr.20170825
Figures