4022
Investigating Respiratory Cycle-Dependent B0 in Liver MRI at 3T1TUM School of Medicine, Technical University Munich, Munich, Germany, 2Helmholtz Center Munich, Munich, Germany, 3Philips GmbH Market DACH, Hamburg, Germany, 4School of Computation, Information and Technology, Technical University Munich, Munich, Germany
Synopsis
Keywords: Liver, Liver, Motion Correction
Motivation: Respiratory motion disturbs the stability of the primary magnetic field (B0), leading to potential image artifacts. Despite the significant influence of respiratory motion on B0, understanding these variations in the liver remains understudied in quantitative MRI.
Goal(s): To provide a comprehensive analysis of respiration-induced B0 variations in the liver.
Approach: The study used direct simulations, acquisition simulations followed by reconstruction, and in vivo scans to quantify B0 variations in the liver.
Results: Maximal temporal fieldmap variations were subject dependent and showed a mean variation in the order of 24.9 Hz across the respiratory cycle in the region close to the liver-diaphram interface.
Impact: This research provides a clearer understanding of respiratory motion effects on MRI, particularly in the liver. These insights could lead to improved image clarity for quantitative imaging.
Introduction
Magnetic Resonance Imaging (MRI) is susceptible to motion, especially respiratory-induced movements, which can disrupt the stability of the B0 field, affecting image quality [1]. While there are strategies to reduce motion artifacts, the uniformity of the B0 field is crucial in quantitative MRI. Field inhomogeneities can arise from hardware imperfections or from tissue variations in magnetic susceptibility. Respiratory motion, in particular, has been shown to significantly influence the B0 field in areas like the breast [2,3] and brain [4-7]. For organs like the liver, understanding respiratory motion induced B0 variations is essential especially in quantitative MRI, including relaxometry and fat fraction mapping. This study seeks to analyze respiration-induced B0 changes in the liver at 3T.Methods
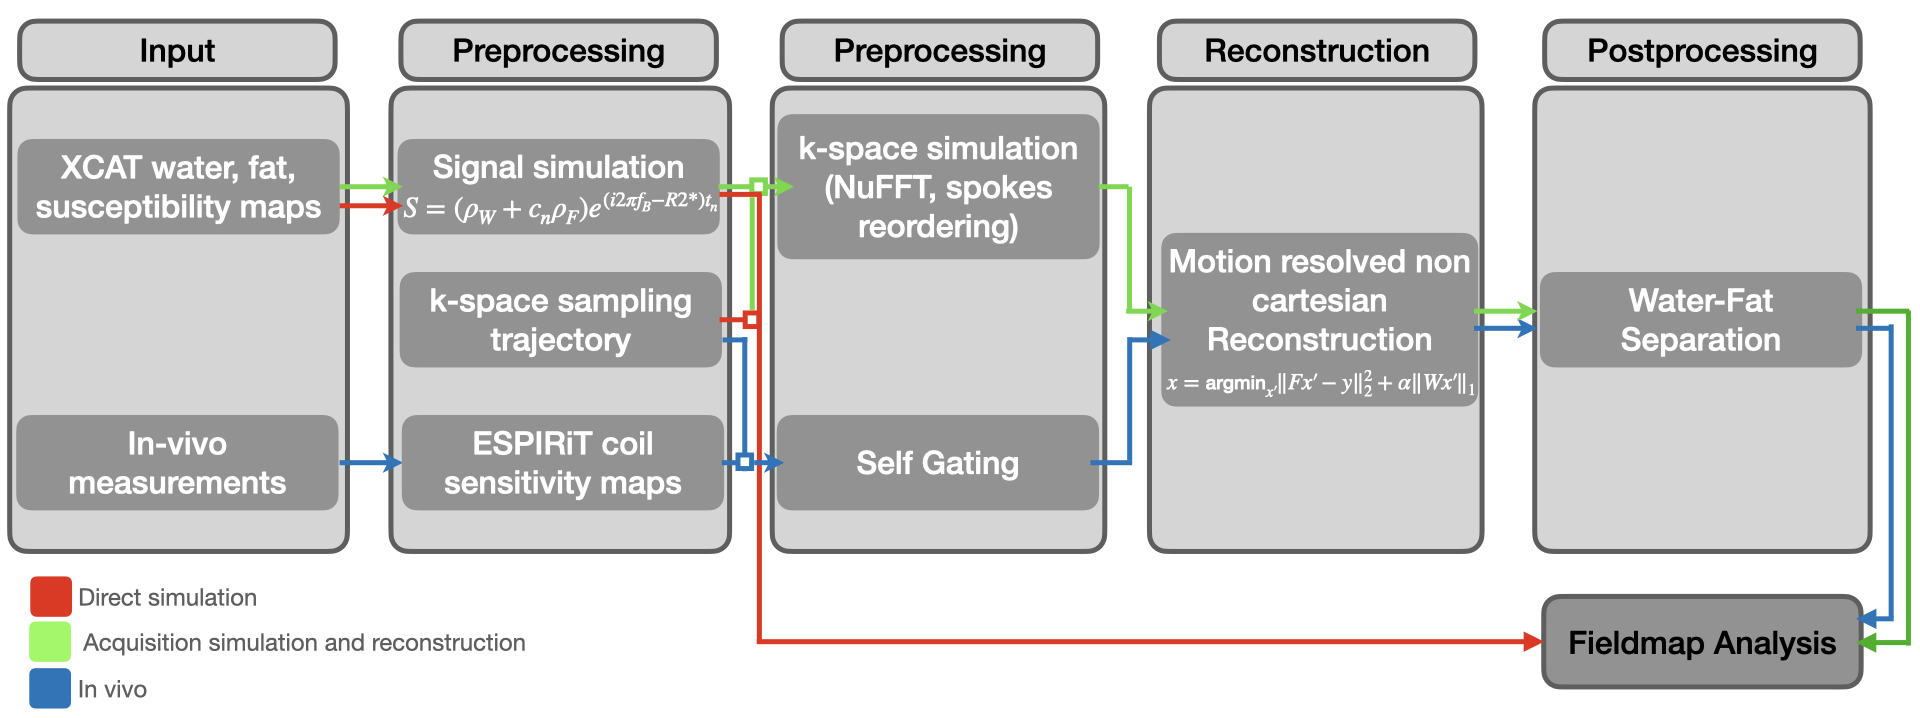
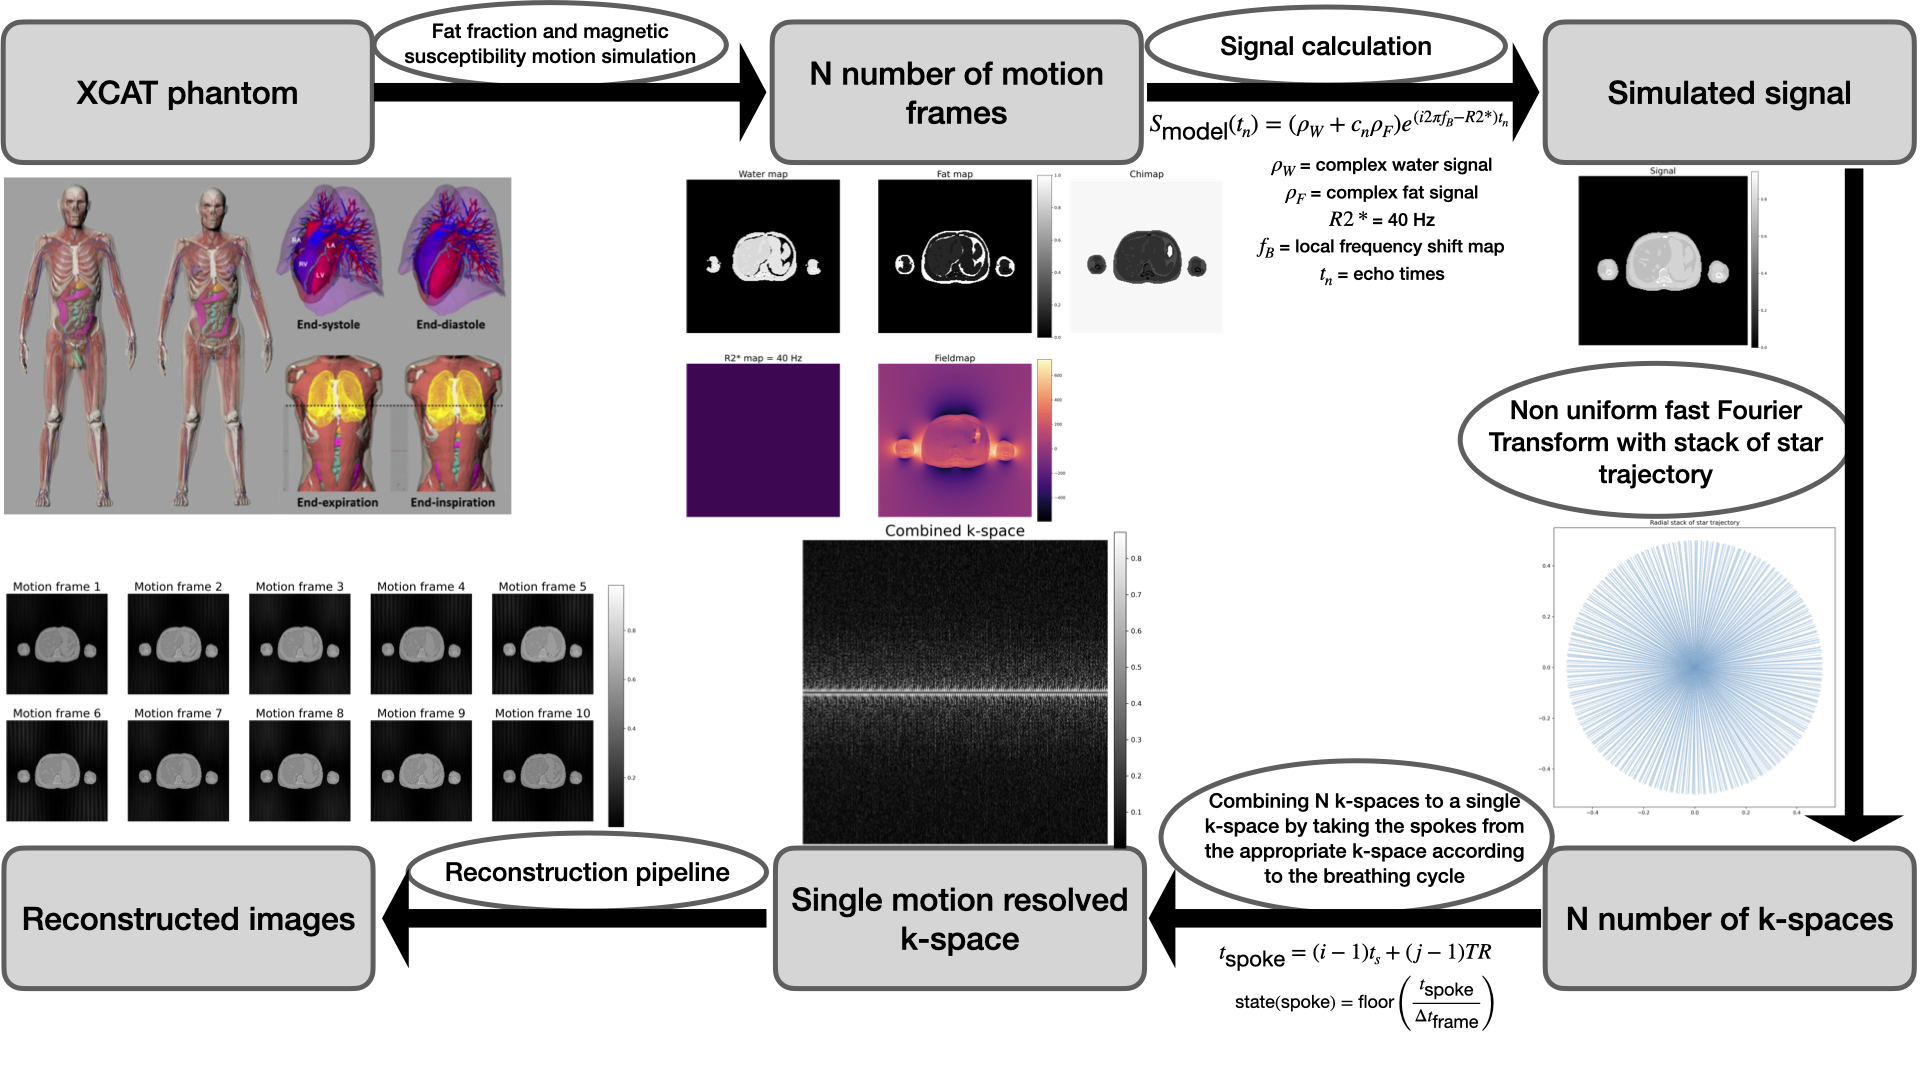
Three different B0 inhomogeneity analysis methods (direct simulation, acquisition simulation and reconstruction and in vivo) were employed (Figure 1). The XCAT [8] phantom's flexibility was used to define imaging parameters like respiratory cycle duration, motion frames number, field of view, and image resolution, which allows for realistic imaging scenarios simulation. For our study, five motion states over a 5-second respiratory cycle, typical for adult breathing, were selected [9].Numerical phantom maps for fat, water, and magnetic susceptibility were constructed to simulate MRI scenarios. The fat fraction map was derived from volunteer scans, and water map based on proton density with values from [10,11], and [12]. Magnetic susceptibility map values were from [10] and [12], simulating local magnetic field variations in the phantom. The signal equation incorporating these values is as follows:
$$s_{\text{model}}(t_n) = (\rho_W + c_n \rho_F)e^{\gamma t_n}, \quad \gamma = i2\pi f_B - R_2^*, \quad c_n = \sum_{p=1}^P a_p e^{i2\pi\Delta f_p t_n}, \quad \text{with} \quad \sum_{p=1}^P a_p = 1$$
Post signal computation, the Non-uniform Fast Fourier Transform (NUFFT) [13] was used to convert the signal to k-space. This accounts for the non-cartesian k-space grid from radial sampling. We then combined these to mimic actual scan procedures.
Spokes were extracted from the N k-spaces based on the respiratory cycle for the simulation, with the acquisition time for a given spoke calculated as:
$$t_{\text{spoke}} = k_{\text{z, current idx}} \cdot t_{\text{shot}}.$$
In vivo measurements:
In vivo imaging was conducted, using a Philips Ingenia 3T MRI scanner and a spoiled gradient echo sequence with T1 weighting. The reconstruction process for in vivo data mirrored the simulated data, with additional complexities from the multiple coils used.
Reconstruction:
To combine data from all coils, we employed the ESPIRiT method [14] to compute coil sensitivity maps. Eddy current corrections were made to remove trajectory-dependent frequency oscillations.
Autocalibration regions in vivo integrate information from multiple coils, represented as spokes. Data is binned based on motion states, segregated into distinct k-spaces, and reconstructed using L1 wavelet regularization and temporal Total Variation (TV) regularization.
Water fat separation:
Water fat separation was performed on the reconstructed images using a multi-resolution single min graph cut algorithm incorporated in [15,16]
Results
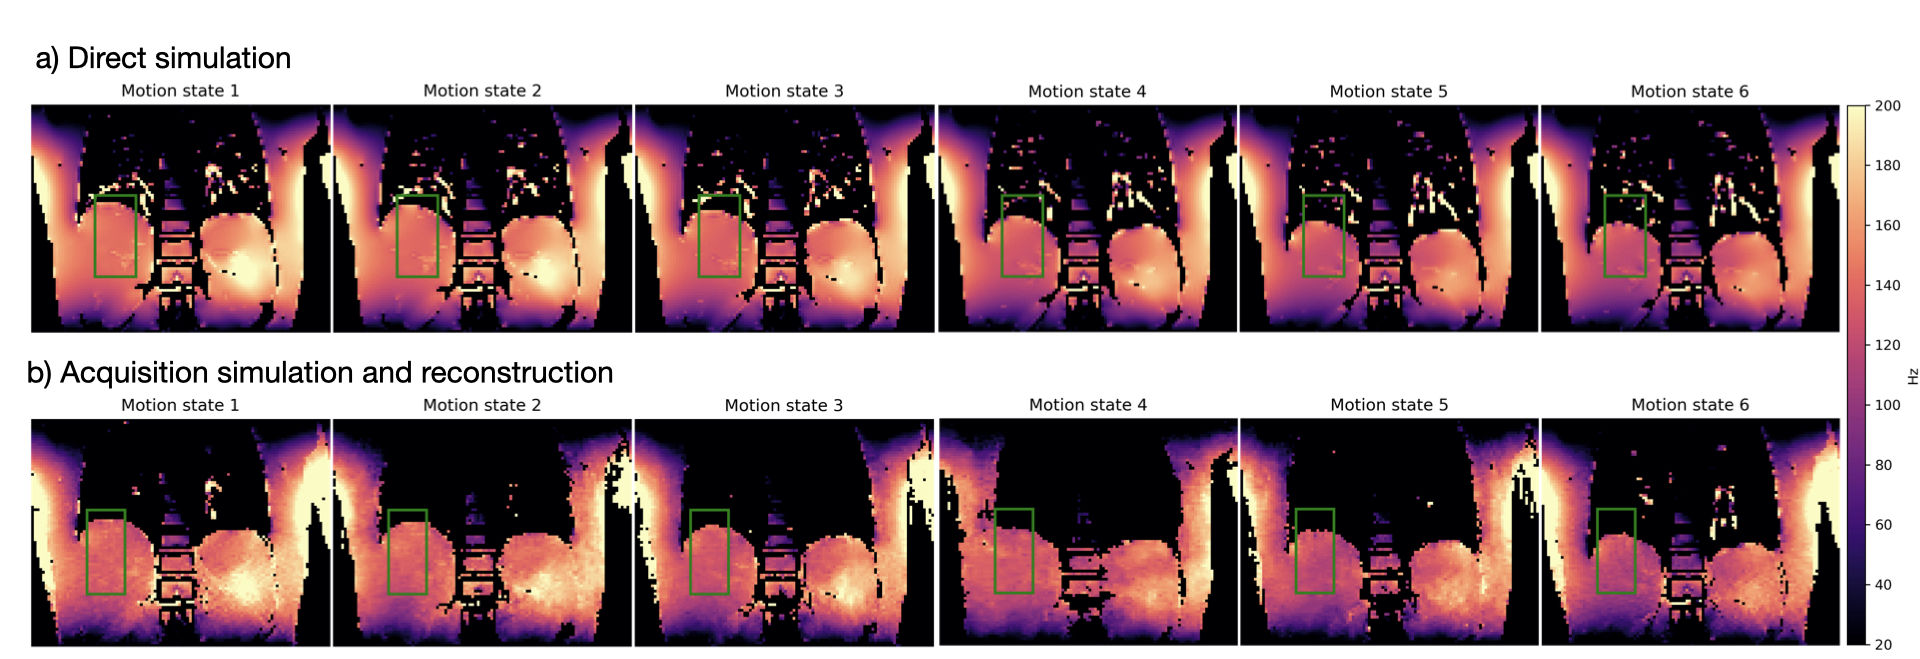
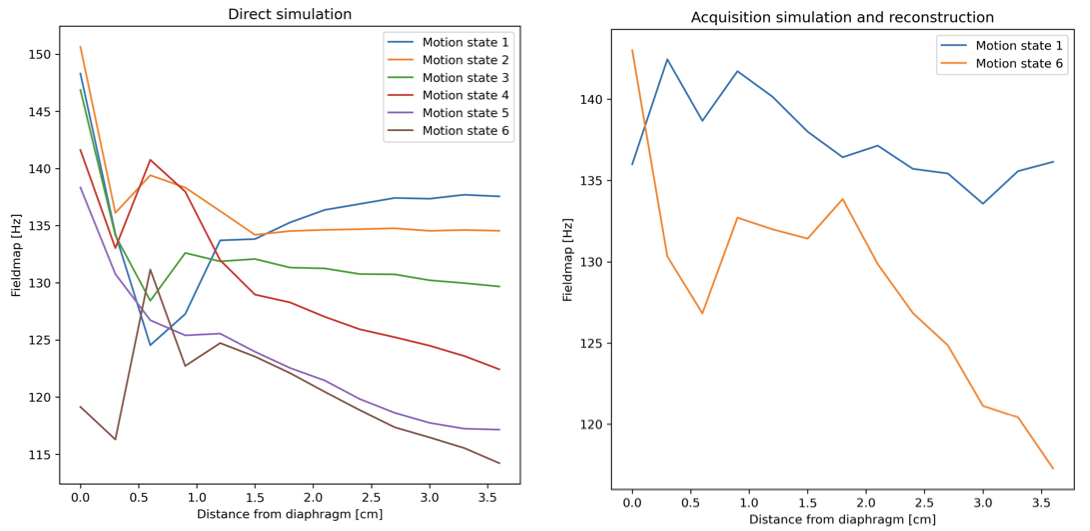
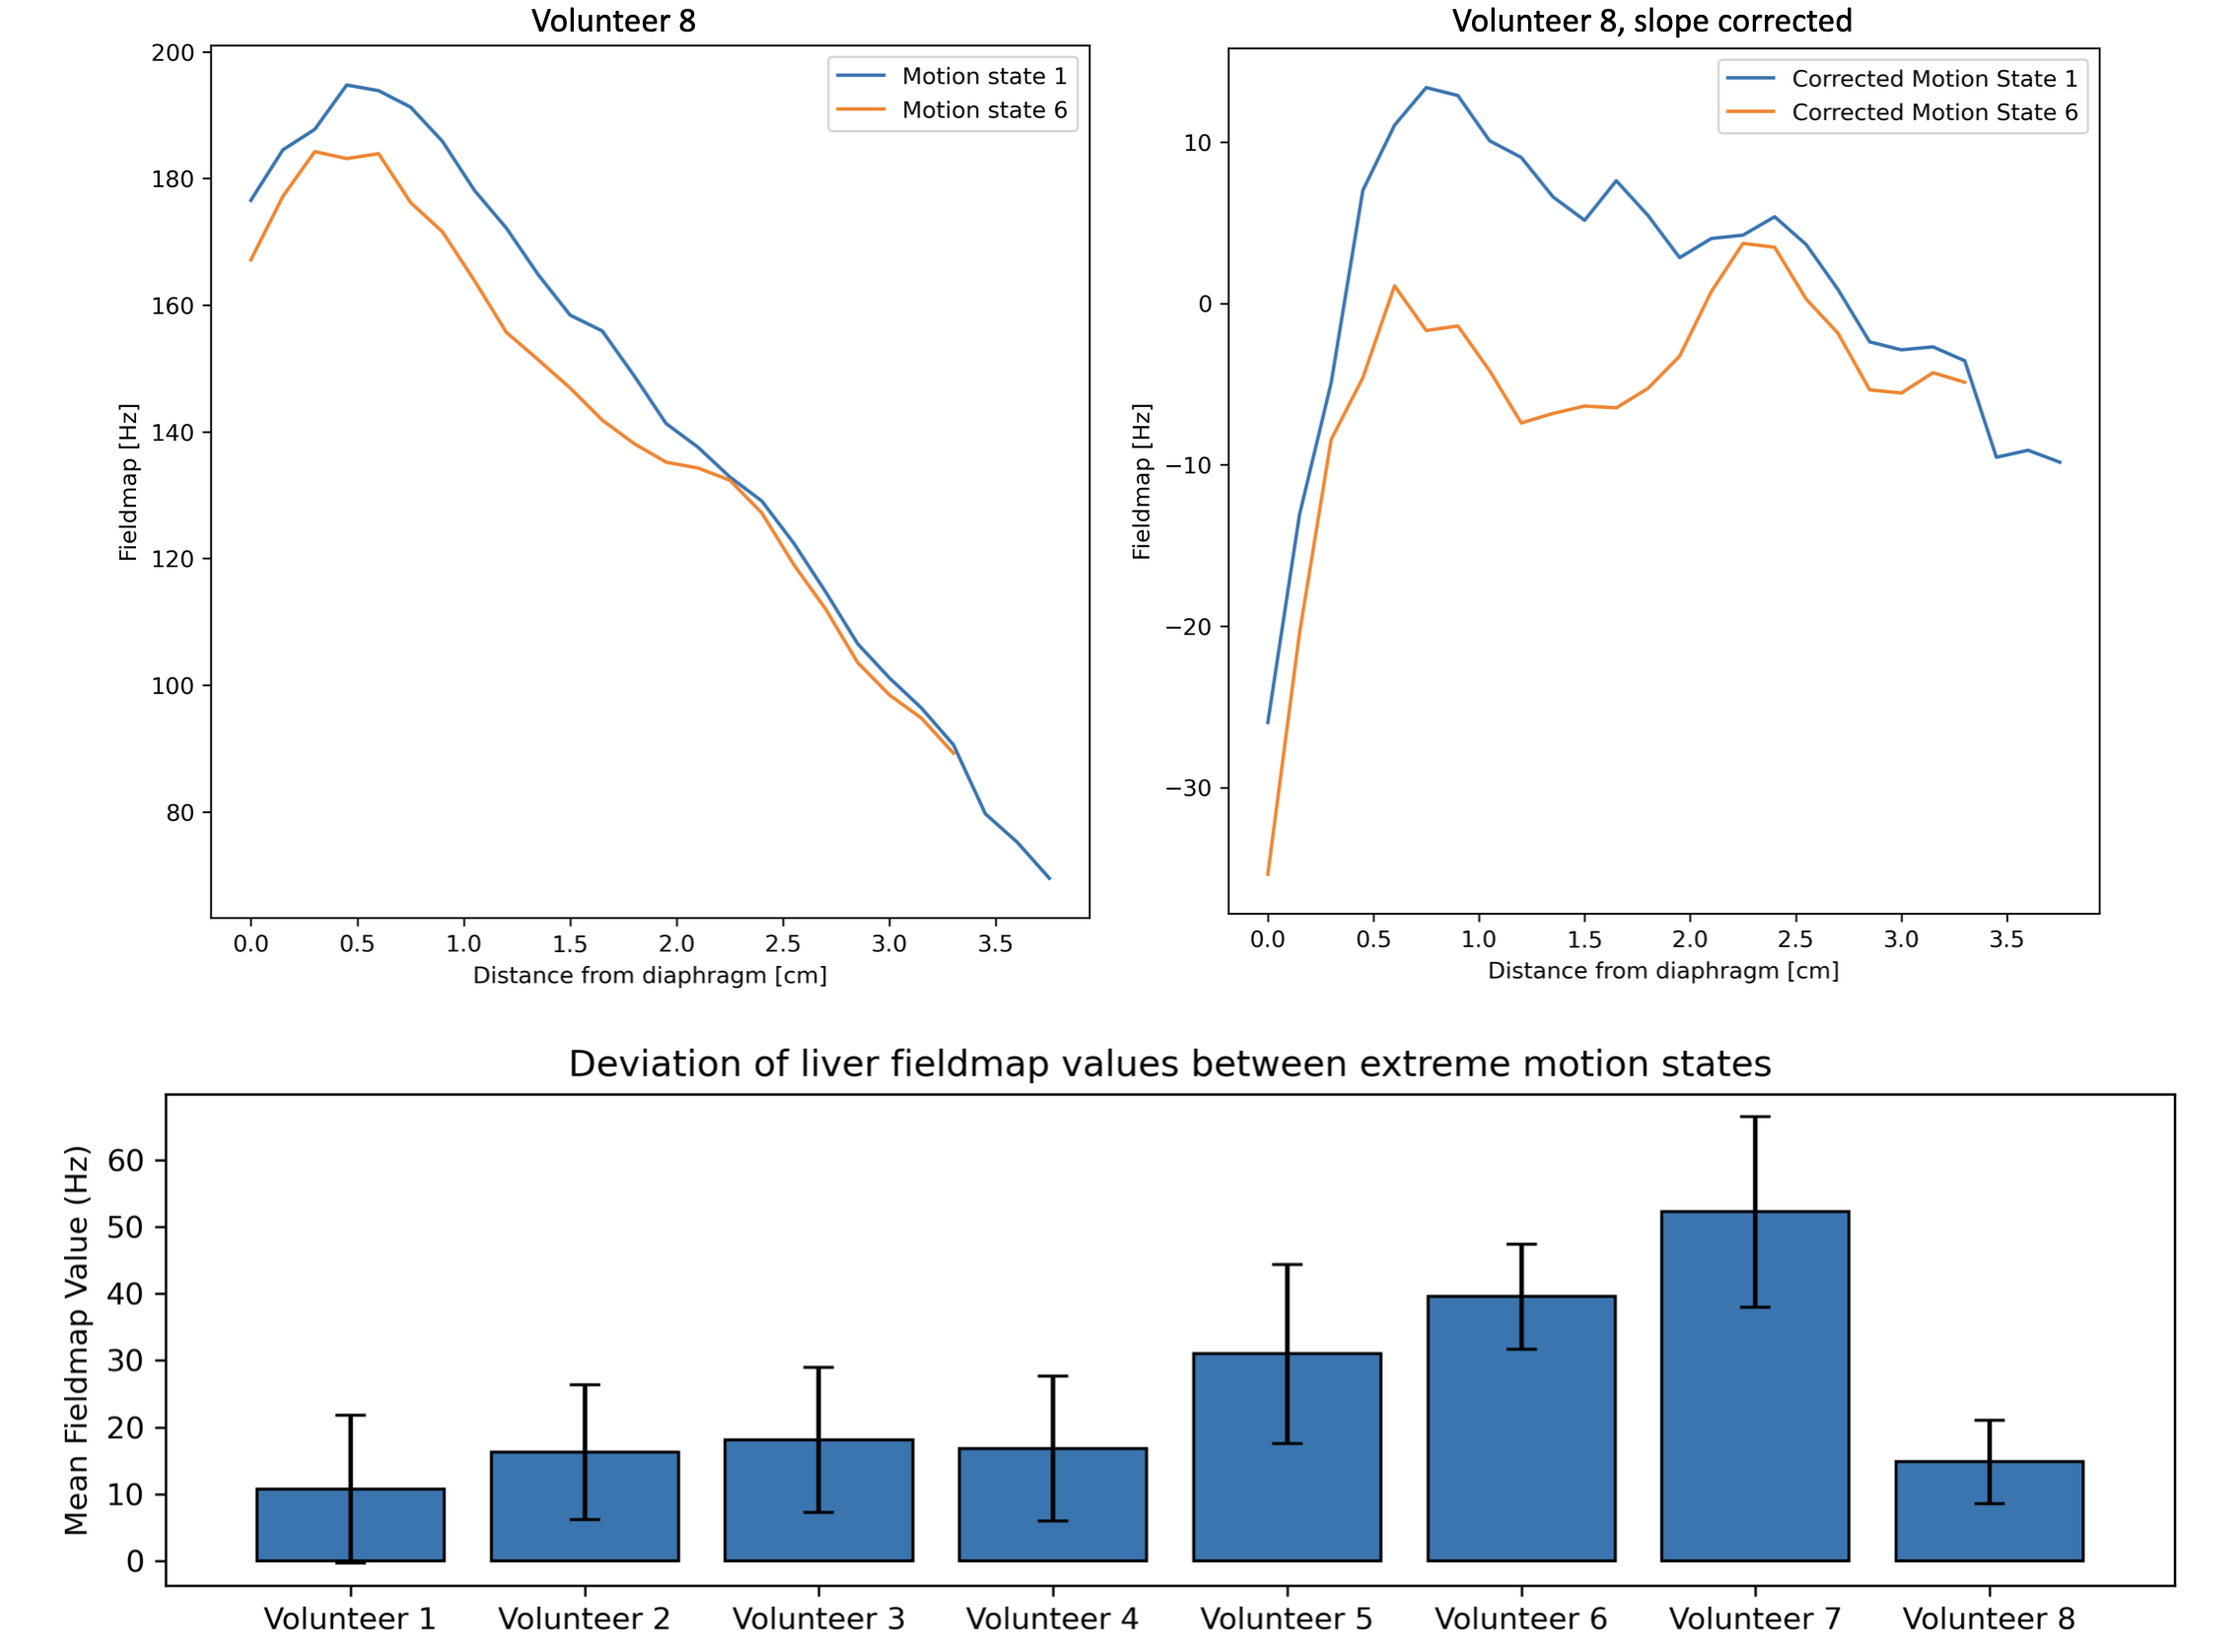
Figure 3 shows changes in the field-map values close to the liver-lung interface at the different motion states in both the direct simulation and the acquisition simulation and reconstruction. The line plots of Figure 4 highlight the largest variation of the field-map across motion states next to the liver-lung interface in simulations.Figure 5 shows similar strong variations of the field-map across motion states next to the liver-lung interface in vivo (Fig. 5a and 5b). Maximal temporal fieldmap variations throughout the respiratory cycle are subject dependent (Fig. 5c) with a mean of 24.9 Hz and a standard deviation of 10.6 Hz across subjects.Discussion
The observed maximal temporal fieldmap variation of 24.9 Hz is significantly longer than respiratory motion-induced B0 fluctuations previously reported in brain and breast. The findings are reinforced by computational simulations, which reveal that there is a pronounced variability in B0 fieldmaps near the diaphragm during respiratory cycles, diminishing deeper within the liver. This contradicts the conventional assumption of a static fieldmap.Methodological contributions of this study include the development of a comprehensive framework for analyzing respiratory motion-induced B0 variations and providing detailed insights into the magnitude of these variations, averaging at $$$(24.9\pm 10.6)$$$ Hz. Despite individual anatomical variances, a consistent pattern of fieldmap fluctuations during extreme respiratory phases is evident.
Acknowledgements
The present work was supported by the TUM International Graduate School of Science and Engineering (TUM-ICL Joint Academy of Doctoral Studies). The authors also acknowledge research support from Philips Healthcare.References
[1] M Zaitsev, J Maclaren, and M Herbst. Motion artifacts in mri: A complex problemwith many partial solutions. Journal of Magnetic Resonance Imaging, 42(4):887–901,Oct 2015. Epub 2015 Jan 28.8
[2] N. H. G. M. Peters, L. W. Bartels, F. Lalezari, K. L. Vincken, J. L. Verwoerd,W. P. Th. M. Mali, and C. J. G. Bakker. Respiratory and cardiac motion-inducedb0 fluctuations in the breast: Implications for prfs-based temperature monitoring.In AIP Conference Proceedings, volume 829, pages 81–85, May 2006.
[3] Patrick J. Bolan, Pierre-Gilles Henry, Eva H. Baker, Sina Meisamy, and MichaelGarwood. Measurement and correction of respiration-induced b0 variations in breast1h mrs at 4 tesla. Magnetic Resonance in Medicine, 52(6):1239–1245, 2004.
[4] PF Van de Moortele, J Pfeuffer, GH Glover, K Ugurbil, and X Hu. Respiration-induced b0 fluctuations and their spatial distribution in the human brain at 7 tesla.Magnetic Resonance in Medicine, 47(5):888–895, May 2002.
[5] Damien A. Fair, Oscar Miranda-Dominguez, Abraham Z. Snyder, Anders Perrone,Eric A. Earl, Andrew N. Van, Jonathan M. Koller, Eric Feczko, M. Dylan Tisdall,Andre van der Kouwe, Rachel L. Klein, Amy E. Mirro, Jacqueline M. Hampton,Babatunde Adeyemo, Timothy O. Laumann, Caterina Gratton, Deanna J. Greene,Bradley L. Schlaggar, Donald J. Hagler, Richard Watts, Hugh Garavan, Deanna M.Barch, Joel T. Nigg, Steven E. Petersen, Anders M. Dale, Sarah W. Feldstein-Ewing,Bonnie J. Nagel, and Nico U.F. Dosenbach. Correction of respiratory artifacts inmri head motion estimates. NeuroImage, 208:116400, 2020.
[6] OF Oran, LM Klassen, H Serrai, and RS Menon. Demonstration and suppressionof respiration-related artifacts in bloch-siegert shift-based b1+ maps of the humanbrain. NMR Biomed, 33(7):e4299, Jul 2020. Epub 2020 Mar 26.
[7] Mads Andersen, Kristoffer Hougaard Madsen, Lars G. Hanson, Vincent OltmanBoer, Tijl A. van der Velden, Dennis W. J. Klomp, Joep Wezel, Matthias J. P. vanOsch, and Maarten J. Versluis. Mapping and correcting respiration-induced fieldchanges in the brain using fluorine field probes. 2014.
[8] W. P. Segars, G. Sturgeon, S. Mendonca, Jason Grimes, and B. M. W. Tsui. 4DXCAT phantom for multimodality imaging research. Medical physics, 37(9):4902–4915, September 2010. Place: United States.
[9] C Chourpiliadis and A Bhardwaj. Physiology, respiratory rate, Sep 12 2022. Available from: StatPearls [Internet]. Treasure Island (FL): StatPearls Publishing; 2023Jan.
[10] PA Hasgall, F Di Genanaro, C Baumgartner, E Neufeld, B Lloyd, MC Gosselin,D Payne, A Klingenböck, and N Kuster. It’is database for thermal and electromag-netic parameters of biological tissues. Feb 2022.
[11] Christopher M. Collins, Bei Yang, Qing X. Yang, and Michael B. Smith. Numericalcalculations of the static magnetic field in three-dimensional multi-tissue models ofthe human head. Magnetic Resonance Imaging, 20(5):413–424, 2002.
[12] Nimrod Maril, Christopher M. Collins, Robert L. Greenman, and Robert E. Lenk-inski. Strategies for shimming the breast. Magnetic Resonance in Medicine,54(5):1139–1145, 2005.
[13] J.A. Fessler and B.P. Sutton. Nonuniform fast fourier transforms using min-maxinterpolation. IEEE Transactions on Signal Processing, 51(2):560–574, 2003.
[14] Martin Uecker, Peng Lai, Mark J Murphy, Patrick Virtue, Michael Elad, John MPauly, Shreyas S Vasanawala, and Michael Lustig. Espirit–an eigenvalue approachto autocalibrating parallel mri: where sense meets grappa. Magnetic Resonance inMedicine, 71(3):990–1001, 2014. Copyright © 2013 Wiley Periodicals, Inc.
[15] Jonathan K. Stelter, Christof Boehm, Stefan Ruschke, Kilian Weiss, Maximilian N.Diefenbach, Mingming Wu, Tabea Borde, Georg P. Schmidt, Marcus R. Makowski,Eva M. Fallenberg, and Dimitrios C. Karampinos. Hierarchical multi-resolutiongraph-cuts for water-fat-silicone separation in breast mri. IEEE Transactions onMedical Imaging, 41(11):3253–3265, 2022.
[16] C Boehm, MN Diefenbach, MR Makowski, and DC Karampinos. Improved bodyquantitative susceptibility mapping by using a variable-layer single-min-cut graph-cut for field-mapping. Magnetic Resonance in Medicine, 85(3):1697–1712, Nov 2020.
Figures