4020
Investigating The Effects of The Menstrual Cycle on Glycogen Utilisation and Metabolic Activity During Exercise: A 13C MRS Study1Nottingham Digestive Diseases Centre, NIHR Nottingham Biomedical Research Centre, University of Nottingham, Nottingham, United Kingdom, 2Sir Peter Mansfield Imaging Centre, School of Physics and Astronomy, University of Nottingham, Nottingham, United Kingdom, 3Graduate School of Health and Sport Science, Nippon Sport Science University, Tokyo, Japan
Synopsis
Keywords: Hepatobiliary, Metabolism, Exercise
Motivation: The menstrual cycle (MC) has been shown to effect muscle glycogen utilisation during exercise but little is known about the full metabolic or glycogenic effects at varying phases.
Goal(s): To explore MC effects on exercise-induced changes in metabolites and glycogen stores.
Approach: 13C MRS and bloods were acquired from the liver and leg before and after 45 minutes of moderate exercise in healthy females. Test day was repeated 4 times 1 week apart throughout the MC.
Results: Previous findings of hormonal effects on muscle glycogen utilization were confirmed. Also, liver glycogen stores appear reduced in later MC days and correlated negatively with progesterone.
Impact: This study provides pilot data for future research. 13C MRS allows for the repeated monitoring of glycogen storage and turnover in an ethically viable way. This work has implications in understanding metabolic disorders, medical research and sports science.
INTRODUCTION
Recent studies have shown that oxidative stress and serum carnitine differ throughout the menstrual cycle (MC) [1, 2] effecting fatigue in premenopausal females. Furthermore, other studies found that muscle glycogen utilization varies through the MC [3] with estrogen promoting increased fat oxidation, decreasing gluceogensis and increasing time to exhaustion [4]. It has also been suggested that progesterone reverses these effects [5]. However, few studies have examined the impact on hepatic glycogen stores nor the variation throughout the late luteal and early follicular phases.This study uses 13C MRS alongside blood measurements to investigate the effects of MC on exercise-induced changes in metabolic and glycogen utilisation in the liver and muscle.
METHODS
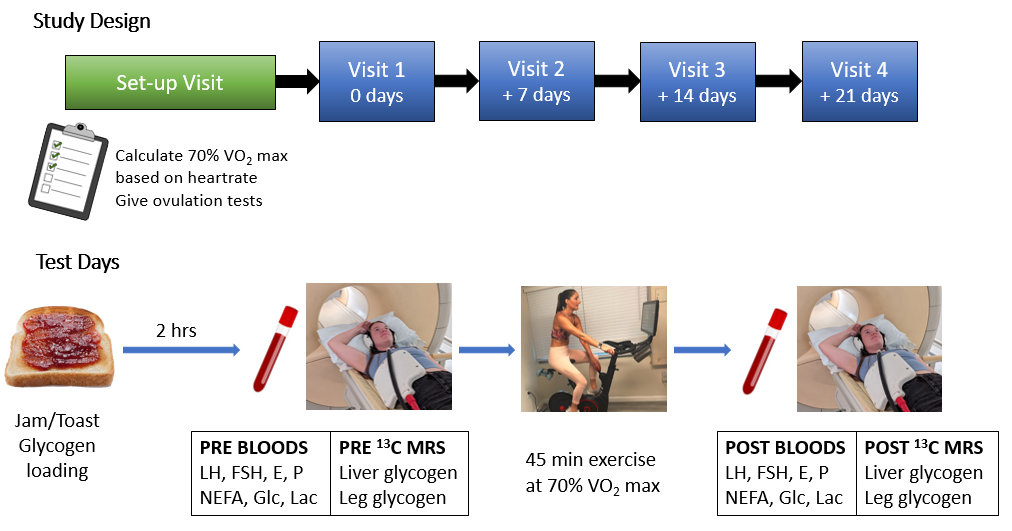
Inclusion: The study was approved by the University ethical committee and participants gave informed consent. 10 healthy human females were recruited (aged 18 – 35 yrs, BMI 18 – 25 kg m-2, habitual exercisers, regular menstrual cycle, nulliparous, no hormonal contraceptives).Study design: Participants attended 5 visits as outlined in figure 1. During test days, participants ate 1 slice of toast with jam after an overnight fast and data acquisition began 2 hrs later. Blood samples were obtained to determine luteinising (LH) and follicle-stimulating (FSH) hormones, estradiol (E), progesterone (P), non-esterified fatty acids (NEFA), plasma glucose (PGlc) and lactate (Lac). 13C MR spectra were then acquired to determine liver (L-Glyc) and muscle (M-Glyc) glycogen levels. Next, each participant undertook 45 min exercise at 70% VO2 max after which the blood and 13C MRS measurements were repeated. At each visit participants indicated if/when menstruation had started and if/when the ovulation test showed positive.
MR protocol: MR data were acquired on a Philips 3T Acheiva with 13C Pulseteq surface coil. The surface coil was placed over the liver/muscle and correct coil placement confirmed. Next, a short-duration 13C-Urea MRS reference scan was undertaken (TR = 1500 ms, 20 spectra averaged) followed by a 13C glycogen MRS scan (TR = 280 ms, 3072 spectra averaged, PB shimming) [6].
The areas under the urea reference peak and the glycogen doublet (~101 ppm) were determined by fitting Gaussian curves and scaled to the external reference peak and B1 sensitivity [7] before quantification using phantom comparison [8].
Data points were labelled relative to ovulation (OV-2, OV-1, OV+1, OV+2) and statistical comparisons undertaken.
RESULTS
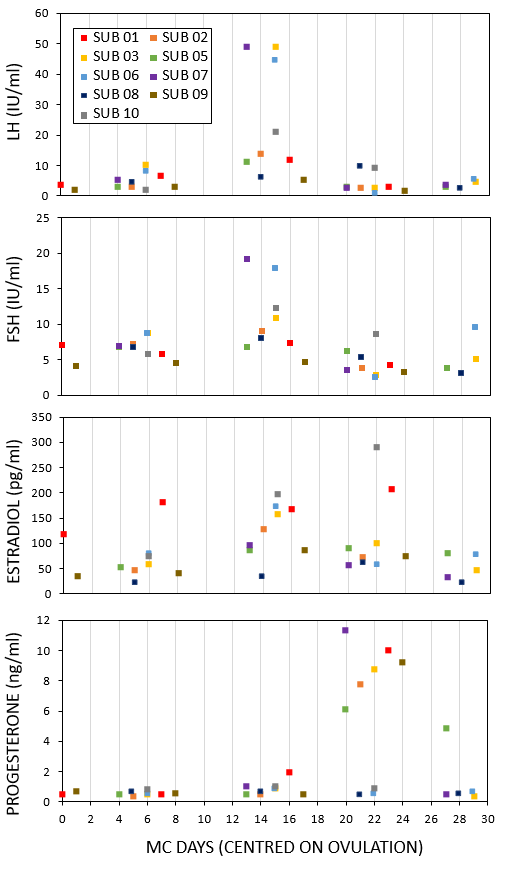
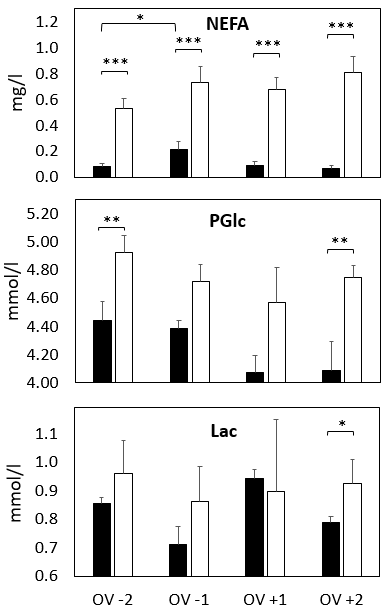
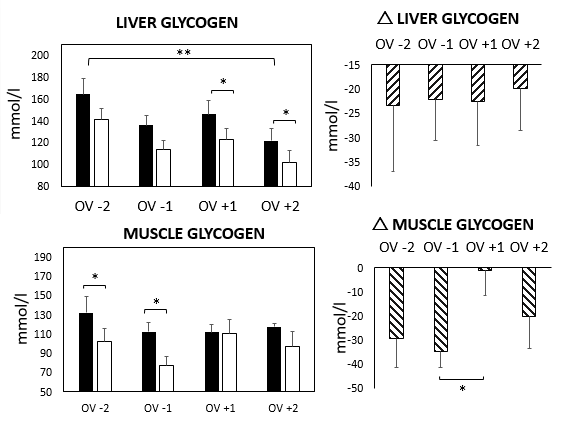
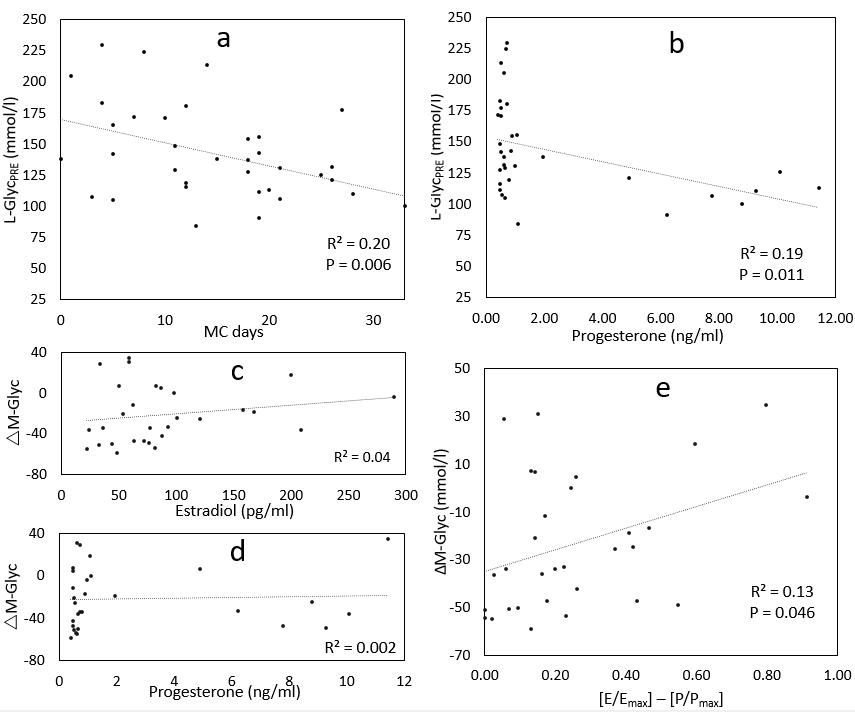
Demographics: 9 participants completed the study (Age 24 ± 4 yrs, BMI 23 ± 1 kg m-2). Due to difficulties acquiring data, muscle MRS was obtained for 6 participants and blood samples for 8 participant whereas liver MRS was obtained for all participants. Figure 2 shows the blood hormone time-course.Pre exercise values: There was no significant effect of visit on pre-exercise values (NEFAPRE: P=0.14; PGlcpre: P=0.5; Lacpre: P=0.19; L-Glycpre: P=0.1; M-Glycpre: P=0.9) as shown in figures 3 and 4. There was a significant correlation between menstruation day and L-Glycpre (gradient=-1.9, R=0.45, P=0.006) and also P and L-Glycpre (gradient=-5, R=0.44, P=0.01) as shown in figure 5.
Effects of exercise and menstruation: Figures 3 and 4 shows the effect of exercise on metabolites for each visit. There was a significant main effect of exercise on NEFA, PGLU, Lac, L-Glyc and M-Glyc but no interaction between exercise and visit. Although the effect of visit on exercise-induced change in M-Glyc was not statistically significant (P=0.075), there was a significant difference in rM-Glyc between OV-1 and OV+1 (P=0.03). There was a significant correlation between the difference in normalised E and P ([E/Emax]-[P/Pmax]) and the exercise-induced change in M-Glyc (gradient=45,R=0.36, P=0.05) as shown in figure 5.
DISCUSSION
13C MRS provides a powerful method of assessing glycogen stores invivo [6, 9]. This study confirmed the previous findings of the hormonal effects of the MC on muscle glycogen utilisation during exercise with greater differences between E and P leading to decreases in exercise-induced glycogen depletion [5]. However, the change in NEFA was not significantly affected (P=0.099).The 2 hrs post prandial glycogen concentrations were correlated with menstruation day and progesterone levels, with lower values corresponding to the later luteal phase. In addition, PGlc was reduced in the luteal compared to follicular phase (P=0.05). However, this did not correspond with an increase in NEFA, suggesting that there is a reduction in both glycogenesis and glycogenolysis towards the end of the luteal phase with potentially increased metabolic energetics – although more work is needed to establish this. This may coincide with previous studies that found an increase in fatigue and perceived reduction in athletic performance during the later luteal phase / early follicular phase, although it is unclear if this translates to objective performance [10].
Acknowledgements
No acknowledgement found.References
1. Matsuda, T., et al., Effects of the menstrual cycle on oxidative stress and antioxidant response to high-intensity intermittent exercise until exhaustion in healthy women. Journal of Sports Medicine and Physical Fitness, 2020. 60(10): p. 1335-1341.
2. Matsuda, T., et al., Effects of the Menstrual Cycle on Serum Carnitine and Endurance Performance of Women. International Journal of Sports Medicine, 2020. 41(7): p. 443-449.
3. Hackney, A.C., Influence of oestrogen on muscle glycogen utilization during exercise. Acta Physiologica Scandinavica, 1999. 167(3): p. 273-274.
4. Nicklas, B.J., A.C. Hackney, and R.L. Sharp, The Menstrual-Cycle and Exercise - Performance, Muscle Glycogen, and Substrate Responses. International Journal of Sports Medicine, 1989. 10(4): p. 264-269.
5. Oosthuyse, T. and A.N. Bosch, The Effect of the Menstrual Cycle on Exercise Metabolism Implications for Exercise Performance in Eumenorrhoeic Women. Sports Medicine, 2010. 40(3): p. 207-227.
6. Bawden, S., et al., Increased liver fat and glycogen stores following high compared with low glycaemic index food: a randomized cross over study. Diabetes Obes Metab, 2016.
7. Moyher, S.E., D.B. Vigneron, and S.J. Nelson, Surface Coil Mr-Imaging of the Human Brain with an Analytic Reception Profile Correction. Jmri-Journal of Magnetic Resonance Imaging, 1995. 5(2): p. 139-144.
8. Bawden, S.J., et al., A Low Calorie Morning Meal Prevents the Decline of Hepatic Glycogen Stores: A Pilot in vivo 13C Magnetic Resonance Study. Food and Function, 2014. 5(9): p. 2237 - 2242.
9. Casey, A., et al., Effect of carbohydrate ingestion on glycogen resynthesis in human liver and skeletal muscle, measured by C-13 MRS. American Journal of Physiology-Endocrinology and Metabolism, 2000. 278(1): p. E65-E75.
10. Carmichael, M.A., et al., The Impact of Menstrual Cycle Phase on Athletes' Performance: A Narrative Review. International Journal of Environmental Research and Public Health, 2021. 18(4).
Figures