4019
Hepatobiliary phase images synthesis from multi-phase dynamic contrast-enhanced liver MR images using generative adversarial network1Department of Medical Imaging Center, Nanfang Hospital, Southern Medical University, Guangzhou, China, 2School of Medical Information Engineering, Guangzhou University of Chinese Medicine, Guangzhou, China, 3Philips Healthcare, Guangzhou, China
Synopsis
Keywords: Liver, Liver
Motivation: Hepatobiliary Phase (HBP) of Gd-EOB-DTPA-enhanced MRI is helpful for the detection and diagnosis of liver lesions but requires waiting 20 minutes after injection of contrast agent to obtain it.
Goal(s): Therefore, we aimed to use deep learning to synthesize HBP to obtain HBP images more conveniently and efficiently.
Approach: We used generative adversarial network to synthesize HBP from multi-phase dynamic contrast-enhanced images.
Results: The results showed that the synthetic HBP images closely mimicked the real HBP images in quantitative and qualitative image analysis, which illustrated that the model could be used to synthesize HBP in clinic to shorten the acquisition time.
Impact: This study proposed a more conveniently and efficiently method to obtain hepatobiliary phase images based on generative adversarial network, which can reduce the clinical burden.
Introduction
Gd-EOB-DTPA-enhanced MRI is helpful for the detection and diagnosis of liver lesions1,2. However, HBP images acquisition needs to wait 20 minutes after the injection of contrast agent3. The long waiting time undoubtedly brings a burden to clinical. To our knowledge, many studies have attempted to obtain contrast-enhanced images through the synthesis way of deep learning to reduce the use of contrast agent4,5. Generative adversarial network (GAN) is an effective deep learning tool for image virtualization, and have achieved considerable success in the field of medical image analysis6. Therefore, our study proposed to use GAN to synthesize HBP images from dynamic contrast-enhanced images to reduce acquisition time.Methods
This retrospective study included 135 patients who underwent Gd-EOB-DTPA-enhanced MRI from December 2014 to September 2022. And patients were randomly divided into a training cohort (n=100) and validation cohort (n=35).All MRI examinations were performed by a 3.0T system (Achieva, Philips Healthcare, The Netherlands). For dynamic enhancement sequence, axial fat suppressed T1 high-resolution isotropic volume examination (THRIVE) (TR/TE = 3.1ms/1.51ms, 304 × 239 matrix, 5-mm slice thickness, FOV = 365mm × 287mm, and slice gap =-2.5mm) was performed before injection of gadoxetic acid. Then, early arterial, late arterial, portal venous, transitional, and hepatobiliary phases were acquired at 15–20s, 35–40s, 50–60s, 180s and 20min after agent injection using the same sequences used for pre-contrast images, respectively.
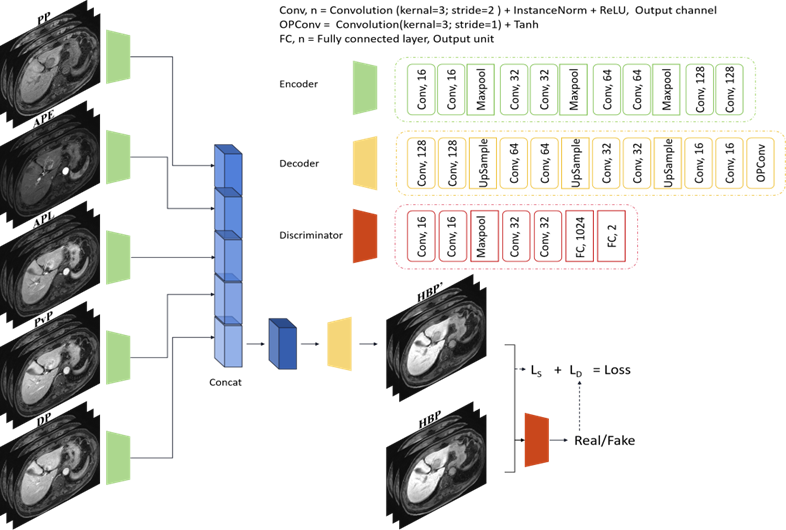
Figure 1 shows the designed network structure. The proposed model mainly consists of three parts: Encoder, Decoder, and Discriminator. Specifically, we first used Encoder to extract individual deep features for each modality and concatenated the deep features of multiple modalities in the channel dimension. Then, the concatenated deep features were fused with channel information through a 1 * 1 * 1 convolution operation and inputted into the Decoder for feature restoration to generate HBP images. Finally, we used LS loss to constrain the similarity between the generated HBP image and the real HBP image, so that the generated image and the original image were as similar as possible. We also placed the two in the discriminator to determine whether they were true or false, and used LD loss constraints to optimize the model's ability to distinguish between true and false.
LS loss is defined as: L_S=(y_{gt\_i}-y_{pred\_i)})^2
LD loss is defined as: L_{D}=-\frac{1}{n}\sum(y_{gt}\log y_{pred}+(1-y_{gt})\log (1-y_{pred}))
For overall image quantitative evaluation, peak signal-to-noise ratio (PSNR), structural similarity index (SSIM) and normalized root mean square error (NRMSE) were used. Besides, to evaluate the synthesis performance within the tumor region, the tumor contrast-to-noise ratio (CNR) of the synthetic HBP images was compared with the real HBP. For qualitative evaluation, liver edge sharpness, hepatic vessel clarity, bile duct visualization, respiratory motion artifact, non-respiratory artifact, subject image noise and overall image quality of real and synthetic HBP images were assessed by two radiologists independently. The results were presented in mean ± SD. For image quality analysis, inter-observer agreements were assessed by intraclass correlation coefficient (ICC). Image quality and CNR in real and synthetic HBP set were compared by Wilcoxon signed-rank test. A two-tailed p < 0.05 was considered statistically significant. All statistical analyses were performed using SPSS statistical software (version 26).
Results
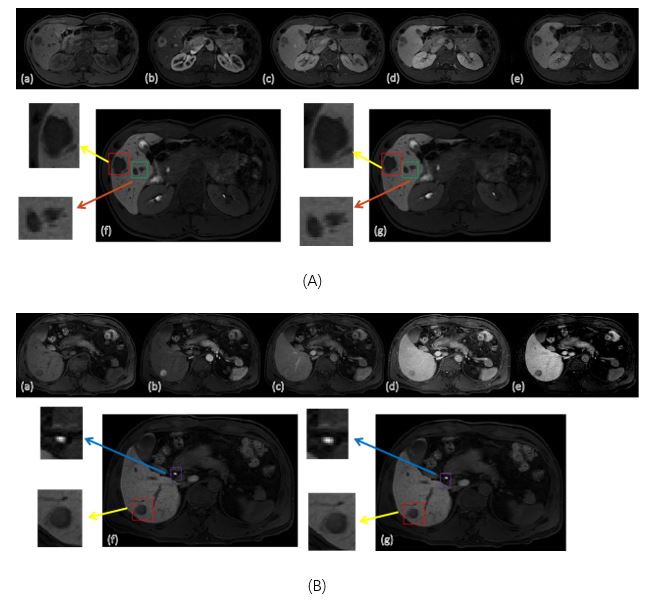
In quantitative evaluation, the GAN model achieved a PSNR of 37.89±2.58, an SSIM of 0.782±0.073, and an NRMSE of 0.0134±0.0045. The average CNR of 35 patients in the validation cohort for the real MR tumor regions was 15.58±6.42. In contrast, the average CNR for the synthetic tumor regions was 16.39±6.73, which was superior to real tumor regions with a p-value of 0.001. In qualitative evaluation, two readers showed fair to excellent interobserver agreement on all parameters, of which the ICCs ranged between 0.518–0.818. In addition, all parameters showed no significant difference between the real and synthetic images. (Table 1). Figure 2 shows examples of synthetic HBP compared to real HBP.Discussion
The results showed that the average CNR for the synthetic tumor regions was superior to real tumor regions with significant difference. This maybe because Gaussian smoothing was used as post-processing, which reduced image noise of synthetic HBP. Besides, qualitative image analysis showed that there were no significant difference between real and synthetic HBP images in all image quality parameters, which indicated that the synthetic HBP images closely mimicked the real HBP images. Our future work will consider to further analyse the tumor region, such as the identification of benign and malignant lesion, to verify whether the synthetic HBP meets the clinical diagnostic needs.Conclusion
Our study proposed a GAN model to synthesize HBP images from dynamic contrast-enhanced images, which closely mimicked the real HBP images.Acknowledgements
The authors thank the School of Medical Information Engineering, Guangzhou University of Chinese Medicine for providing technical support for this study.References
1. Böttcher J, Hansch A, Pfeil A, et al. Detection and classification of different liver lesions: comparison of Gd-EOB-DTPA-enhanced MRI versus multiphasic spiral CT in a clinical single centre investigation. European journal of radiology. Nov 2013;82(11):1860-9. doi:10.1016/j.ejrad.2013.06.013
2. Liu X, Jiang H, Chen J, Zhou Y, Huang Z, Song B. Gadoxetic acid disodium-enhanced magnetic resonance imaging outperformed multidetector computed tomography in diagnosing small hepatocellular carcinoma: A meta-analysis. Liver transplantation : official publication of the American Association for the Study of Liver Diseases and the International Liver Transplantation Society. Dec 2017;23(12):1505-1518. doi:10.1002/lt.24867
3. Hamm B, Staks T, Mühler A, et al. Phase I clinical evaluation of Gd-EOB-DTPA as a hepatobiliary MR contrast agent: safety, pharmacokinetics, and MR imaging. Radiology. Jun 1995;195(3):785-92. doi:10.1148/radiology.195.3.7754011
4. Narayana PA, Coronado I, Sujit SJ, Wolinsky JS, Lublin FD, Gabr RE. Deep Learning for Predicting Enhancing Lesions in Multiple Sclerosis from Noncontrast MRI. Radiology. Feb 2020;294(2):398-404. doi:10.1148/radiol.2019191061
5. Kleesiek J, Morshuis JN, Isensee F, et al. Can Virtual Contrast Enhancement in Brain MRI Replace Gadolinium?: A Feasibility Study. Investigative radiology. Oct 2019;54(10):653-660. doi:10.1097/rli.0000000000000583
6. Gong M, Chen S, Chen Q, Zeng Y, Zhang Y. Generative Adversarial Networks in Medical Image Processing. Current pharmaceutical design. 2021;27(15):1856-1868. doi:10.2174/1381612826666201125110710
Figures
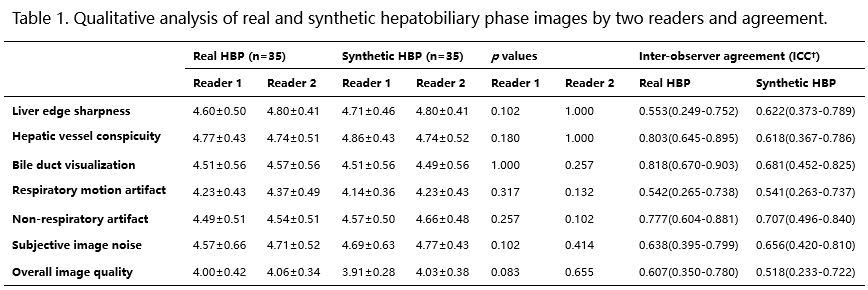
Values are mean ± standard deviation. Higher scores indicating better image quality.
† Two-way random effect model; numbers in parentheses are 95% confidence interval.