4018
Assessment of decompensation in patients with cirrhosis based on gadoxetic acid enhanced MR imaging parameters1Affiliated Nantong Hospital 3 of Nantong University, Nantong, China, 2Philips Healthcare, Shanghai, China
Synopsis
Keywords: Liver, Liver
Motivation: It is important to identify patients with cirrhosis at high risk of decompensation or death using noninvasive methods to stabilize disease progression and reduce patient mortality
Goal(s): To investigate whether the functional parameters from gadoxetic acid–enhanced MRI can predict decompensation in cirrhosis.
Approach: To compare MRI parameters and clinical parameters between CACLD and DACLD groups. Associations between MRI parameters and clinical parameters were investigated. To differentiate the diagnostic performance of MRI parameters and clinical parameters between CACLD and DACLD groups.
Results: The functional parameters from gadoxetic acid–enhanced MRI can predict decompensation in cirrhosis.
Impact: This study confirms that non-invasive imaging parameters can predict the decompensation of cirrhosis and provides a new method for clinicians to evaluate the condition of patients with cirrhosis.
PURPOSE
To investigate whether the functional parameters from gadoxetic acid–enhanced MRI can predict decompensation in cirrhosis.METHODS
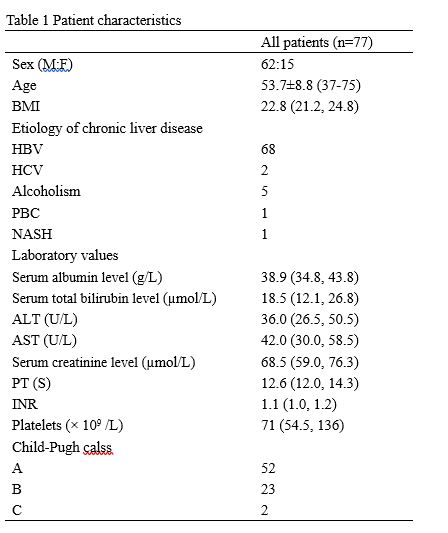
This retrospective study included 77 cirrhotic patients (62 men and 15 women), divided into compensated advanced chronic liver disease (CACLD) group and decompensated advanced chronic liver disease (DACLD) group. All patients were performed non-enhanced and gadoxetic acid–enhanced MRI of liver, hepatobiliary phases were obtained 19 min after the injection of gadoxetic acid. Look-Locker sequences were performed pre and post-contrast at 20 minutes after gadoxetic acid administration. Liver-to-spleen contrast index (LSI), contrast uptake index (CUI), relative liver enhancement (RLE), hepatocyte fraction (HeF), T1 relaxation times on unenhanced (T1unenh) and hepatobiliary phase (T1HBP), reduction rates of T1 relaxation times (rrT1), and the functional liver imaging score (FLIS) of the liver were measured and calculated by two radiologists independently, with four regions of interest (ROIs) separately placed in both lobes of the liver. The serum biochemistry markers were collected to calculated clinical grading systems (ALBI score, CTP score, MELD score and ICG R15). Interreader agreement was evaluated by using intraclass correlation coefficient (ICC). Independent samples t test and Mann-Whitney U test were performed to compare MRI parameters and clinical parameters between CACLD and DACLD groups. Associations between MRI parameters and clinical parameters were investigated using Pearson’s correlation coefficient or Spearman’s correlation coefficient. ROC analyses were done to differentiate the diagnostic performance of MRI parameters and clinical parameters between CACLD and DACLD groups.Results
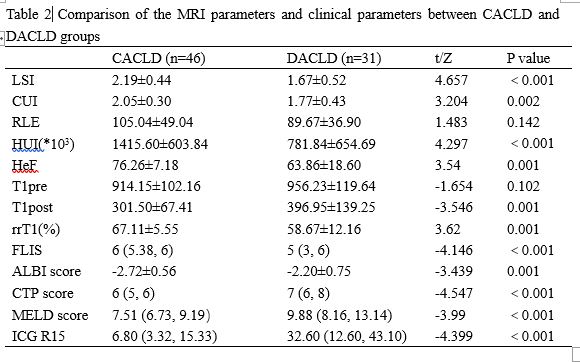
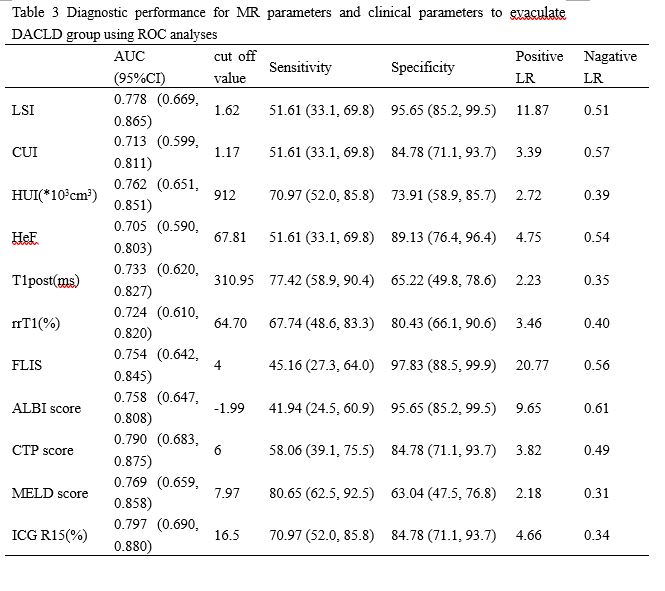
1. ICC of the two reviewers with the gadoxetic acid-enhanced MRI parameters (LSI, CUI, RLE, HeF, T1unenh, T1HBP, rrT1 and FLIS) ranged from 0.933 for CUI to 0.993 for HeF, as shown in Table 1. 2. Comparison of the gadoxetic acid-enhanced MRI parameters and clinical parameters between CACLD and DACLD groups were shown in Table 2. There were significantly differences (P<0.05) in all MRI parameters and clinical parameters between CACLD and DACLD groups except RLE and T1unenh. 3. Correlation between MR parameters and clinical parameters were shown in Table 3. MR parameters (LSI, CUI, HeF, T1HBP, rrT1 and FLIS) correlated significantly (P<0.05) with clinical parameters (ALBI score, CTP score, MELD score and ICG R15). 4. The diagnostic performance for MR parameters and clinical parameters to evaluate DACLD group were shown in Table 4. MR parameters and clinical parameters were able to discriminate patients with CACLD group versus DACLD group, with AUC values ranging from 0.705 for HeF to 0.797 for ICG R15. There were no significant difference among these parameters (P>0.05).DISCUSSION:
Our study showed that the ICCs ranged from 0.933 for CUI to 0.993 for HeF, and the interreader agreements of all MRI parameters were almost perfect. The study demonstrated that LSI, CUI, HeF, T1HBP, rrT1, FLIS, ALBI score, CTP score, MELD score and ICG R15 were significantly different between CACLD and DACLD groups. The correction coefficients between MRI parameters and clinical parameters were moderate and high. The majority of MR parameters and all clinical parameters were able to discriminate patients with CACLD group versus DACLD group, with AUC values ranging from 0.705 for HeF to 0.797 for ICG R15. MELD score had the highest sensitivity, and FLIS had the highest specificity.CONCLUSIONS
The functional parameters from gadoxetic acid–enhanced MRI can predict decompensation in cirrhosis. MRI parameters are help for the evaluation of chronic liver disease patients in clinical practice.Acknowledgements
No acknowledgement found.References
No reference found.Figures