4016
Characterization of small liver lesions using a partial volume corrected T2 mapping technique1Applied Mathematics, University of Arizona, Tucson, AZ, United States, 2Siemens Healthineers, New York, NY, United States, 3Medical Imaging, University of Arizona, Tucson, AZ, United States, 4Radiology, Houston Methodist Research Institute, Houston, TX, United States, 5Electrical & Computer Engineering, University of Arizona, Tucson, AZ, United States, 6Biomedical Engineering, University of Arizona, Tucson, AZ, United States
Synopsis
Keywords: Liver, Body
Motivation: T2 mapping is an effective way to classify benign and malignant lesions within the liver, but existing methods that do not account for partial volume systematically underestimate lesion T2, leading to false positives.
Goal(s): To develop a signal model that accounts for partial volume effects to more accurately quantify T2 of liver lesions.
Approach: Use a two-compartment signal model tailored for turbo spin-echo acquisitions taking into account the varying lesion fraction across the imaging slice.
Results: The proposed method leads to more accurate T2 estimation in the presence of partial volume as demonstrated in simulations, physical phantoms, and subjects with focal liver lesions.
Impact: This work presents a turbo spin-echo signal model that accounts for partial volume effects to estimate T2 values of focal liver lesions more accurately. The proposed method improves the accuracy of classifying benign and malignant liver lesions.
Introduction
T2-weighted imaging is routinely used in abdominal imaging for discriminating the most prevalent benign liver lesions (hemangiomas and cysts) from malignancies1. For lesions affected by partial volume (PV), e.g., small lesions, the diagnosis is challenging even for experts. Characterization of focal liver lesions based on T2 mapping has been demonstrated2-5, however when PV is present, the T2 of lesions is underestimated resulting in false positives2,6.Here we present a signal model for accurate T2 estimation in the presence of PV. The model considers the change in lesion fraction within a slice, a key characteristic of focal liver lesions. The method is demonstrated using computer simulations, physical phantoms, and in-vivo.
Methods:
Signal Modeling:Without PV effects, the signal at echo time TE from a turbo spin-echo sequence is represented using the SEPG model:7
$$s(TE)=I\int_zf(T1,T2,B1,\theta_0(z),\theta_1(z),...,\theta_{n}(z),TE)\quad[1]$$
where $$$T1$$$ and $$$T2$$$ are relaxation times, $$$I$$$ is the signal intensity at TE=0, $$$\theta_0(z)$$$ and $$$\theta_i(z):i=1,...,n$$$ are the excitation and refocusing RF slice profiles, $$$B1$$$ is a flip angle scaling factor, and $$$f$$$ is the EPG signal model8 describing the signal evolution integrated over the slice profile.
Equation 1 can be extended to include two components (SEPG2):
$$s(TE)=I_{bg}\int_zf(T1_{bg},T2_{bg},B1,\theta_0(z),\theta_1(z)...,\theta_{n}(z),TE)+I_{les}\int_zf(T1_{les},T2_{les},B1,\theta_0(z),\theta_1(z),...,\theta_{n}(z),TE)\quad[2]$$
where $$$bg$$$ and $$$les$$$ denote background and lesion; $$$I_{bg}$$$ and $$$I_{les}$$$ determine the lesion fraction. Equation 2 assumes that $$$bg$$$ and $$$les$$$ are distributed uniformly throughout the slice.
For focal liver lesions, the lesion fraction varies across the slice and the slice profile affects $$$bg$$$ and $$$les$$$ differently (Figure 1). To account for these differences, we decompose the slice profile into sub-profiles for $$$bg$$$ and $$$les$$$ over which each component is integrated. We then incorporate slice profile discretization factors for liver and lesion components $$$(\lambda_{bg},\lambda_{les})$$$. The proposed model with slice profile correction (SEPG2-PV) is:
$$s(TE)=f_{sepg}(T1_{bg},T2_{bg},B1,\lambda_{bg},\theta_0(z),\theta_1(z),...,\theta_{n}(z),TE)+f_{sepg}(T1_{les},T2_{les},B1,\lambda_{les},\theta_0(z),\theta_1(z),...,\theta_{n}(z),TE)\quad[3]$$
Monte Carlo simulations: Numerical phantoms were constructed representing a benign spherical lesion (T2=180$$$\pm$$$5 ms, T1=1400$$$\pm$$$50 ms) embedded in liver (T2=40$$$\pm$$$5 ms, T1=600$$$\pm$$$30 ms). Slice profiles were generated using the Shinnar–Le Roux algorithm9. TE images were generated from the forward model and Gaussian noise was added to the images. T2 values were estimated from TE images using a joint fitting algorithm10.
Imaging experiments: Data were acquired with a radial turbo spin-echo (RADTSE) technique at 1.5T (Aera, Siemens). NMR tubes ending in spherical bulbs filled with 0.14mM Multihance (T2=160ms) representing benign lesions, were immersed in a container with 3.6mM Multihance (T2=44 ms) representing liver. Slices were prescribed with different offsets from the center of the bulb to vary PV levels. Reference T2 estimates were obtained separately for each container using a single-echo spin-echo pulse sequence.
In-vivo RADTSE data were acquired on 33 patients after obtaining informed consent which yielded a total of 89 lesions. TE images were reconstructed using a subspace constrained algorithm11. T2 values were estimated using a joint estimation algorithm10.
Results and Discussion
Table 1 shows the T2 error based on Monte Carlo simulations when (A) changing position of an 8-mm lesion within a 10-mm slice and (B) changing the diameter for a lesion at the center of a 10-mm slice. The SEPG2-SP model is more accurate for all offsets and lesion diameters compared to the SEPG2 model.Table 2 shows the T2 error for 8-mm, 9.5-mm and 12-mm diameter spherical bulbs for three different relative slice positions. In all cases, the T2 error is lower with the SEPG2-SP model.
Figure 2 shows the effect of PV on T2 estimation with prescribed slice positions for a subject with a hemangioma; at least one position was centered on the lesion (position $$$3$$$), where PV is minimized. With SEPG2 the T2 values for edge slices (positions $$$1,2,4$$$) are underestimated compared to the reference center slice (position $$$3$$$). In fact, lesion T2 for positions $$$1$$$ and $$$2$$$ fall in the malignancy range. With SEPG2-SP all positions have T2 values closer to the center slice and fall in the range of hemangiomas.
Lesion classification with the SEPG2-SP model was evaluated in-vivo for 89 lesions (37 metastases, 3 HCC, 7 hemangiomas, 42 cysts). Results were compared to the conventional approach where PV is not considered. T2 was estimated through edge and center slices to account for PV. As shown in Figure 3, SEPG2-SP classified all lesions correctly (AUC=1) regardless of their position within the imaging slice. When PV is not considered, there is overlap between benign and malignant lesions (AUC=0.93).
Conclusion
A two-component model accounting for lesion fraction variation within the slice profile is presented. The method improved the characterization of focal liver lesions affected by PV yielding complete separation of benign and malignant lesions.Acknowledgements
We would like to acknowledge grant support from the National Institutes of Health (CA245920 and EB031894), Arizona Biomedical Research Centre (CTR056039), the Technology and Research Initiative Fund (TRIF) Improving Health Initiative, and the University of Arizona’s National Science Foundation supported Research Training Group in Data Driven Discovery.
References
- Matos AP, Velloni F, Ramalho M, AlObaidy M, Rajapaksha A, Semelka RC. Focal liver lesions: Practical magnetic resonance imaging approach. World J Hepatol 2015;7:1987-2008.
- Cieszanowski A, Anysz-Grodzicka A, Szeszkowski W, Kaczynski B, Maj E, Gornicka B, Grodzicki M, Grudzinski I, Stadnik A, Krawczyk M, Rowinski O. Characterization of focal liver lesions using quantitative techniques: comparison of apparent diffusion coefficient values and T2 relaxation times. Eur Radiol 2012;22:2514–2524.
- Kim YH, Saini S, Blake MA, Harisinghani M, Chiou YY, Lee WJ, Yu JS, Hahn PF. Distinguishing hepatic metastases from hemangiomas: qualitative and quantitative diagnostic performance through dual echo respiratory-triggered fast spin echo magnetic resonance imaging. J Comput Assist Tomogr 2005;29:571–579.
- Farraher SW, Jara H, Chang KJ, Ozonoff A, Soto JA. Differentiation of hepatocellular carcinoma and hepatic metastasis from cysts and hemangiomas with calculated T2 relaxation times and the T1, 2006
- Altbach, M. I., Outwater, E. K., Trouard, T. P., Krupinski, E. A., Theilmann, R. J., Stopeck, A. T., & Gmitro, A. F. (2002). Radial fast spin‐echo method for T2‐weighted imaging and T2 mapping of the liver. J Magn Reason Imaging 2002; 16, 179-189.
- Taouli B, Vilgrain, et al , Evaluation of Liver Diffusion Isotropy and Characterization of Focal Hepatic Lesions with Two Single-Shot Echo-planar MR Imaging Sequences: Prospective Study in 66 Patients, Radiology, 2003
- Lebel RM and Wilman AH. Transverse relaxometry with stimulated echo compensation. Magn Reson Med. 2010; 64:1005-14.
- J. Hennig, "Multiecho Imaging Sequences with Low Refocusing Flip Angles," J. Magn. Reson., 1988, 78, 397-407.
- J. Pauly, P. Le Roux, D. Nishimura and A. Macovski, "Parameter relations for the Shinnar-Le Roux selective excitation pulse design algorithm (NMR imaging)," in IEEE Transactions on Medical Imaging, vol. 10, no. 1, pp. 53-65, March 1991,
- Huang C, Galons JP, Graff CG, Clarkson EW, Bilgin A, Kalb B, Martin DR, Altbach MI. Correcting partial volume effects in biexponential T2 estimation of small lesions. Magn Reson Med. 2015; 73:1632-42.
- Huang, C., Graff, C. G., Clarkson, E. W., Bilgin, A., & Altbach, M. I. (2012). T2 mapping from highly undersampled data by reconstruction of principal component coefficient maps using compressed sensing. Magnetic resonance in medicine, 67(5), 1355-1366.
Figures
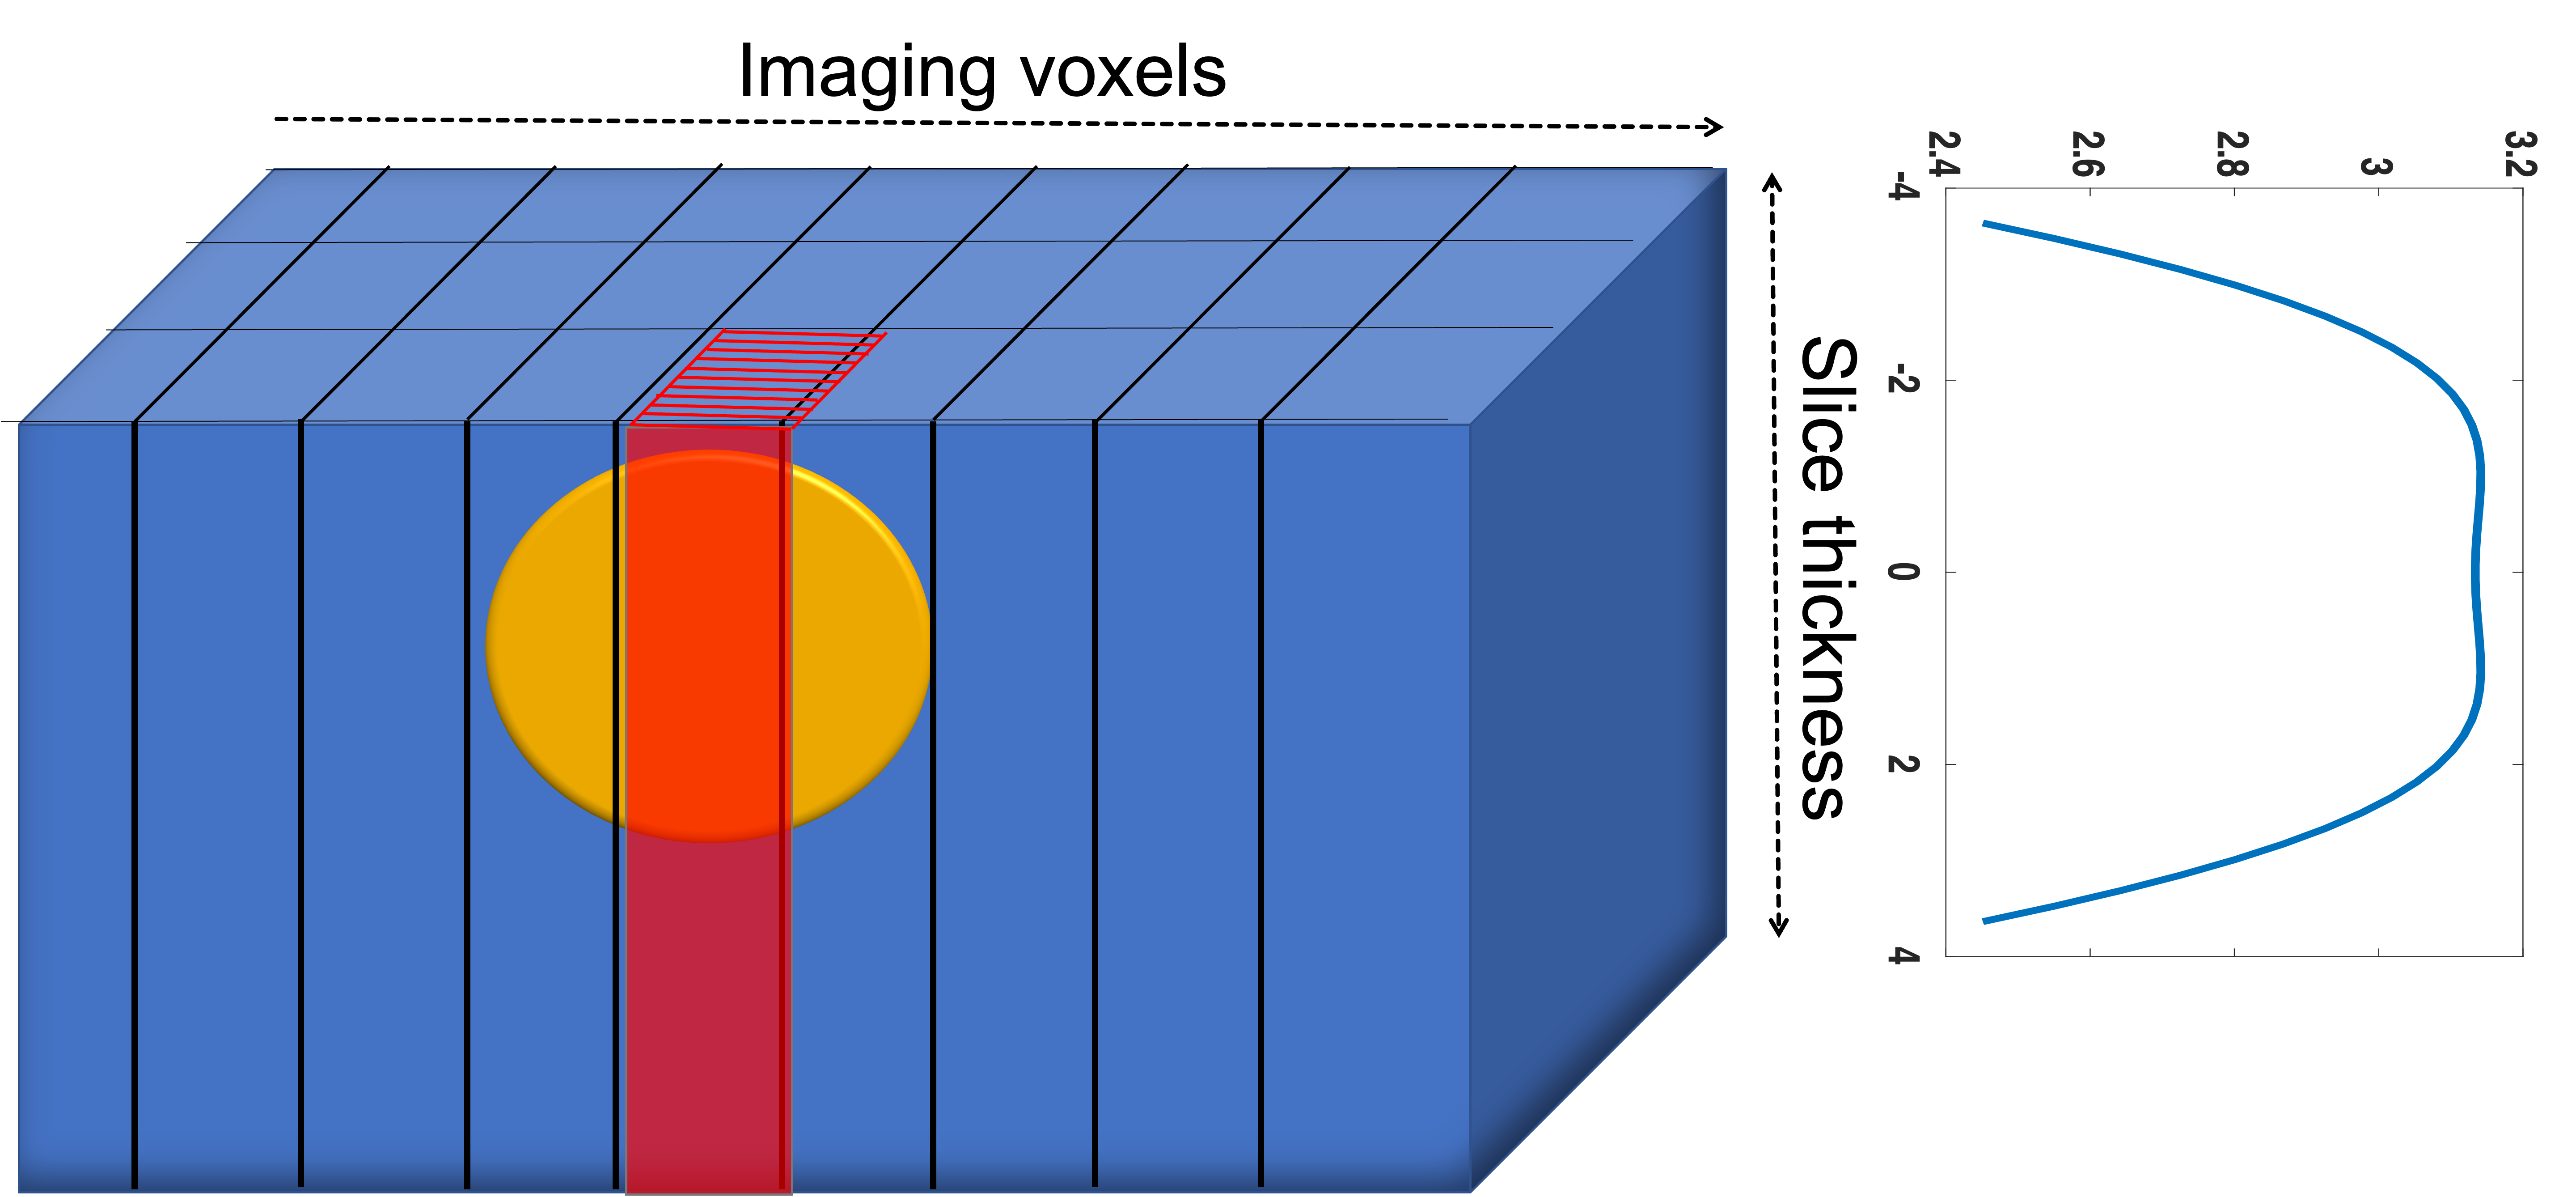
Figure 1: Illustration of slice profile effects on two-component model. Assuming a lesion (yellow circle) embedded within background tissue (blue), flip angle variations across the excited/refocused slice cause the two tissue types to experience different coherent pathways in a turbo spin-echo experiment. The observed signal from the slice is a cumulative sum of signal from these two components. That behavior needs to be accounted in the signal model that is used for T2 estimation.


Table 2: Physical phantom experiments showing T2 estimation error with SEPG2 and SEPG2-SP. Results show the effect of changing lesion diameter and position relative to the center of the imaging slice. T2 accuracy is higher with SEPG2-SP. Estimation accuracy increases as the lesion moves towards the center of the slice (where the slice profile is more uniform) and as lesion size increases since more of the lesion experiences the true refocusing flip angle. RADTSE imaging parameters: FOV=14 cm, base resolution=256, radial views=256, ETL=32, echo spacing=6.8ms and 10-mm thick slices.
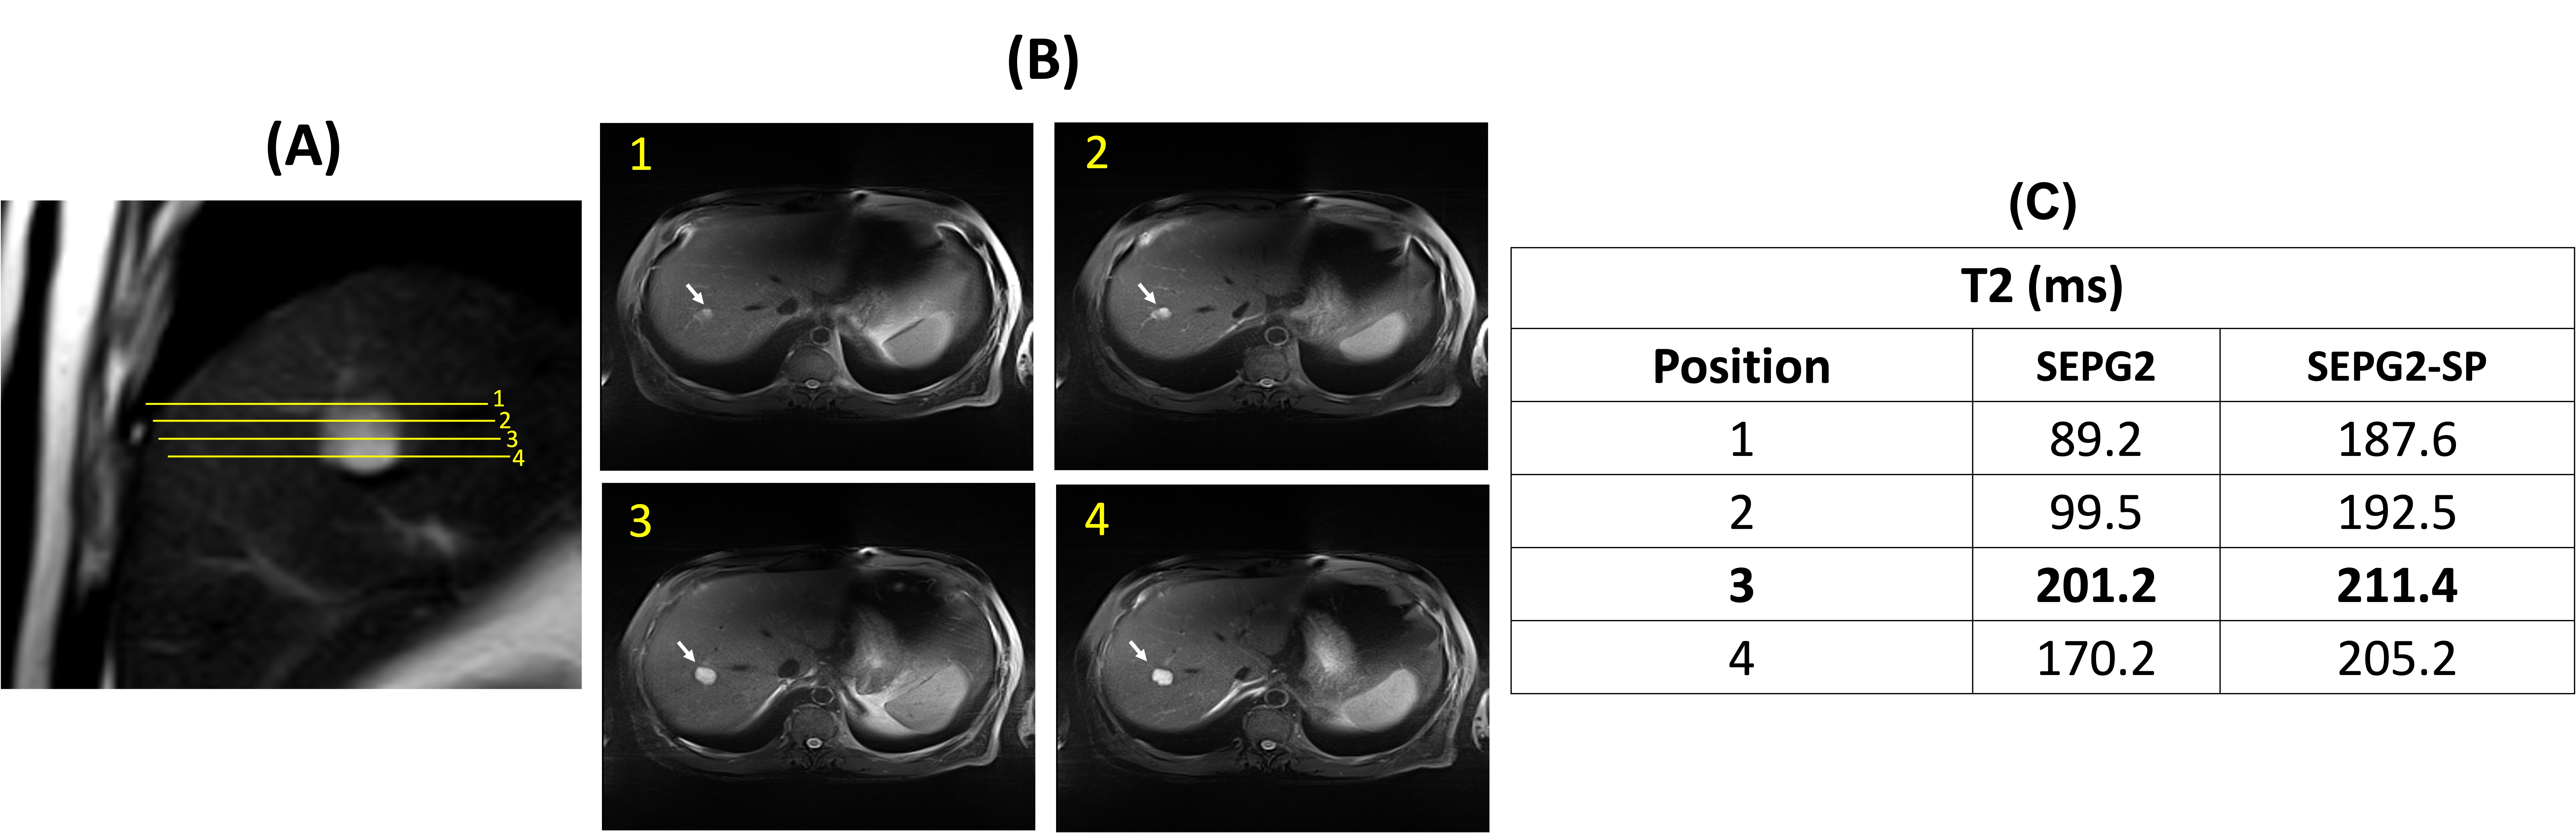
Figure 2: Effect of slice position on lesion T2 estimation for a subject with a hemangioma. (A) Slice positions through the hemangioma (coronal view); at least one position (position 3) is centered on the lesion, where PV is minimized. (B) Axial slices showing the lesion (arrow). (C) Estimated T2 values with the SEPG2 and SEPG2-SP models for the different slice prescriptions. Imaging parameters: ETL=32, FOV= 40 cm, echo spacing=7.1 ms, TR=3000 ms, readout bandwidth=501 Hz/pixel, base resolution=256, radial views=192. Twenty-one slices (8-mm thick) acquired in three breath-holds.
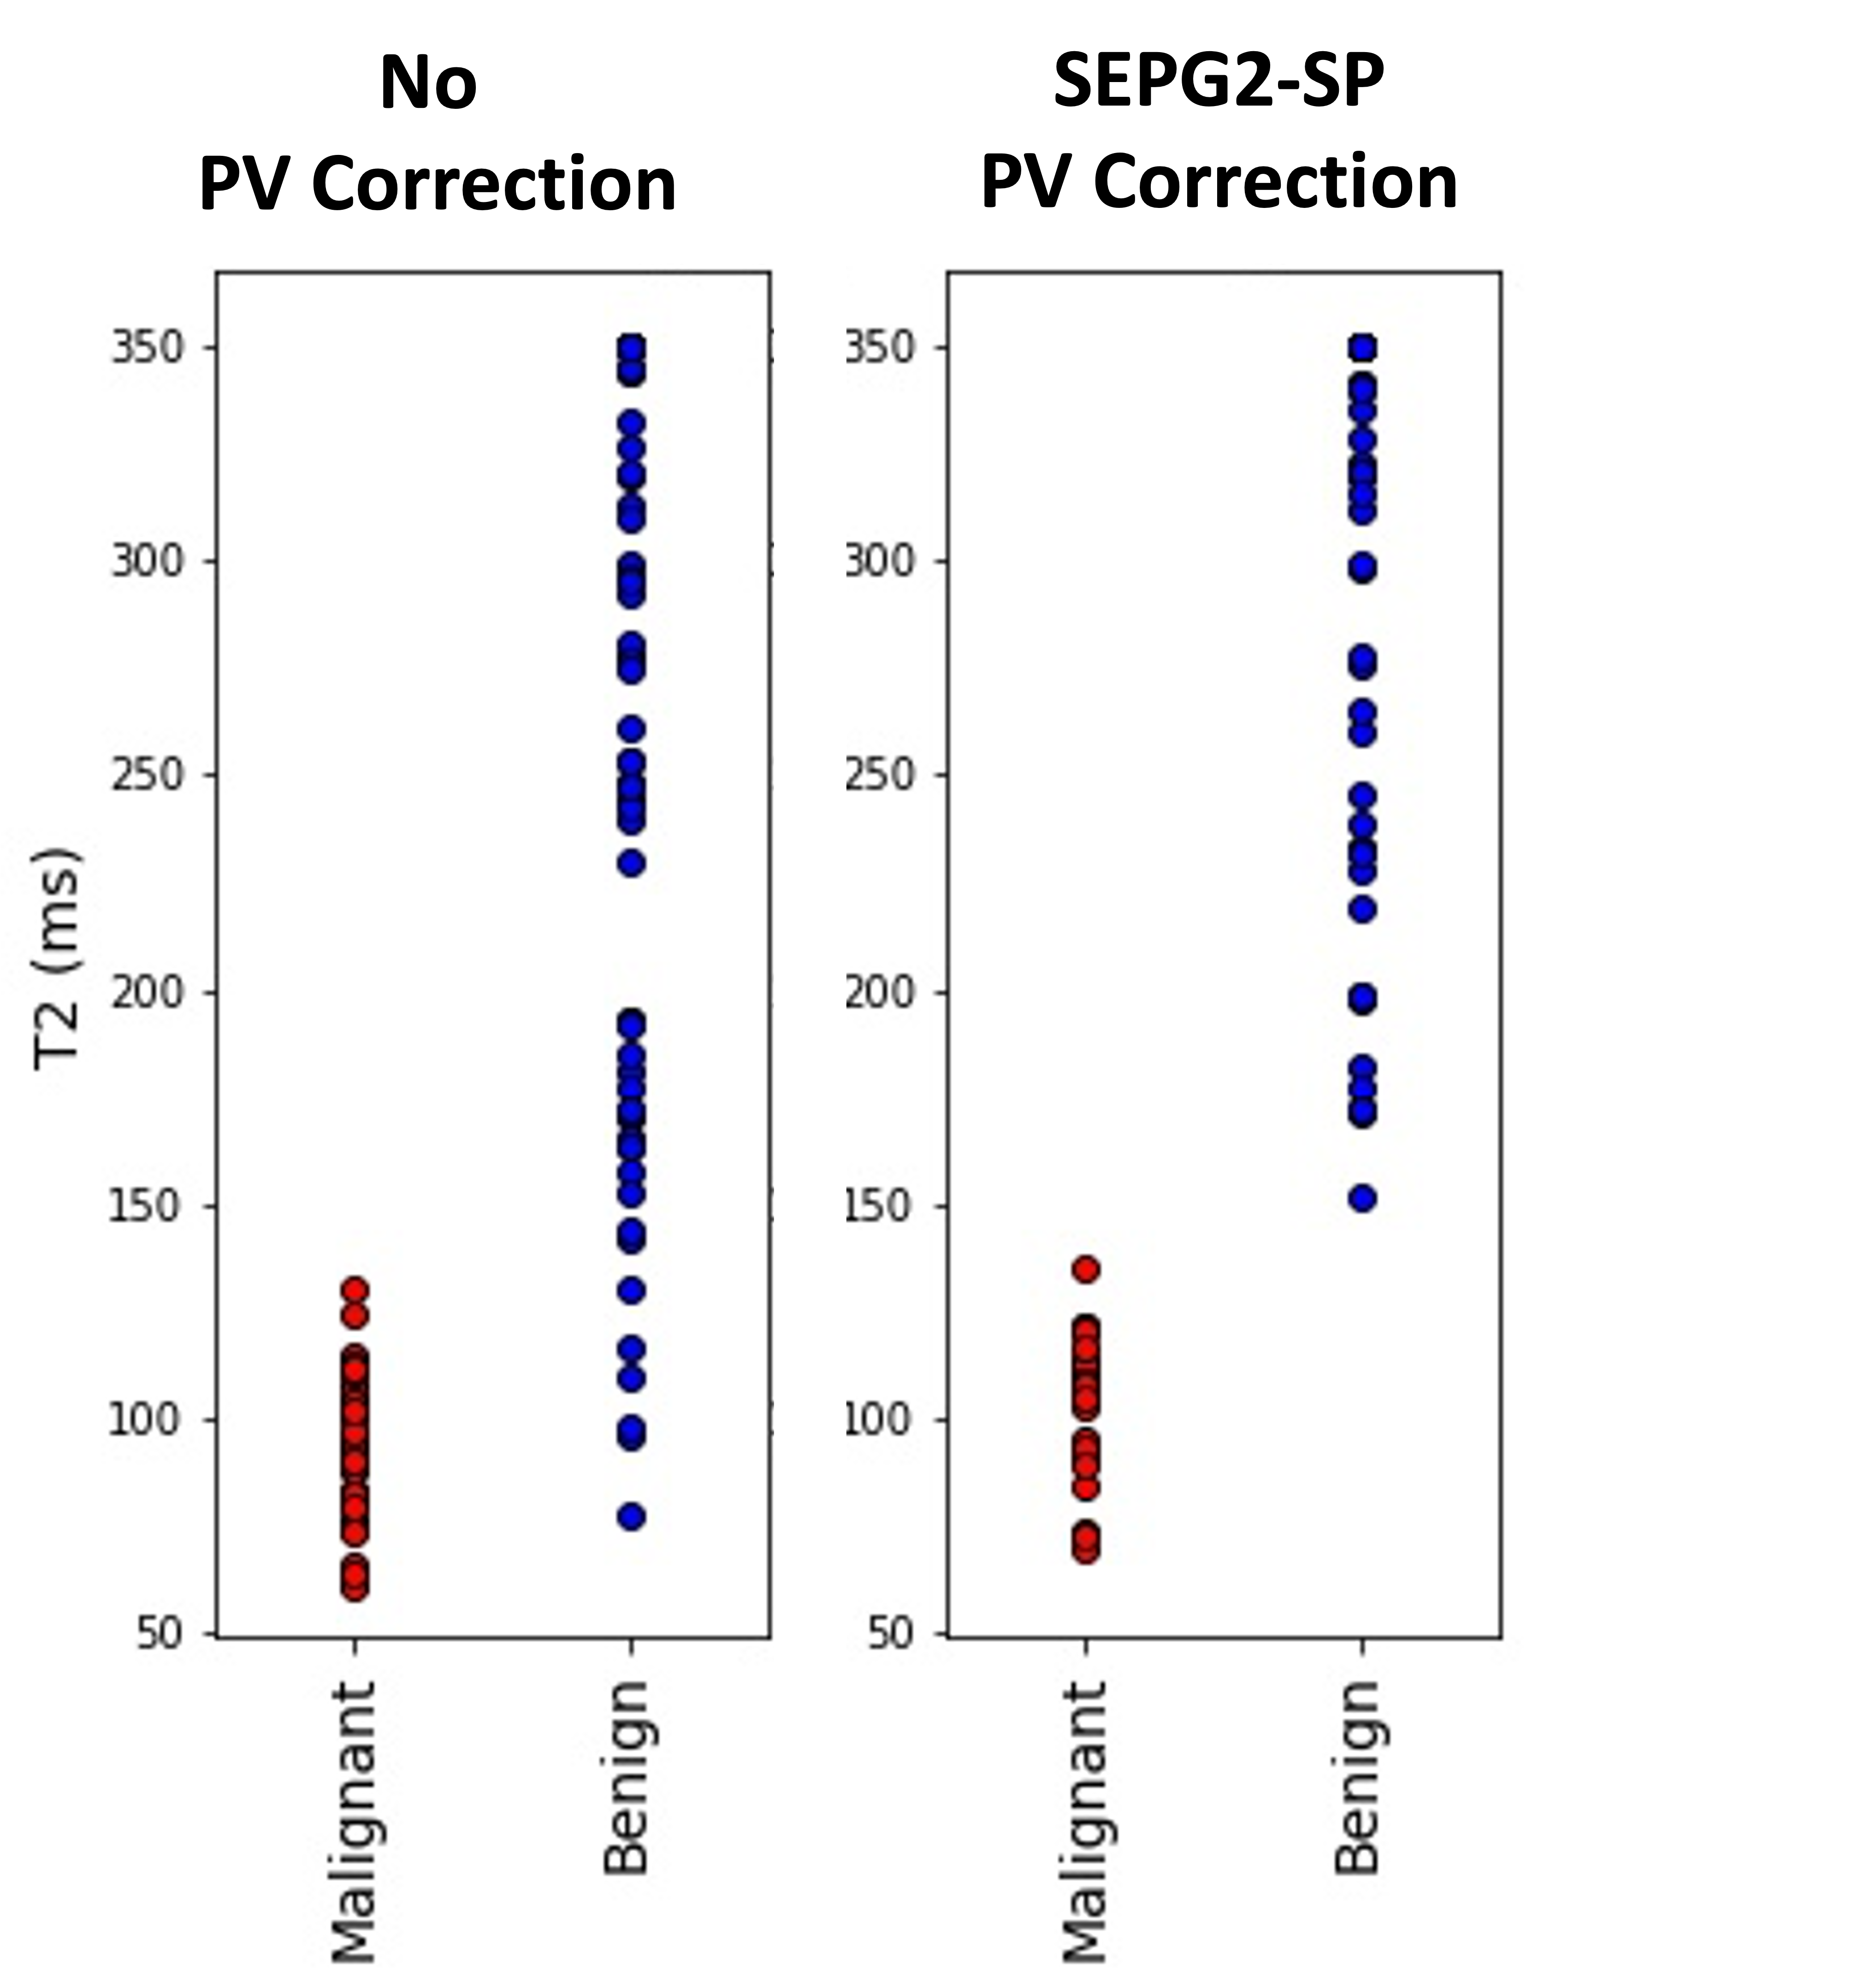
Figure 3: Scatter plots of T2 estimates from 33 patients with a total of 89 neoplasms (37 metastases, 3 HCC, 7 hemangiomas, 42 cysts) comparing SEPG2-SP with the conventional approach where PV is not considered. The area under the ROC curve (AUC) for SPEG2-SP is 1.0; when PV is not considered there is overlap between benign and malignant lesions (AUC=0.93). Imaging parameters: ETL=32, FOV= 36–42 cm, echo spacing=7.1 ms, TR=3000 ms, receiver bandwidth=501 Hz/pixel, base resolution=256, radial views=192. Twenty-one slices (8-mm thick) acquired in three breath-holds.