4015
Measurement of liver function with dynamic gadoxetate-enhanced MRI: a validation study in healthy volunteers1University of Leeds, Leeds, United Kingdom, 2Bioxydyn Ltd, Manchester, United Kingdom, 3Antaros Medical, Molndal, Sweden, 4University of Manchester, Manchester, United Kingdom, 5University of Sheffield, Sheffield, United Kingdom, 6University College London, London, United Kingdom, 7Bayer AG, Berlin, Germany
Synopsis
Keywords: Liver, Liver, function
Motivation: Interaction of drugs via inhibition of liver function affects their toxicity and efficacy, but this is currently difficult to assess clinically.
Goal(s): To determine if a DCE-MRI measurement of liver function is sufficiently sensitive to detect drug-induced inhibition of liver function in humans.
Approach: 10 healthy volunteers underwent a DCE-MRI measurement of their baseline liver function. The measurement was repeated on a second day after administration of rifampicin, a powerful inhibitor of liver function.
Results: Rifampicin reduced the hepatocellular uptake rate by 93%, and the effect was consistent between volunteers. The biliary excretion rate reduced by 48% and the effect was more variable.
Impact: Early clinical assessment of drug-drug interactions can significantly reduce the risk of expensive late-stage failures in drug development, potentially increasing the rate at which new drugs can enter the market, and reducing the risk to trial subjects and patients.
INTRODUCTION
Numerous clinically relevant drug-drug interactions (DDIs) arise via inhibition of hepatic uptake or excretion of victim drugs, which may impact on their efficacy and toxicity [1]. DDIs are assessed during drug development by a combination of in-vitro and in-silico methods, but predictions of changes in tissue exposure are difficult to verify clinically. This reveals a critical need for noninvasive methods which may be used to determine drug exposure within the tissue of interest in vivo.Preclinical studies in rats have shown that inhibition of liver uptake and excretion by drugs can be measured with dynamic gadoxetate-enhanced MRI [2]. The aim of this study was to verify whether this finding translates to humans, by measuring the change in liver gadoxetate uptake and excretion after administration of rifampicin, a known inhibitor of hepatic OATP1B1 and MRP2 transporters.
METHODS
Study design: 10 young healthy volunteers were scanned on two different days. On day 2, 600mg rifampicin was administered orally 1.5hrs before the start of the scan, but the protocols were otherwise identical on both days. Since excretion of gadoxetate after administration of rifampicin is slow, the measurement was split over two different scans separated by one hour. In each of the two scans, DCE-MRI was performed continuously for 40-50 minutes. During each scan, either an eighth (first 2 volunteers) or a quarter dose (last 8 volunteers) of gadoxetate was injected after the start of the DCE acquisition.MRI protocol: MRI was performed at 3T using a Siemens Prisma. Each scan session involved localizers, high-resolution T2-weighted imaging (axial and coronal), T2*-mapping, a MOLLI T1-map (5 transverse slices), and 3D free-breathing DCE. In the first of two scans, a MOLLI T1-map was taken after the DCE as well. The DCE sequence was a coronal 3D FLASH with a time resolution of 2.3sec, 36 slices, FOV 450mm, TR 4.93ms, TE 1.23ms, FA 15deg, voxel size 4.7x4.7x5mm, base resolution 96 and 3D GRAPPA factor 2. Gadoxetate dose for each scan was 0.025 mL/kg, injected at 1mL/sec and followed by a 20mL flush of saline.
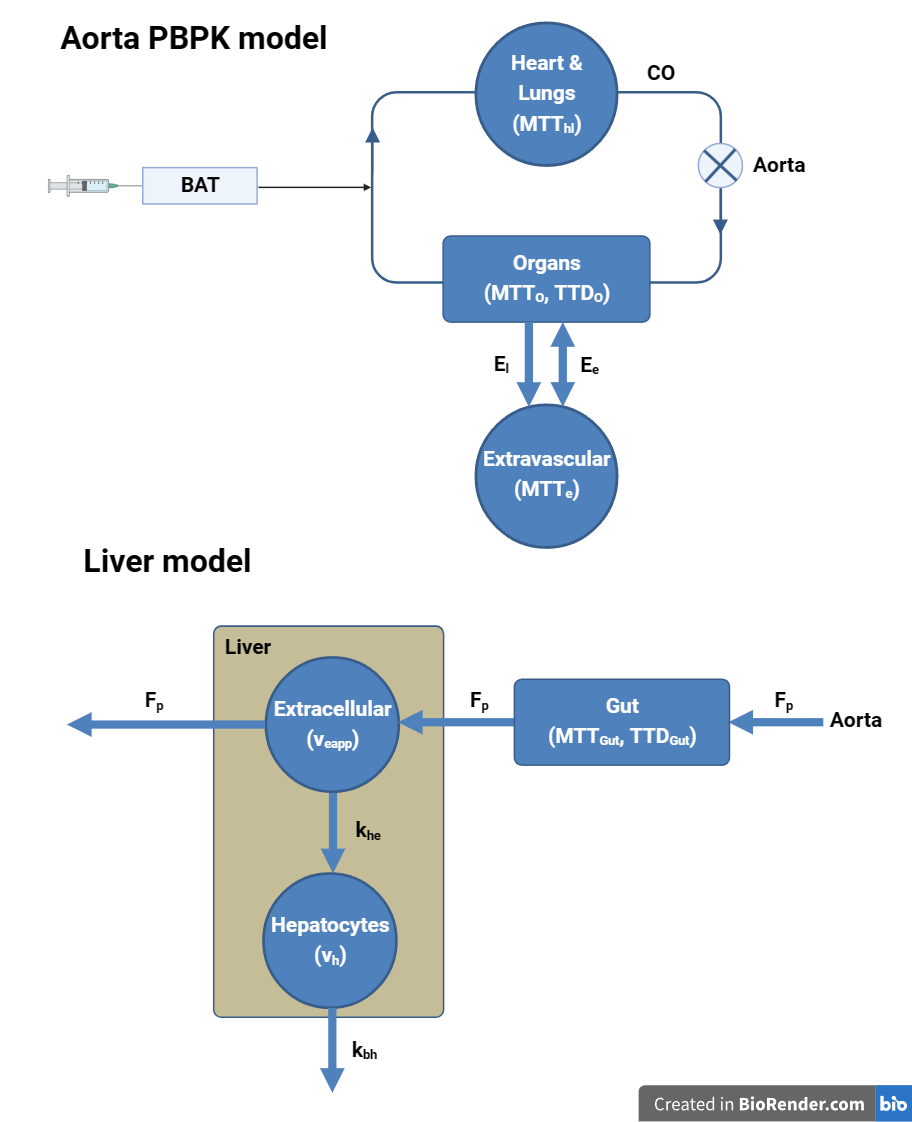
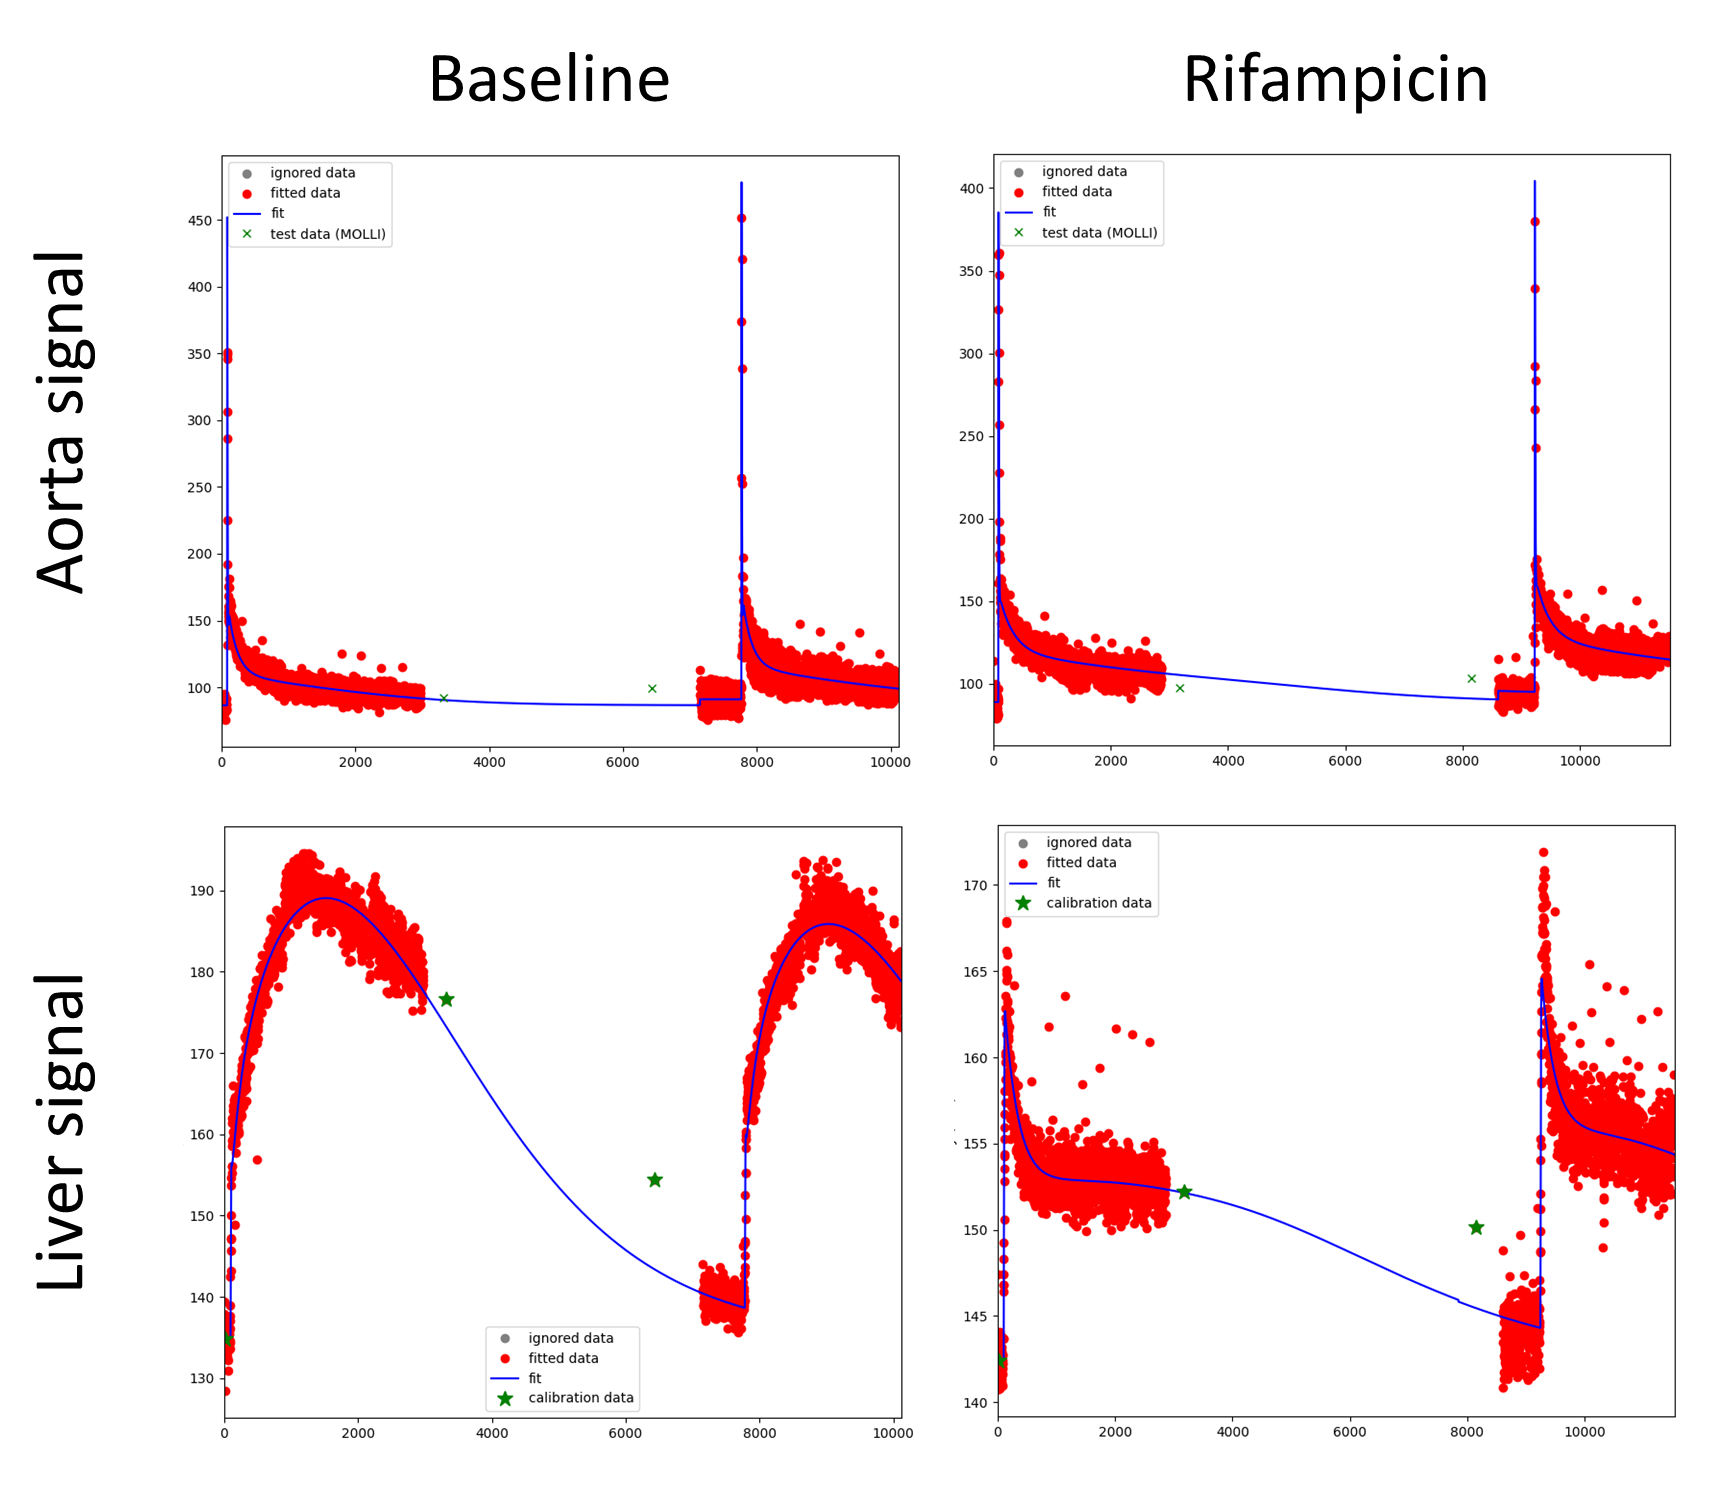
MRI processing: 3D deformable motion correction was applied and whole liver and aorta were segmented manually on a peak-enhancement map. Aorta concentrations were modelled using a simplified whole-body compartment model (fig 1, top). Liver concentrations were modelled with a two-compartment filtration model, allowing for a linear change in uptake and excretion rates throughout the day (fig 1, bottom). Relaxation rates were derived from the concentrations using MOLLI T1 and literature values for plasma and hepatocyte relaxivities [3]. The MRI signal was modelled using the steady-state signal model for a spoiled gradient-echo sequence. The forward model was fitted directly to the measured aorta and liver signals.
Data analysis: The primary outcome was the rifampicin effect size in uptake rate k_he and excretion rate k_bh. The data were also used to test whether the scan time could be reduced without affecting the results, by repeating the fit after changing the acquisition time from 3 to 45 minutes in steps of 1 minute.
RESULTS
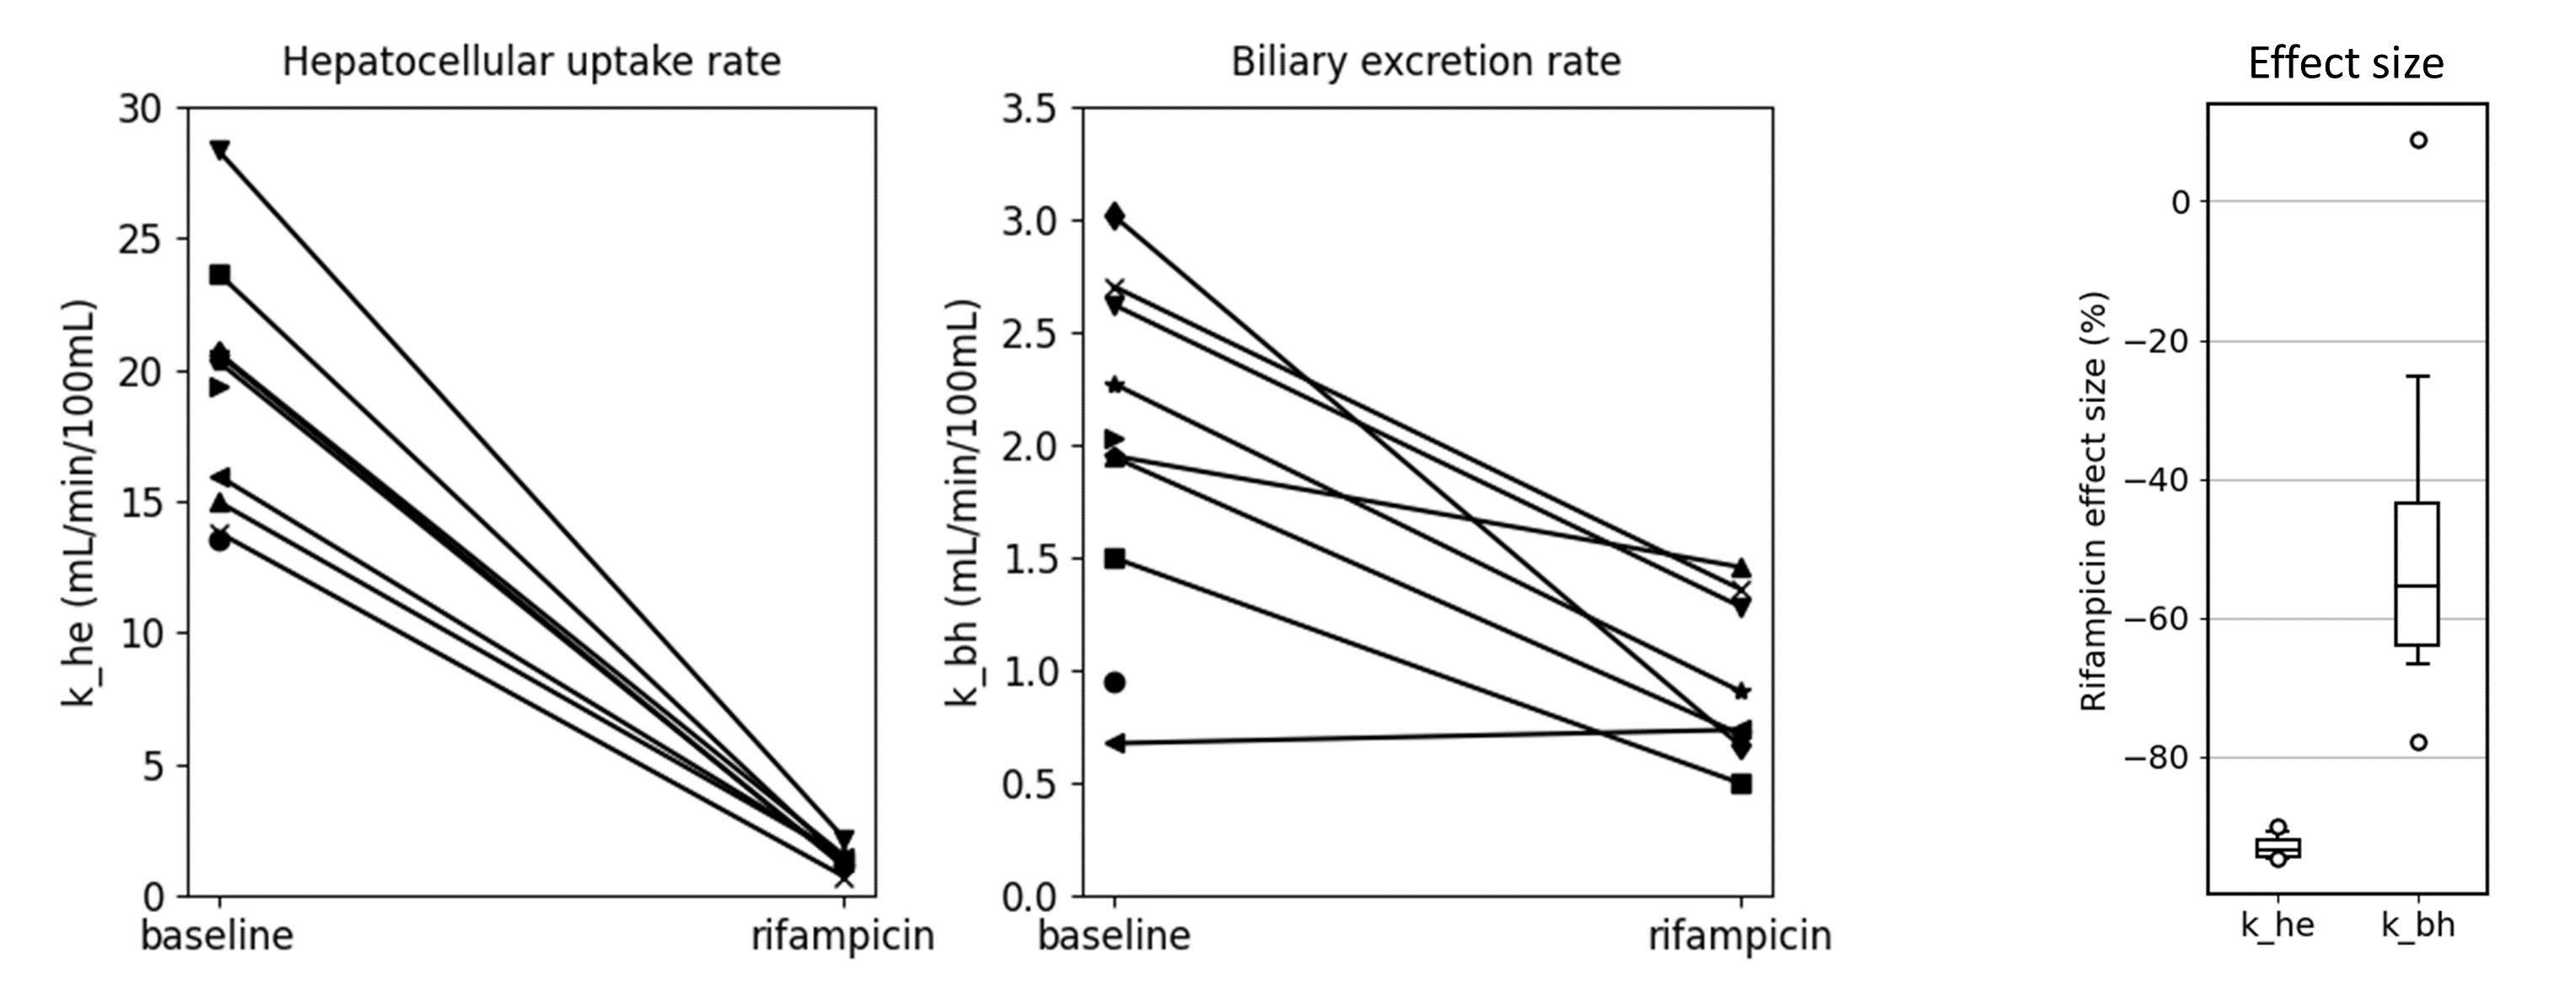
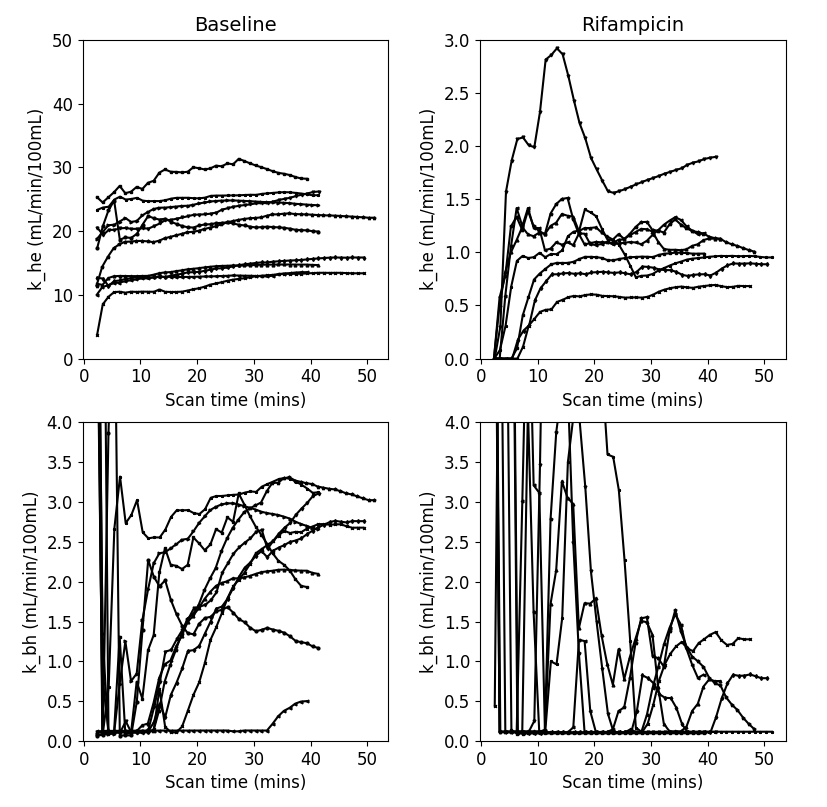
Eight volunteers completed all scan sessions, and two volunteers only successfully completed the baseline scan. A visual inspection of the data showed clear kinetic differences after rifampicin, with much reduced uptake and slower elimination (Figure 2).Primary objective (Figure 2): On average, rifampicin reduced the hepatocellular uptake rate by 93% (p<0.001), and the effect was very consistent between volunteers (stdev 1.8%). The biliary excretion rate reduced by 48% (p<0.001) and the effect was more variable (stdev 28%). Both rate constants dropped in each individual, with the exception of one k_bh which was low at baseline and remained unchanged with rifampicin.
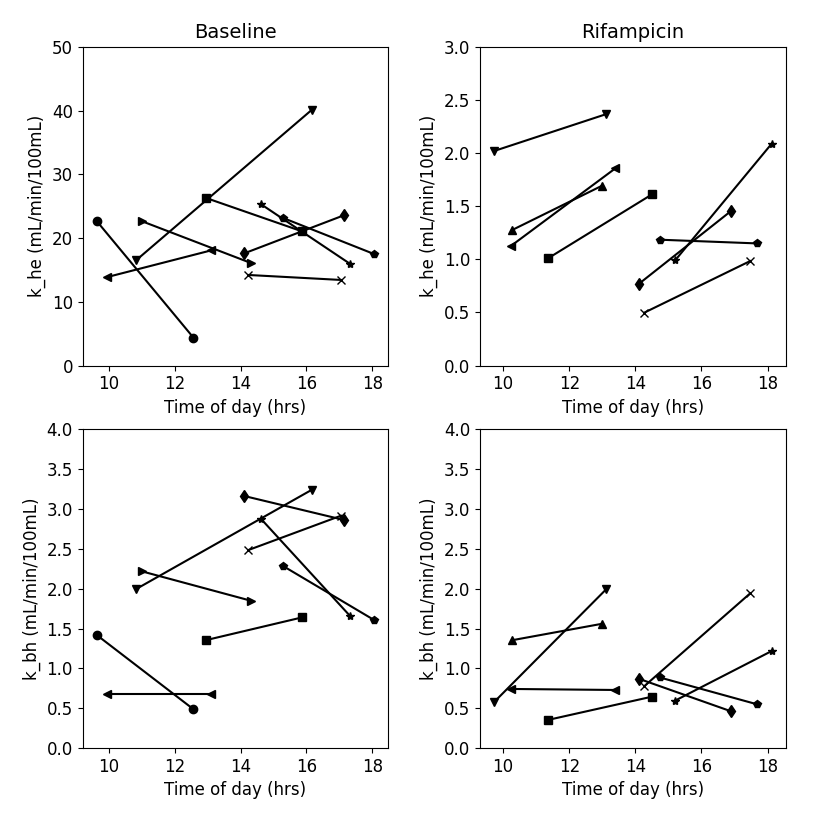
Secondary objectives: The data revealed substantial variations in liver function during the day with k_he after rifampicin consistently increasing between the two scans (Figure 3). Changing the acquisition times confirmed that the full scan time was needed to measure k_bh with confidence (Figure 4). For applications where only k_he is of interest, the scan time can be reduced to 15-20 minutes.
CONCLUSION
Liver uptake and excretion rates as measured with dynamic gadoxetate-enhanced MRI and the assay proposed in this study are able to robustly characterise inhibition of gadoxetate liver uptake and excretion by rifampicin, confirming translation of previous findings in rats [2] to humans.The size of the effect and the consistency between subjects is greater than previously observed in rats, suggesting that the assay is sufficiently sensitive to differentiate between different levels of inhibition. Measurement of hepatocellular uptake, but not biliary excretion, is also robust with a shorter protocol feasible in clinical routine.
Acknowledgements
The research leading to these results received funding from the Innovative Medicines Initiatives 2 Joint Undertaking under grant agreement No 116106. This Joint Undertaking receives support from the European Union’s Horizon 2020 research and innovation programme and EFPIA.References
[1] Kenna, J.G. et al. (2018). Noninvasive Preclinical and Clinical Imaging of Liver Transporter Function Relevant to Drug-Induced Liver Injury. In: Chen, M., Will, Y. (eds) Drug-Induced Liver Toxicity. Methods in Pharmacology and Toxicology. Humana, New York, NY. https://doi.org/10.1007/978-1-4939-7677-5_30
[2] Melillo, N. et al. (2023). Use of In Vivo Imaging and Physiologically-Based Kinetic Modelling to Predict Hepatic Transporter Mediated Drug–Drug Interactions in Rats. Pharmaceutics 15 (3): 10.3390.
[3] Ziemian, S. et al. (2020). Ex vivo gadoxetate relaxivities in rat liver tissue and blood at five magnetic field strengths from 1.41 to 7 T. NMR Biomed; 34(1):e4401.
Figures