4008
Measurement of pancreas graft temperature during cold preservation in MR scanner1Department of Medical Physics, Uppsala University Hospital, Uppsala, Sweden, 2Department of Immunology, Genetics and Pathology, Uppsala University, Uppsala, Sweden
Synopsis
Keywords: Pancreas, Thermometry, pancreas graft, MR spectroscopy, hypothermic storage, temperature
Motivation: Phosphorus (31P) and proton (1H) MRS are methods of choice in assessment of pancreas graft quality before transplantation. Since MR scanning can increase the temperature of the pancreas graft, measurement of the graft temperature is desirable.
Goal(s): The aim of this study was to investigate if it is possible to measure pancreas graft temperature in MR scanner using 1H-MRS.
Approach: Single-voxel 1H-MRS. Temperature constants were obtained by calibration experiments with the water-vegetable oil phantom.
Results: The present study has shown that 1H-MRS is able to measure the graft temperature during MR scanning.
Impact: 1H-MRS is able to measure the pancreas graft temperature during MR scanning. The temperature is computed from the chemical shift difference between water spectral line and methylene (CH2)n line originating from the pancreatic adipocytes.
Introduction
Transplantation of pancreas or islets of Langerhans are the effective treatments for patients suffering type 1 or 2 diabetes. However, the pancreas is regarded as one of the most challenging organs for recovery and transplantation. The objective assessment of pancreas graft quality is the key factor of success in transplantation. The aim of such evaluation methods is to predict either pancreas donor utilization or graft failure. Possible methods of choice are phosphorus (31P)1,2 and proton (1H) magnetic resonance spectroscopy (MRS)3,4. During the transport and MR scanning hypothermic storage (4±2 oC) and sterile conditions need to be maintained. Since MR scanning can increase the temperature of the pancreas graft, measurement of the graft temperature is desirable. The aim of this study was to investigate if it is possible to measure pancreas graft temperature in MR scanner using 1H-MRS.Methods
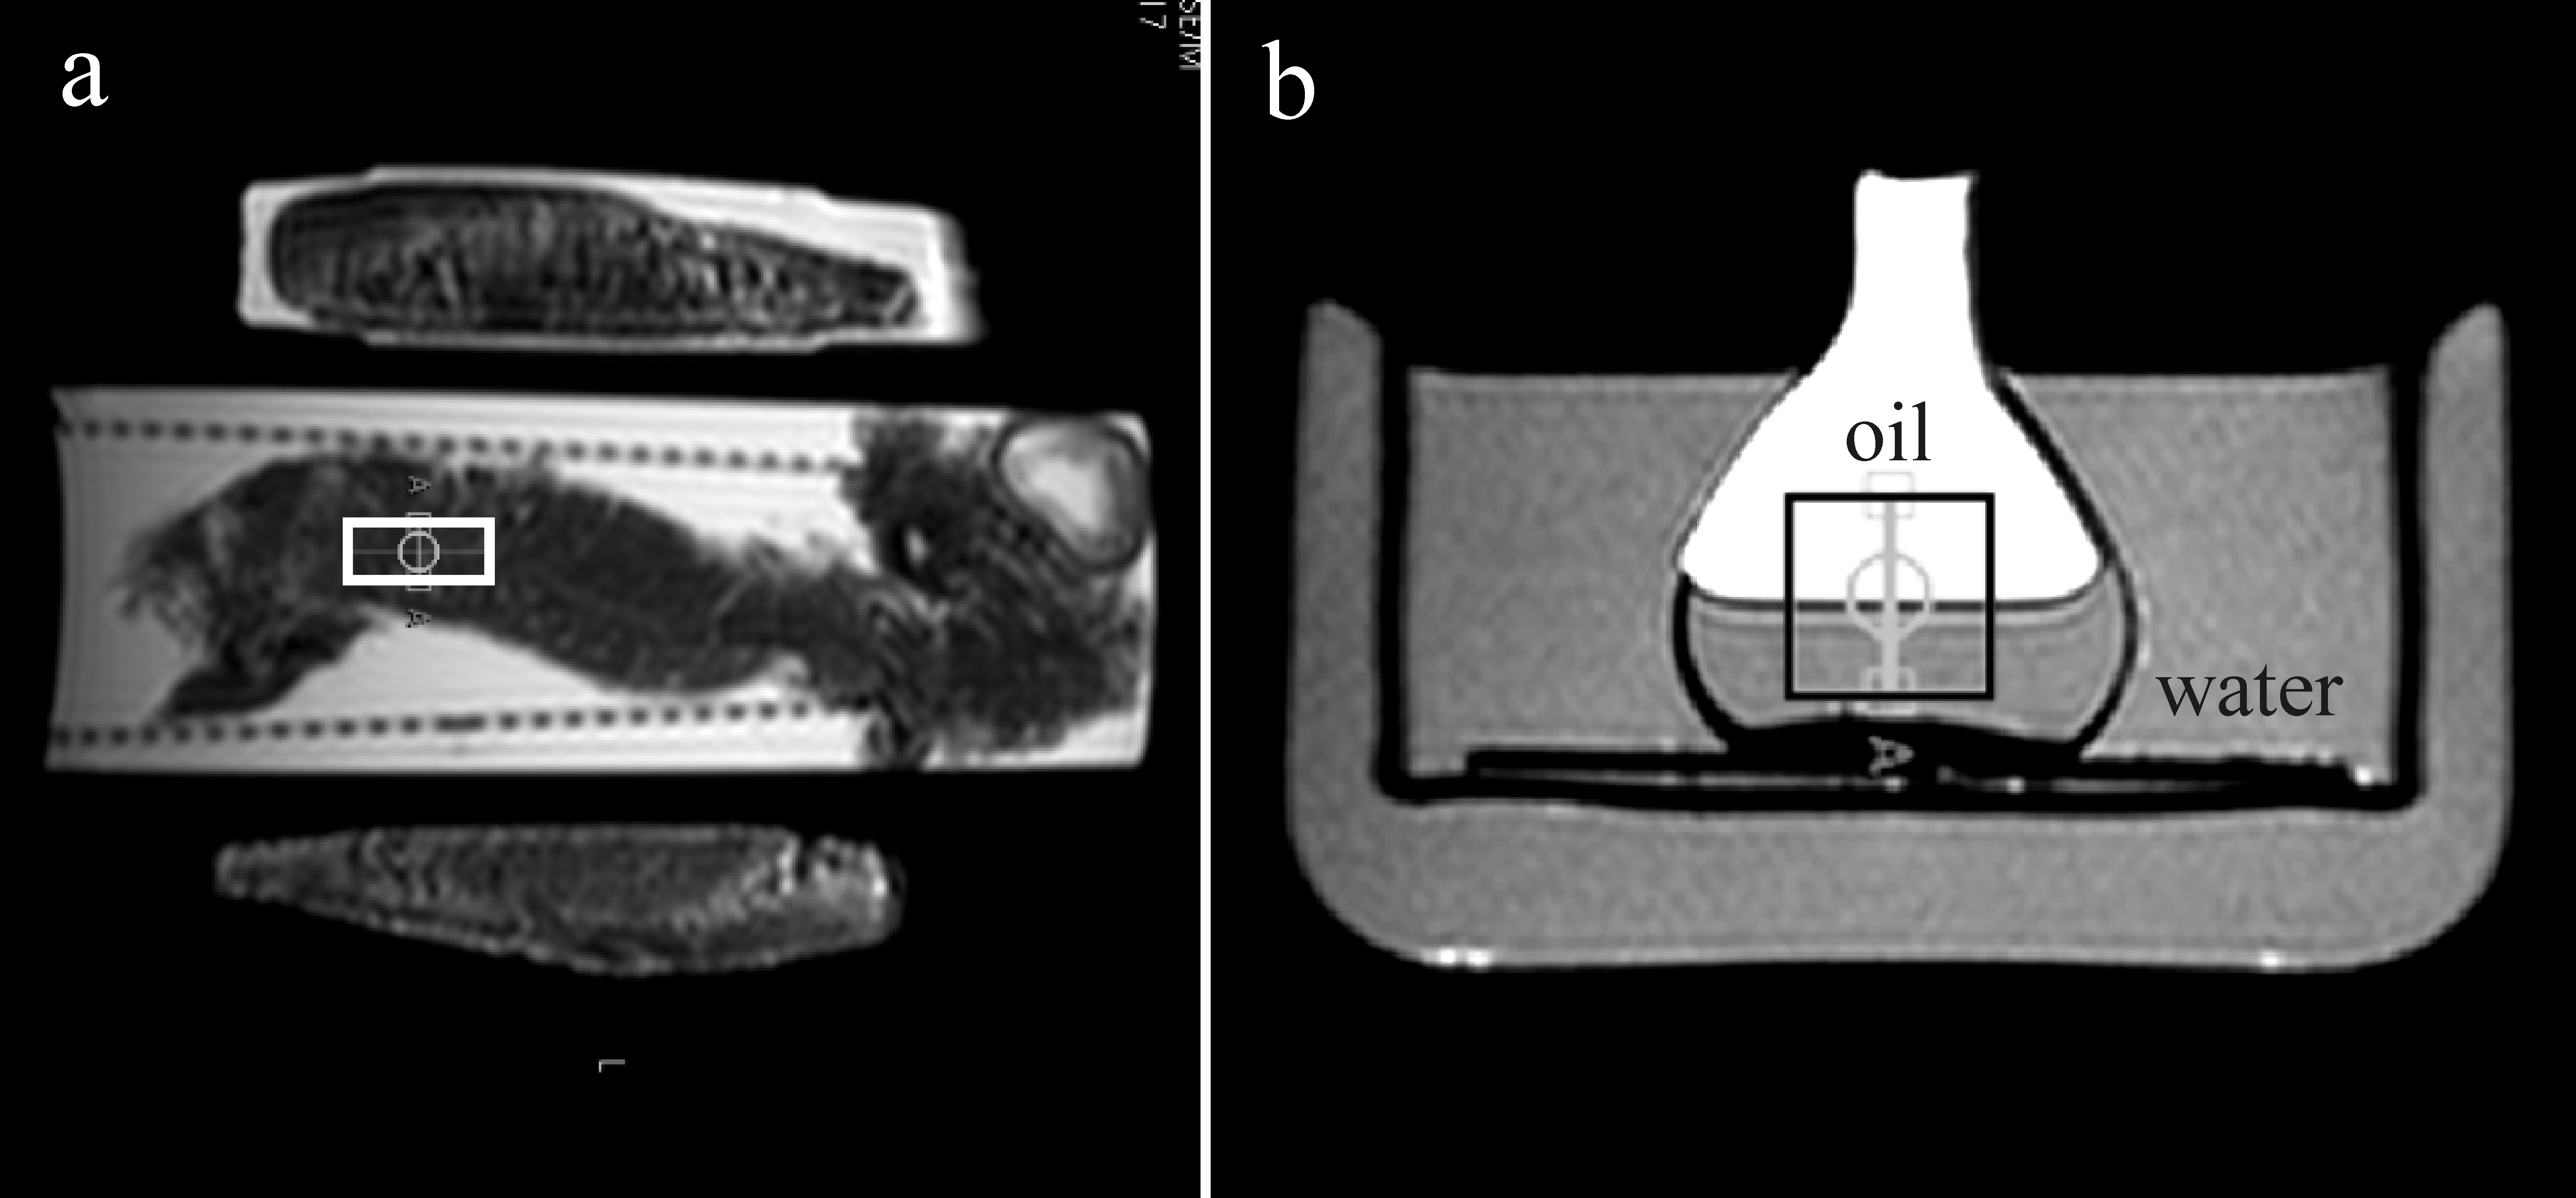
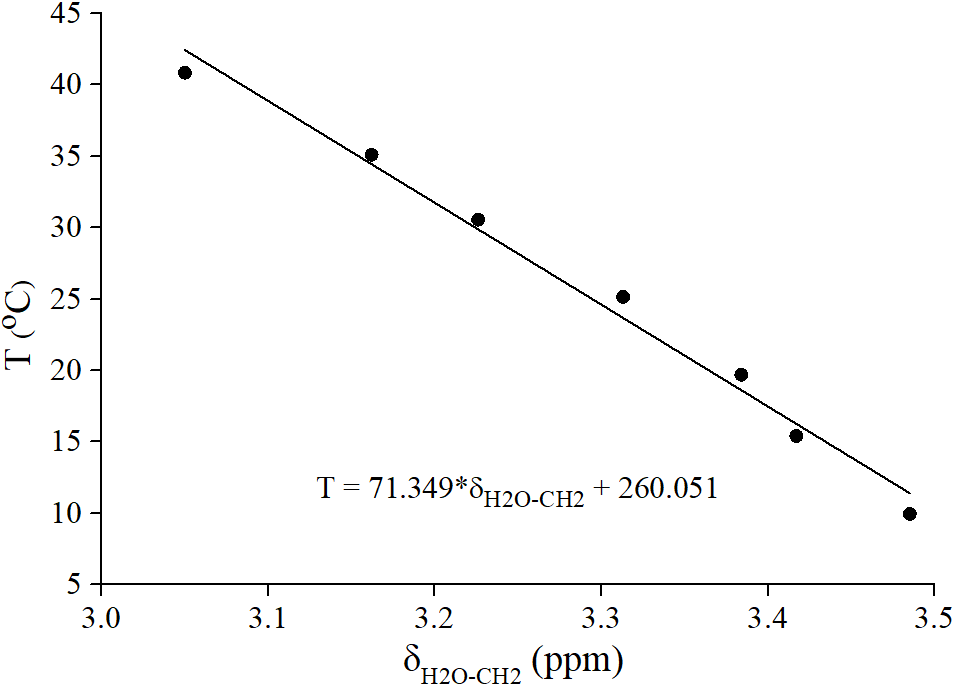
Pancreas grafts from 10 human donors (4 female) were included in this study. Median donor age and body mass index were 65.5 years (range: 24-82), and 26.8 kg/m2 (range: 22.2-31.9), respectively. Organ donation was performed solely for research purposes. The study was approved by The Regional Ethics Committee. Each pancreas was perfused in-situ with histidine-tryptophan-ketoglutarate (HTK) solution and placed into a transport container filled with HTK solution and cooled by ice packs. The air (pancreas graft) temperature inside the transport package was 4.6±0.7 oC (range: 3.5-5.9) at the time of delivery to our laboratory, i.e. immediately before MR scanning. It was not possible to open transport container and to measure temperature of the pancreas by conventional sensors due strict requirement for sterility. MR experiments were performed on a 1.5 T scanner (Philips, Achieva) using transmit-receiver head coil. Single-voxel MRS acquisitions of pancreas were performed using PRESS sequence (TR/TE 5000/30 ms, BW 1000 Hz, 1024 time domain points). Figure 1a shows voxel (10x10x25 mm3) position. Four dummy excitations were followed by 16 non-water-suppressed and 64 water-suppressed scans. 1H-MRS temperature calibration was performed using the phantom contained vegetable oil (sunflower) and water. Phantom was heated and cooled in thermally insulated water bath (Fig. 1b). Warming/cooling of the water bath was performed with thermostatically controlled water flowing through the walls of the glass cylinder. Seven PRESS acquisitions (TR/TE 2000/80 ms, 16 non-water-suppressed, 48 water-suppressed scans) at the thermal equilibrium were performed over a temperature range of 10-41 oC. The phantom temperature was measured with the precision ±0.1 oC using a Pt-100 probe. The linear regression analysis (Fig. 2) was performed between the temperature T and water-vegetable oil ((CH2)n line) chemical shift difference δH2O-CH2. The equation of regression line was used to compute the temperature of pancreas graft. Graft was measured in its original, unopened plastic transport container. During scanning was hypothermic storage maintained by cooling ice elements in thermally insulated box (Fig. 1a). Spectral intensities were fitted in the time domain by AMARES/MRUI algorithm. Prior knowledge used for fitting the pancreas lipid signals originating from adipocytes (AD) and intracellular lipids (IC) of non-adipose pancreatic cells was described elsewhere5,6.Results and discussion
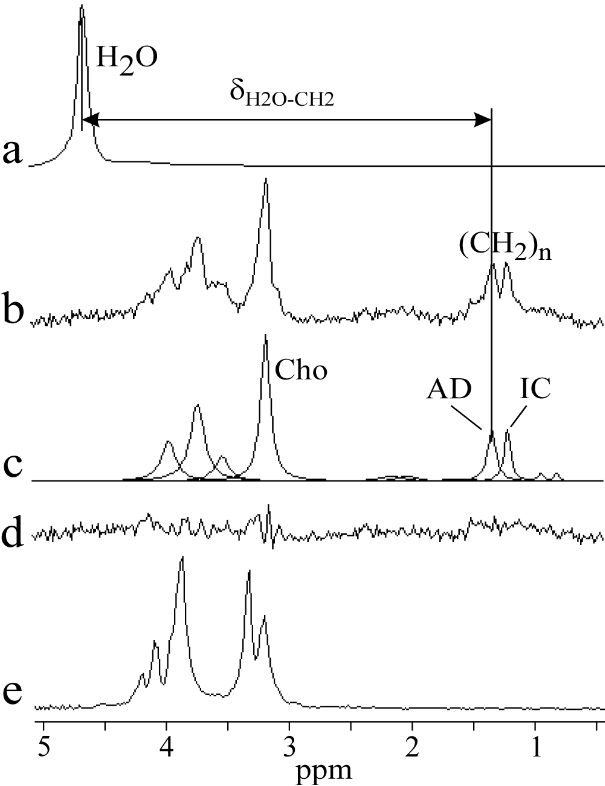
Linear regression analysis yielded the temperature (oC) relationship: T= -71.349(±3.683)*δH2O-CH2 + 260.051(±12.133) (Fig. 2). The representative pancreas graft spectrum and spectrum of HTK solution are shown in Fig. 3. Pancreas graft temperature was computed from the chemical shift difference between temperature depended water resonance and a temperature independent (significant less dependent) reference methylene line (CH2)n originating from the pancreatic adipocytes (AD). It should be noted that total choline (Cho) resonance at 3.2 ppm was not possible to used as the temperature reference because of overlapping by spectral lines of HTK solution (histidine) (Fig. 3). Two spectra were discarded because of insufficient shimming results and one spectrum was excluded due to failure in fitting of (CH2)n resonances of adipocytes. Mean temperature of remained seven pancreas grafts was 3.6±1.3 oC (range: 2.0-5.7). This result is in line with the grafts temperature 4.6±0.7 oC (range: 3.5-5.9) at the time of delivery to our hospital. Mean water/fat (CH2)n spectral intensity ratio of considered seven pancreas grafts was 1.5±1.6% (range: 0.2-4.7).Conclusion
We have demonstrated that the temperature of pancreas graft in MR scanner can be measured by means of 1H-MRS and by using the temperature constants obtained by temperature calibration experiments with the water-vegetable oil phantom.Acknowledgements
This work was supported by the Swedish Research Council (VR K2013-64X-08268-26-3, 921-2014-7054 (KBF), K2015- 54X-12219-19-4), the Nordic Insulin Fund, the Diabetes Wellness foundation, the Ernfors Family Fund, Barn Diabetes Fonden, the Swedish Diabetes Association and the Juvenile Diabetes Foundation International (17-2012-540). Human pancreases were obtained from The Nordic network for Clinical islet Transplantation, supported by the Swedish national strategic research initiative EXODIAB (Excellence of Diabetes Research in Sweden) and the Juvenile Diabetes Research Foundation.References
1. Scott WE, Weegman BP, Ferrer-Fabrega J, et al. Pancreas oxygen persufflation increases ATP levels as shown by nuclear magnetic resonance. Transplant Proc. 2010;42:2011-2015.
2. Carlbom L, Weis J, Johansson L, et al. Pre-transplantation 31P-magnetic resonance spectroscopy for quality assessment of human pancreatic grafts – A feasibility study. Magn Reson Imag. 2017;39:98-102.
3. Tushuizen ME, Bunck MC, Pouwels PJ, et al. Pancreatic fat content and b-cell function in men with and without type 2 diabetes. Diabetes Care. 2007;30:2916-2921.
4. Lingvay I, Esser V, Legendre JL, et al. Noninvasive quantification of pancreatic fat content in humans. J Clin Endocrinol Metab. 2009;94:4070-4076.
5. Weis J, Johansson L, Ortiz-Nieto F, Ahlström H. Assessment of lipids in skeletal muscle by LCModel and AMARES. J Magn Reson Imag. 2009; 30:1124-1129.
6. Weis J, Ahlström H, Korsgren O. Proton MR spectroscopy of human pancreas allografts. MAGMA. 2019;32:511-517.
Figures