4004
Investigation of clinical applicability of multi-parametric 4D-MRI for radiotherapy in liver cancer1Institute of Medical Technology, Peking University Health Science Center, Beijing, China, 2Key Laboratory of Carcinogenesis and Translational Research (Ministry of Education / Beijing), Department of Radiation Oncology, Peking University Cancer Hospital & Institute, Beijing Cancer Hospital & Institute, Beijing, China, 3MR Scientific Marketing, Digital Imaging, Siemens Healthineers Ltd, Beijing,China, Beijing, China, 4Department of Health Technology and Informatics, The Hong Kong Polytechnic University, Hong Kong SAR, Hong Kong, China
Synopsis
Keywords: Cancer, Cancer
Motivation: Although many methods for generating 4D-MRI have been studied, there are few clinical applications for radiotherapy based on 4D-MRI.
Goal(s): To investigate the clinical potential of multi-parametric 4D-MRI in liver cancer radiotherapy.
Approach: Target contours were delineated on the planning CT with assisted by 3D-MRI and multi-parametric 4D-MRI. Clinical plans were designed based on these contours respectively. Target volume and contours in three different hepatic lobes and target dose were compared and evaluated.
Results: 3D image-guided target delineation may be more likely to underestimate target volume and compromise dose coverage.
Impact: Multi-parametric 4D-MRI can be applied in clinical radiotherapy, which provides more accurate target delineation and dose coverage.
Objective
To investigate the clinical potential of multi-parametric four-dimensional magnetic resonance imaging (4D-MRI) in liver cancer radiotherapy.Methods
Twenty patients underwent planning CT, contrast-enhanced T1-weighted, T2-weighted 3D-MRI, and low-quality 4D-MRI using the TWIST-VIBE sequence. A dual-supervised deformation estimation model was used to generate multi-parametric 4D-MRI from low-quality 4D-MRI and the prior images. Assisted by 3D-MRI and multi-parametric 4D-MRI, target contours were delineated on the planning CT, yielding Target_3D and Target_4D. Clinical plans, Plan_3D and Plan_4D, were designed based on these contours respectively. To explore the dosimetric variations resulting from different contours without re-optimization, Plan_3D was directly applied to Target_4D, and Plan_4D was applied to Target_3D to generate Plan_3D' and Plan_4D' respectively. Target volume, contours, dose-volume histograms, conformity index (CI), homogeneity index (HI), maximum and mean dose to organ as risks (OARs) were compared and evaluated.Results
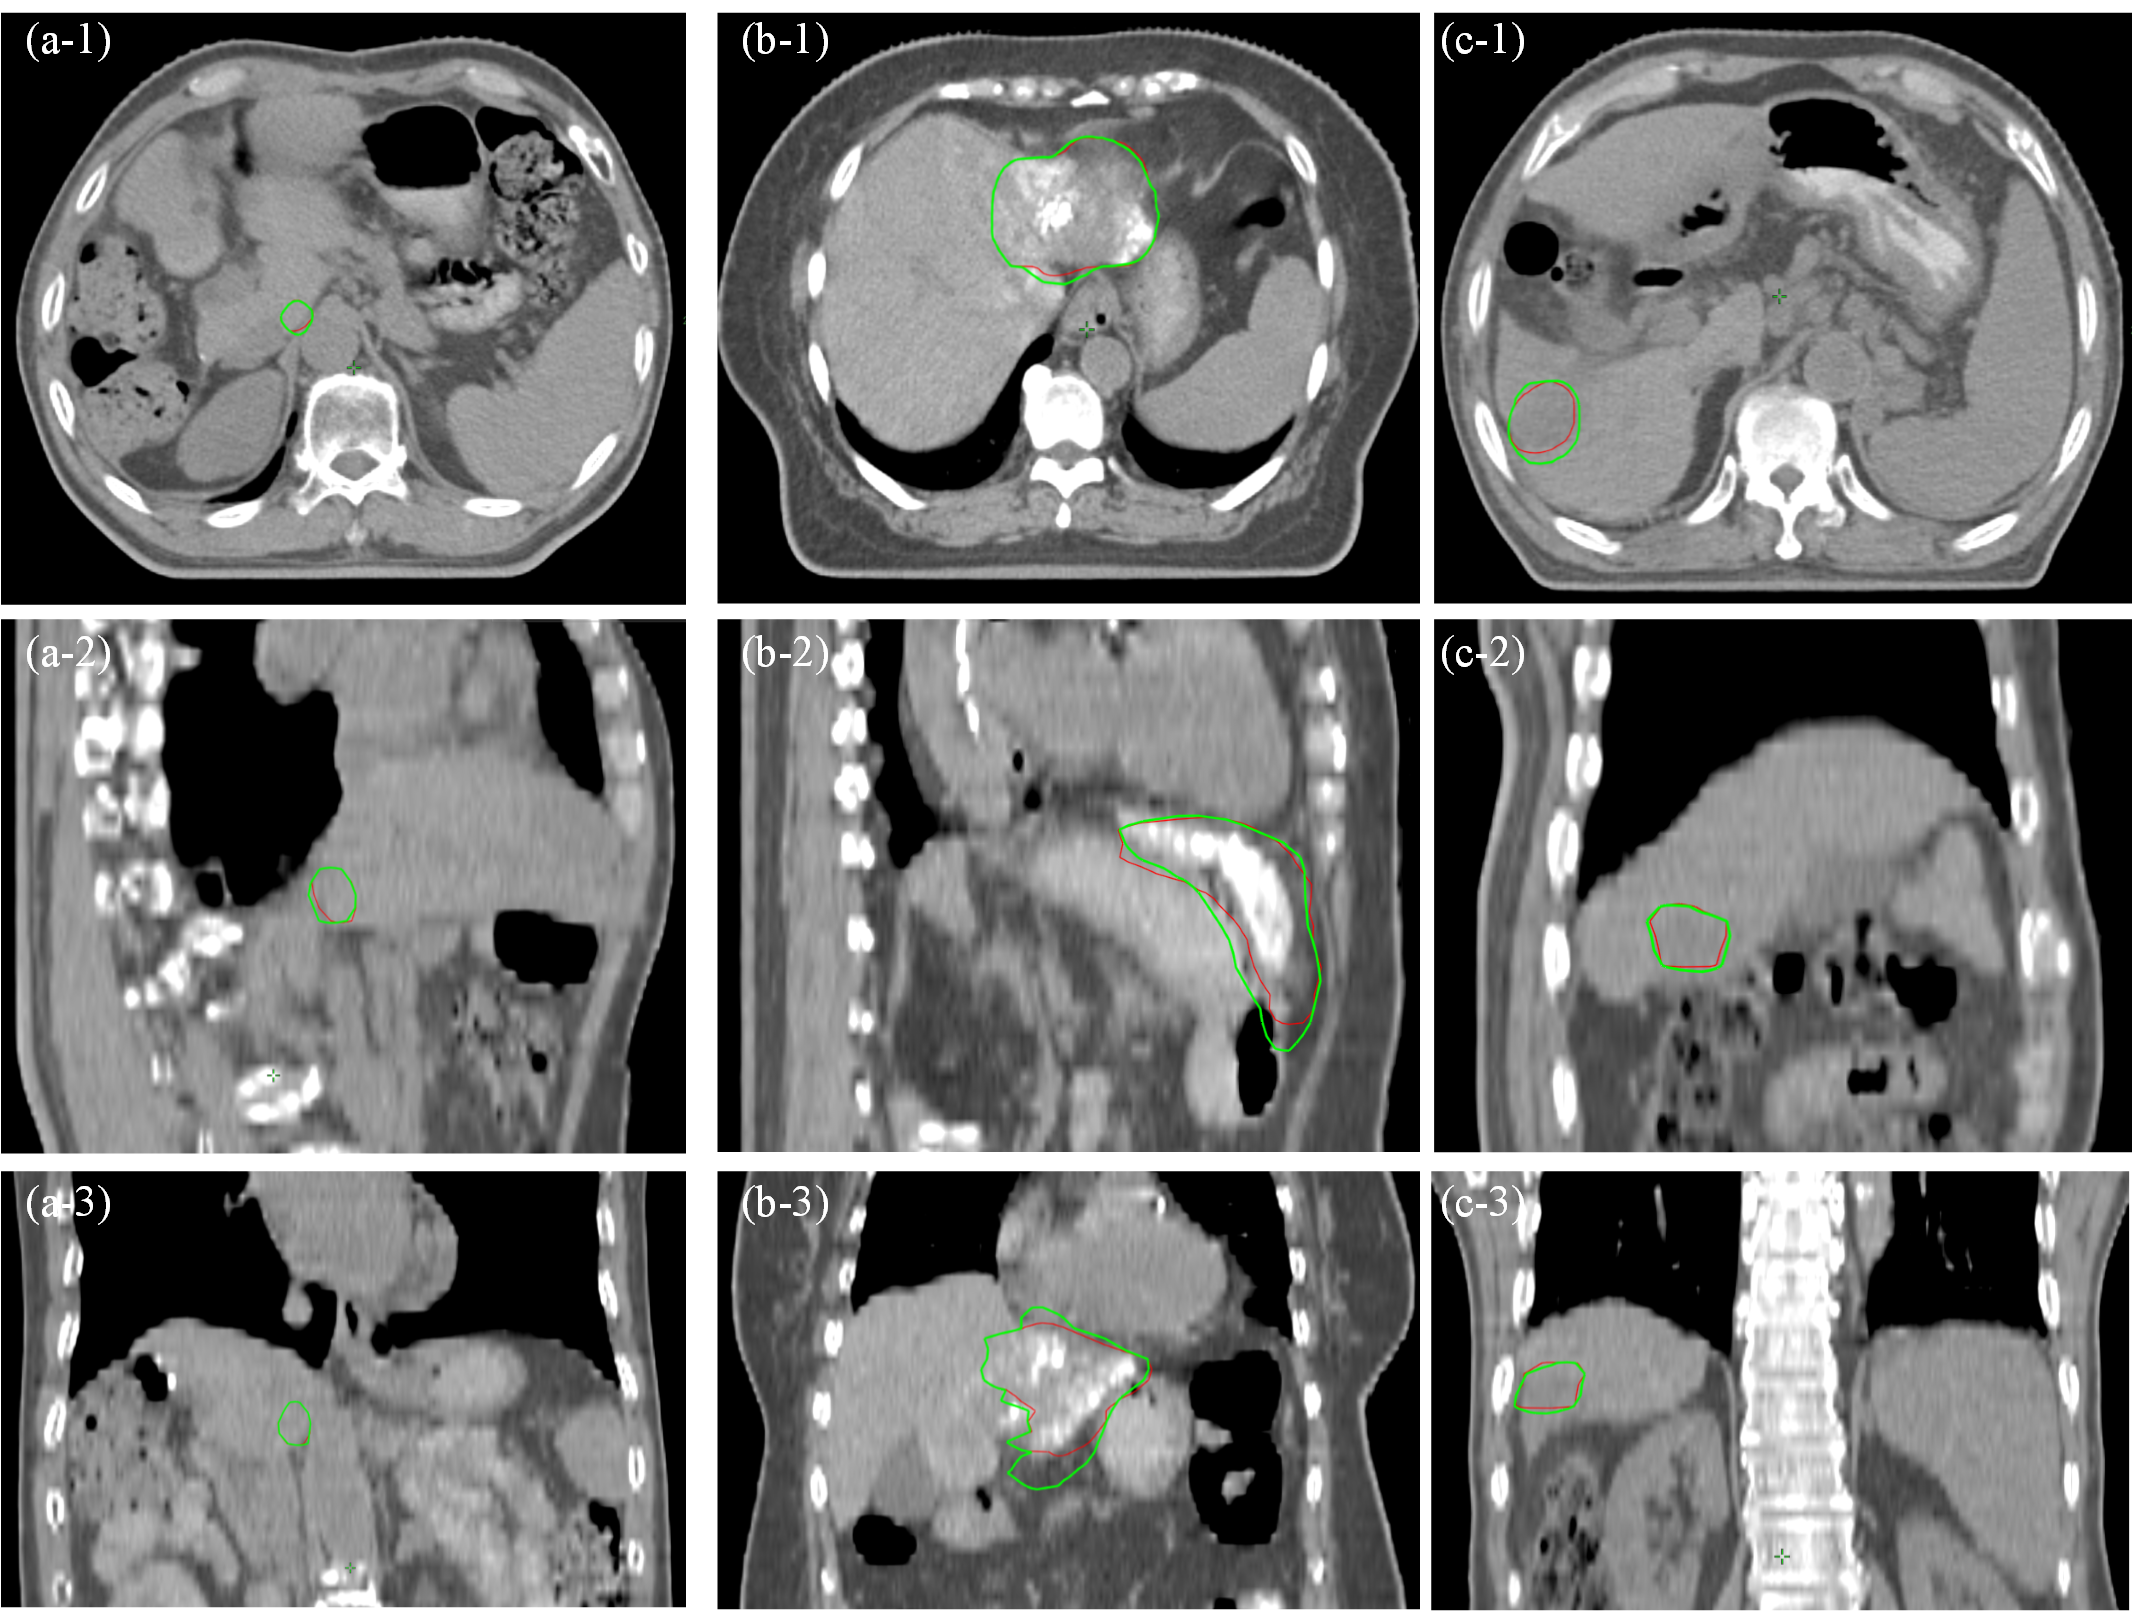
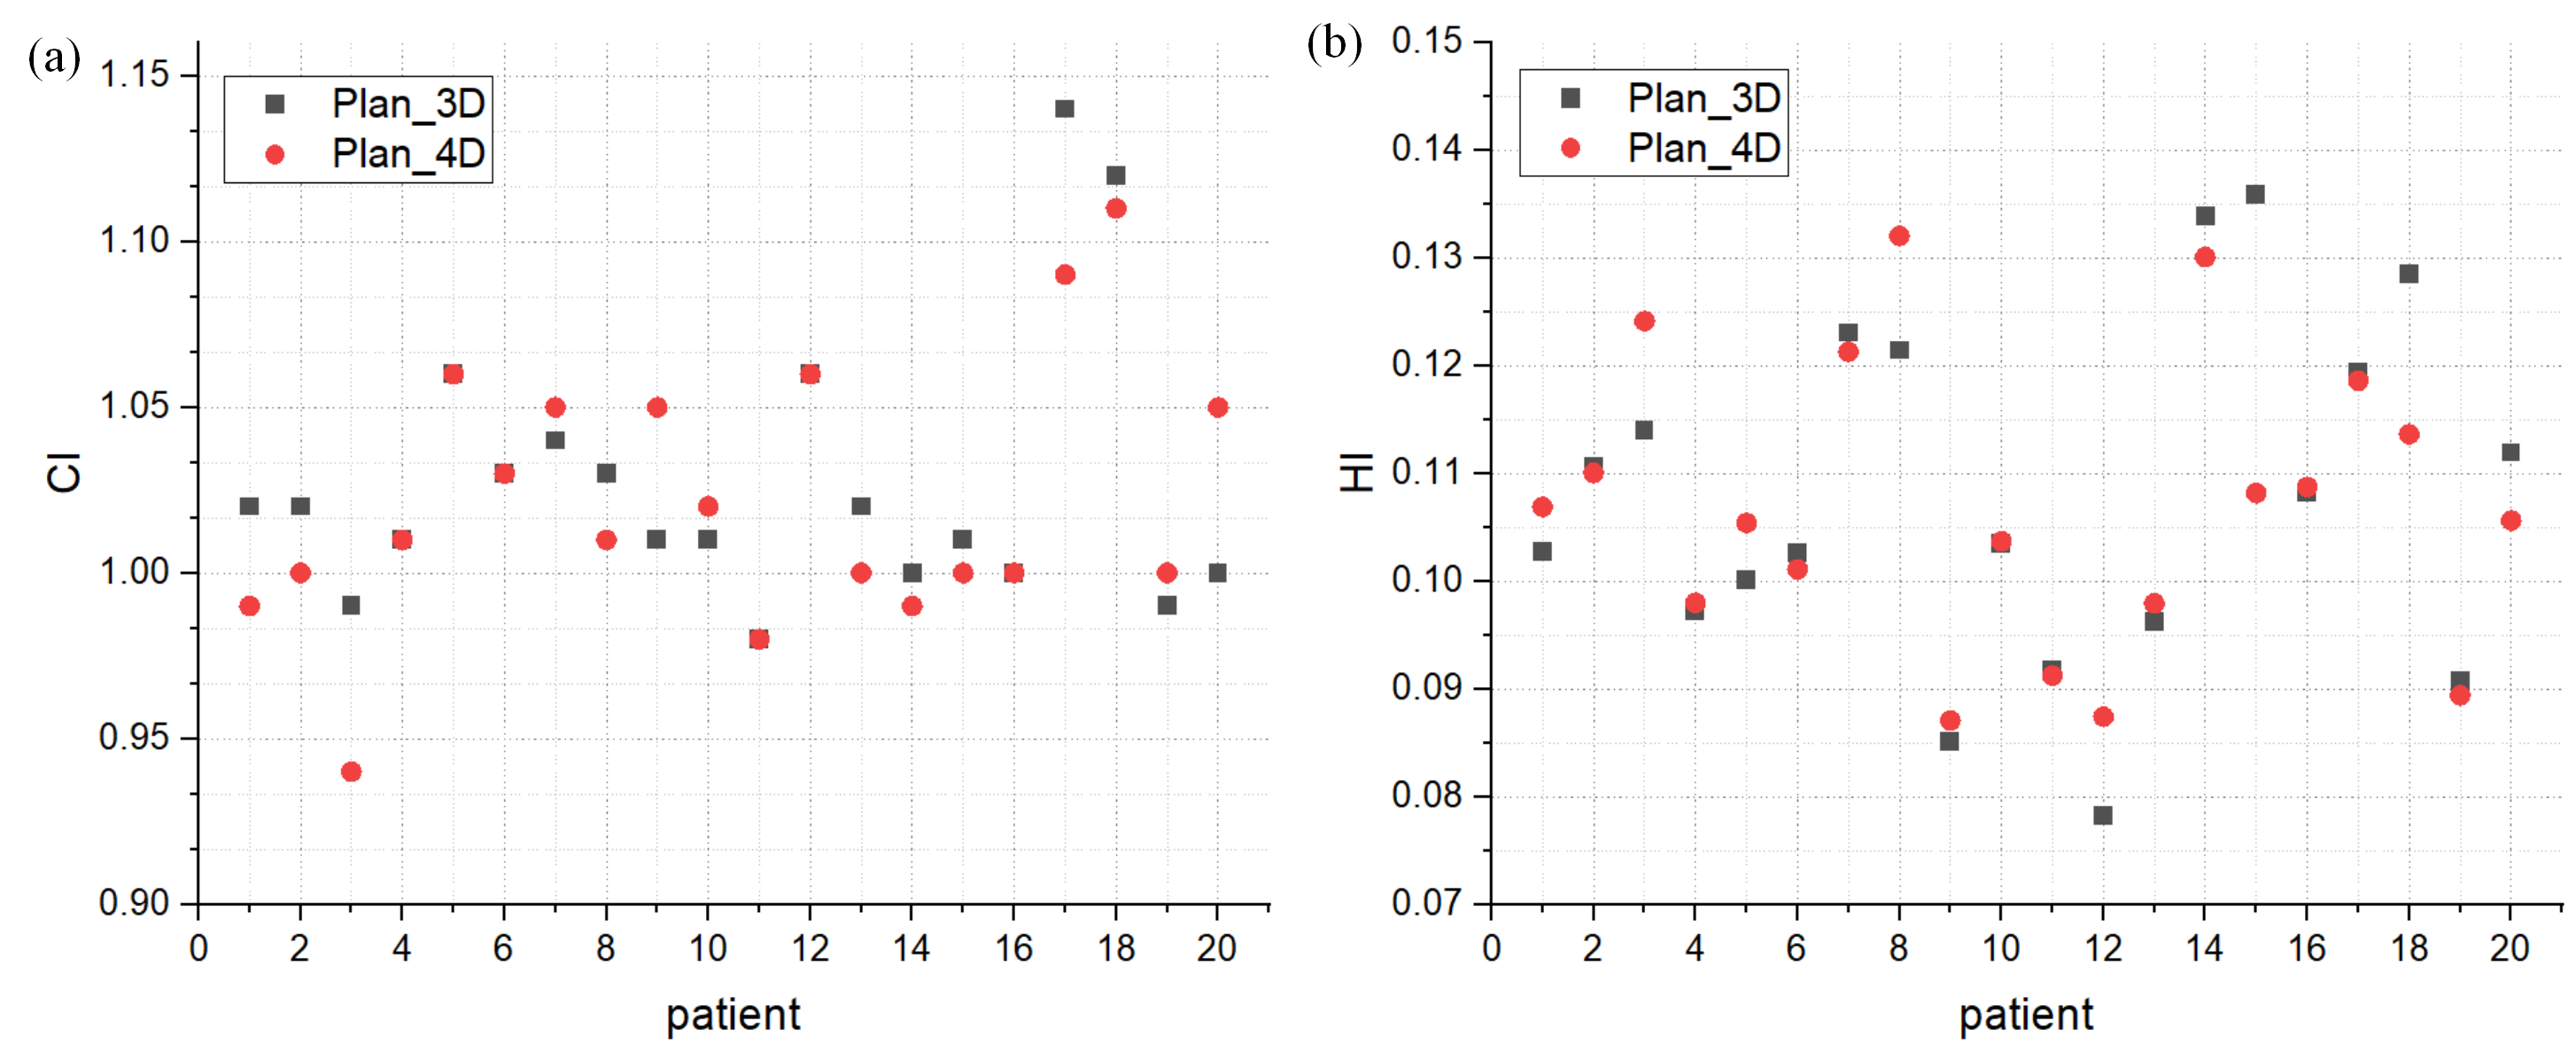
Tumors are positioned in the caudate lobe for 2 patients, while 3 patients have tumors in the left hepatic lobe, and 15 patients exhibit tumor growth in the right hepatic lobe (Figure 1). Mean volume differences between Target_3D and Target_4D were 2.76 cm3 (standard deviation [SD] 3.42 cm3) in the caudate lobe (Figure 2a), 181.54 cm3 (SD 68.50 cm3) in the left hepatic lobe (Figure 2b), and 26.08 cm3 (SD 20.52 cm3) in the right hepatic lobe (Figure 2c). Mean and SD of CI and HI is 1.02±0.04 and 0.108±0.02 in Plan_3D, 1.02±0.01 and 0.107±0.01 in Plan_4D (Figure 4). There were no statistically significant differences in OAR doses between Plan_3D and Plan_3D', between Plan_4D and Plan_4D' (Figure 3). However, a statistically significant difference in target dose was observed between Plan_3D and Plan_3D' (P = 1.47×10⁻⁷) and between Plan_4D and Plan_4D' (P = 0.013). Plan_3D' meets 100% of the prescription dose covering mean 77.89% (SD 10.13%) of the target volume, while Plan_4D' covered mean 94.17% (SD 3.12%) of the target volume. This suggests that the 3D image-guided target delineation may be more likely to underestimate target volume and compromise dose coverage.Conclusions
This study underscores the clinical potential of multi-parametric 4D-MRI, suggesting enhanced target coverage compared to conventional methods. Larger cohort studies are warranted for further validation.Acknowledgements
No acknowledgement found.References
No reference found.Figures