4002
Elevation of HCC perfusion by diffusion-derived vessel density (DDVD) biomarker: Higher HCC perfusion than earlier IVIM reports.1Department of Imaging and Interventional Radiology, The Chinese University of Hong Kong, Hong Kong, China, 2Department of Radiology, Zhujiang Hospital, Southern Medical University, GuangZhou, China, 3Philips Healthcare, Shanghai, China
Synopsis
Keywords: Liver, Diffusion/other diffusion imaging techniques, diffusion; perfusion; MR imaging
Motivation: HCCs mostly show higher perfusion values compared with the adjacent normal liver tissue. Paradoxically authors reported a decrease IVIM-PF(perfusion fraction) of HCC relative to adjacent liver.
Goal(s): DWI-derived surrogate biomarker DDVD (diffusion-derived vessel density) is a physiological surrogate of the area of micro-vessels per unit tissue area. This study applied DDVD to assess perfusion of HCC.
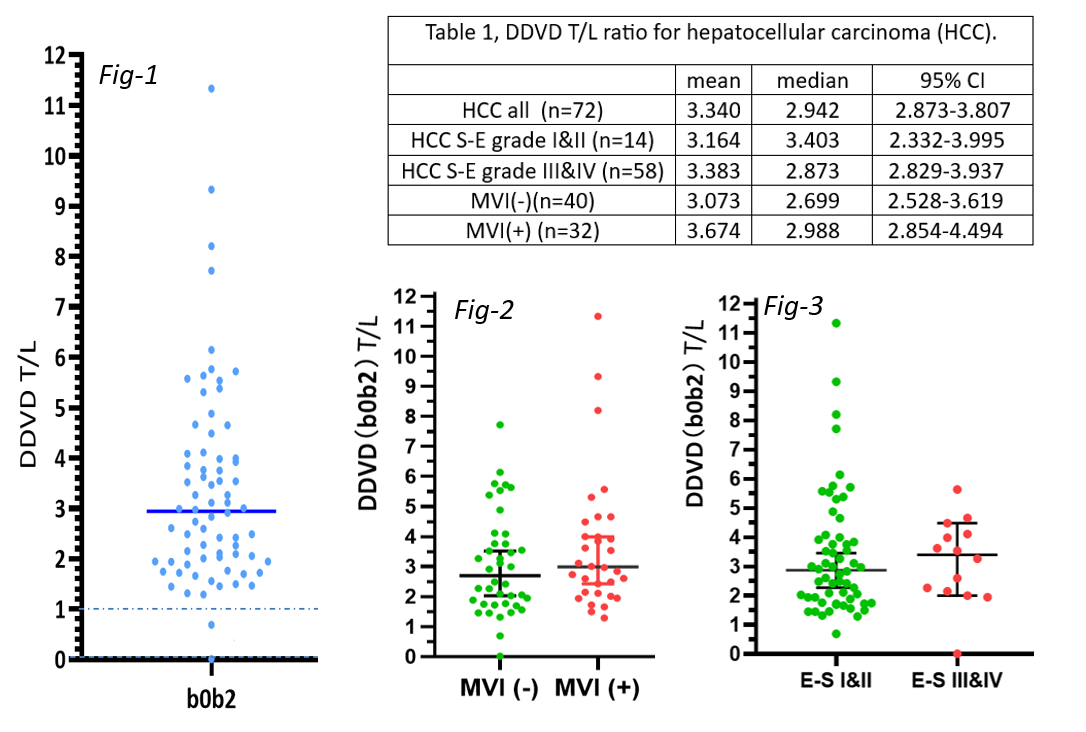
Approach: 72 patients were included. DDVD= (signal intensity at b=0)/ROIarea – (signal intensity at b=2/ROIarea).
Results: (tumor DDVD)/(liver DDVD) was 2.942 (median), majority of HCC showing a much higher DDVD than liver.
Impact: DDVD overcome the pitfalls associated with IVIM PF.
Introduction
Hepatocellular carcinomas (HCCs) mostly show higher perfusion values compared with the adjacent normal liver tissue. With CT perfusion, Sahani et al. [1] measured blood flow (ml/100g/min) and blood volume (ml/100g) to be 92.8± 88.6 and 4.9 ±3.5 for hepatocellular carcinomas (HCCs), whereas 14.9± 2.8, and 2.6 ±0.9 for background liver. With perfusion MRI, Abdullah et al. [2] reported normalized total perfusion (ml/100g/min) of HCC to corresponding tumor free liver to be 4.0 (range: 0.5–16.5). With perfusion MRI, Pahwa et al. [3]reported contrast distribution value was 49.0 ± 20.5% for HCC and 29.4 ± 8.3 % for liver tissue. With perfusion CT, Ippolito et al. [4] reported median tissue blood volume (mL/100 g) was 20.4 for HCC and 10.9 for cirrhotic liver parenchyma. IVIM has been applied to evaluate perfusion component of HCC. Paradoxically, most authors, such as Penner et al. [5], Zhu et al. [6] , Woo et al. [7], Shan et al. [8], Hectors et al. [9], reported a decrease IVIM-PF(perfusion fraction) of HCC relative to adjacent liver. DWI-derived surrogate biomarker DDVD (diffusion-derived vessel density) is a physiological surrogate of the area of micro-vessels per unit tissue area. This study applied DDVD to assess perfusion of HCC.Materials and Methods
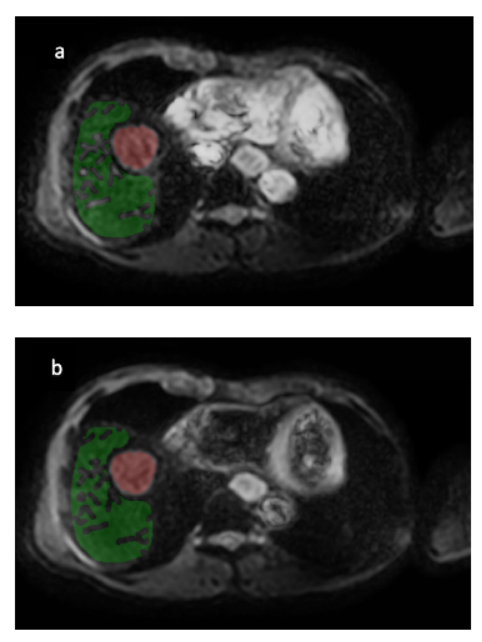
The conduct of the study was approved by the local institutional ethical committee, and informed consent was obtained for all study subjects. MR imaging was performed with a 3.0-T magnet (Philips Healthcare). The diffusion imaging was based on a single-shot spin-echo type echo-planar sequence. Diffusion images with 2 b-values of 0, 2 s/mm2 were acquired. The TR was 313 ms and the TE was 38 ms. Other parameters included voxel = 3×3×7 mm3, inter-slice gap 0.7 mm, NEX = 2 and number of slices = 10. The included slices were focused on the liver tumor. Breath-hold was applied in all scan participants. 72 patients were included in the analysis. Among the included patients, 32 patients had microvascular invasion [MVI(+)] and 40 patients did not have microvascular invasion [MVI(-)]; 58 patients were Edmondson-Steiner (E-S) grade I or II, and 14 patients were E-S grade III or IV. Measurement was conducted on the axial slice which showed the largest HHC size, and if multiple tumors existed, only the largest tumor was measured. DDVD measure followed earlier descriptions [10, 11]. The same DDVD measurement was conducted for HCC(Figure 1). HCC and its border were initially identified on standard anatomical images, ROI excluded necrotic areas if exited.DDVD(b0b2)= (signal intensity at b=0)/ROI_area– (signal intensity at b=2/ROI_area). [unit: arbitrary unit (au)/pixel] (1)
DDVD(b0b2) T/L = [HCC DDVD(b0b2)]/ [ liver DDVD(b0b2)] (2)
Results
For the HCC included for DDVD analysis, diameters varied between 10.5 mm to 110.4 mm, with a mean diameter of 41.3 mm. The results are shown in table-1, Figures 2, 3, 4. Majority of HCC showing a much higher DDVD than the adjacent liver tissue. A weak trend (p>0.05) was noted with poorly differentiated groups HCCs (E-S grades III&IV) had higher DDVD T/L than that of the better differentiated groups HCCs (E-S grades I&II), and a weak trend was (p>0.05) noted with MVI(+) HCCs had higher DDVD T/L than that of MVI(-) HCCs.Discussion
Consistent with earlier pathohistological studies results and contrast agent dynamically enhanced CT/MRI data, this study demonstrated higher blood volume in HCC relative to native liver tissue. The median DDVD(b0b2) T/L approximately agrees with contrast agent dynamically enhanced CT/MRI data. The analysis of DDVD required only 2 b-values (with one being b=0 s/mm2) allows a significantly shorter scanning time than the IVIM protocol. This protocol can be completed within a signal breath-hold duration, which renders it useful when the target organ is subject to respiratory motion. Our study results differ from earlier IVIM study results where HCC PF was paradoxically lowered relative to native liver tissue. Recently Ma and Wang noted that the elongation of T2 relaxation time of HCC can lead to under-estimation of PF if the conventional IVIM formula is used to calculate IVIM parameter [12]. Jerome et al. [13] proposed a T2 extend IVIM model to correct this phenomenon, but this model requires IVIM data acquisition to run multiple times with varying TEs. This would lead to excessively long data acquisition in clinical settings. Moreover, whether T2 extend IVIM model can lend PF measure consistent with physiological measure in every organ has not been evaluated yet [12].Acknowledgements
No acknowledgement found.References
1. Sahani DV, et al. Radiology. 2007;243:736-43. 2. 6. Abdullah SS, et al. JMRI 2008;28(2):390-5. 3. Pahwa S, et al. Sci Rep. 2018;8:4990. 4. Ippolito D, et al. Eur Radiol. 2012;22:803-11. 5. Penner AH, et al. Eur Radiol. 2013;23:2773-83. 6. Zhu L, et al. Acta Radiol. 2015;56:1411-8. 7. Woo S, et al. Radiology. 2014;270:758-67. 8. Shan Y, et al. JCAT 2015;39:709-15. 9. Hectors SJ, et al. JMRI 2016;44:856-64. 10. Xiao BH, et al. SLAS Technol. 2020;25:474-483. 11. He J, et al. Hypertension. 2023;80:1658-1667. 12. Ma and Wang. QIMS. QIMS-23-1437. 13. Jerome NP, et al. Phys Med Biol. 2016;61:N667-N680.Figures