3995
Quantitative MRI to evaluate the efficacy of immunotargeted therapy in unresectable hepatocellular carcinoma1Department of Radiology, The First Affiliated Hospital of Guangxi Medical University, NanNing, China, 2Department of Radiology, The People’s Hospital of Guangxi Zhuang Autonomous Region, NanNing, China, 3Philips Healthcare, Guangzhou, China, 4Department of Radiology, The First Affiliated Hospital of Guangxi Medical University, Nanning, China
Synopsis
Keywords: Liver, MR Value, Hepatocellular Carcinoma; immunotargeted therapy; MRI; Quantitative parameters
Motivation: Quantitative MRI maybe helpful for evaluating the immunotargeted therapy efficacy in unresectable HCC.
Goal(s): To investigate the feasibility of quantitative MRI parameters for evaluating the immunotargeted therapy efficacy in unresectable HCC
Approach: Statistics analysis was used to study the alterations in patients with unresectable HCC at baseline and 2 months, 4 monthsafter immunotherapy
Results: The ADC value of HCC increased,the longest diameter of HCC initially increased and then decreased. The ADC value and ΔT1% of HCC target lesions in partial response group increased significantly. In progressive disease group, the ΔT1% of HCC target lesions decreased significantly, and ADC values showed a downward trend.
Impact: This is the first report to evaluate the immunotargeted therapy in unresectable HCC using quantitative MRI techniques.
Introduction
The primary liver cancer is the fourth most common cause of cancer-related death in the world.Immunotherapy has opened up a new situation in the systemic treatment of hepatocellular carcinoma (HCC).Previous studies have shown that DWI can evaluate the response after systemic treatment of HCC, and the ADC value increases after successful treatment of the lesion.Measuring the T1 relaxation time of the liver parenchyma before and after Gd-EOB-DTPA enhanced can quantitatively assess the uptake of Gd-EOB-DTPA, thereby reflecting liver function.
The purpose of this study was to investigate the feasibility of magnetic resonance DWI and Gd-EOB-DTPA-enhanced MRI T1mapping imaging to evaluate the efficacy of immunotargeted therapy in unresectable HCC, and to find the optimal imaging method for efficacy evaluation.
Methods
Twenty-eight patients(age range: 37-77 years, mean age: 54.05±12.44 years) were included in the study. DWI and Gd-EOB-DTPA enhanced MRI T1mapping were performed on a 3.0T scanner every 2 months following the baseline and immunotargeted therapy.DWI was acquired with the following parameters: TR /TE : 8200/66 ms; FOV: 420 × 420 mm2; matrix was 148 × 118; slice thickness: 4 mm, b values (50, 500, and 800 s/mm2). T1mapping images were scanned before and 20 mins after Gd-EOB-DTPA administration with the following parameters: TR/TE: 4.8/1.4 ms; FOV: 350 × 350 mm2; matrix:224 × 320; slice thickness: 4.5 mm. ADC, T1mapping s were measured in two target tumors according to RECIST criteria.The T1mapping reduction rate (ΔT1%) was calculated as follows: ΔT1% = 100%×(T1pre−T1post)/T1pre, where T1pre was the T1mapping value before Gd-EOB-DTPA enhancement, and T1post was the T1mapping value in the hepatobiliary phase 20 min after enhancement.
The longest diameter of the tumor was measured at the largest cross-section of the tumor according to RECISTv1.1 criteria.The longest tumor diameter, ADC value and ΔT1% of partial response group, stable disease group and progressive disease group were compared at baseline and follow-up using the Paired-samples t-test.
Results
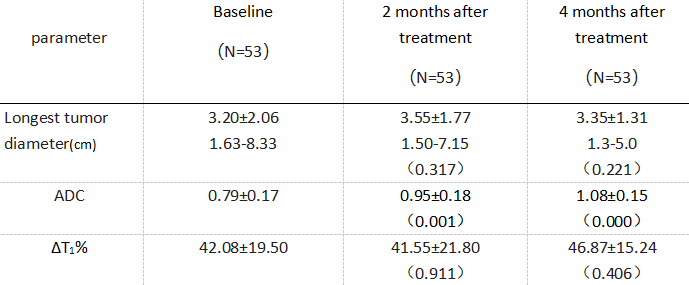
The efficacy evaluation of HCC patients were shown in Figure 1. At 2 months follow-up, the ADC value of tumor increased gradually compared against baseline levels (P<0.05). However, there was no significant difference in tumor longest diameter and ΔT1% (P>0.05) .(Figure 2).According to RECISTv1.1 criteria, the lesions were divided into: 0 for CR(complete response), 9 for PR(partial response), 38 for SD(stable disease), and 6 for PD(progressive disease).
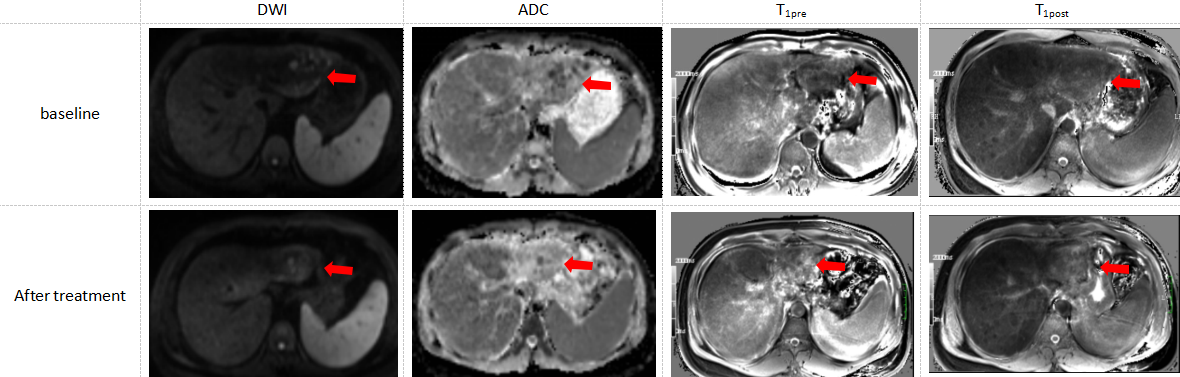
At 4 months follow-up, the results showed that in the PR group, the target tumor shrank, DWI(b=800 s/mm2)decreased, the ADC value significantly increased (P=0.045) , and the ΔT1% significantly increased(P=0.044) , and the longest diameter of the tumor had a decreasing trend.(Figure 3)
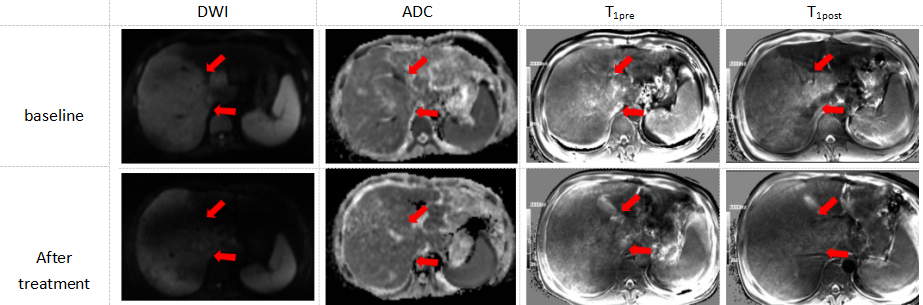
In the SD group, DWI(b=800 s/mm2)decreased,the ADC value significantly increased (P=0.001) , but there no significant difference between ΔT1% and the longest tumor diameter (P>0.05).(Figure 4)In the PD group, the ΔT1% was significantly decreased, (P=0.045).
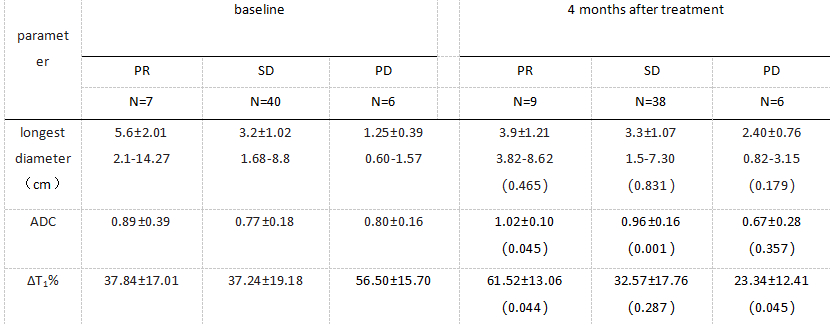
The ADC value showed a downward trend and the longest tumor diameter increased. In addition, the ADC value of PR group and SD group was higher than that of PD group (P<0.05).(Table 5)
Conclusions
Quantitative MRI has demonstrated utility in evaluating the microscopic changes of HCC immunotargeted therapy, and provide more valuable information after therapy.Acknowledgements
No acknowledgement found.References
1. Bray F, Ferlay J, Soerjomataram I, Siegel RL, Torre LA, Jemal A. Global cancer statistics 2018: GLOBOCAN estimates of incidence and mortality worldwide for 36 cancers in 185 countries [published correction appears in CA Cancer J Clin. 2020 Jul;70(4):313]. CA Cancer J Clin. 2018;68(6):394-424. doi:10.3322/caac.21492
2. Lewin M, Fartoux L, Vignaud A, Arrivé L, Menu Y, Rosmorduc O. The diffusion-weighted imaging perfusion fraction f is a potential marker of sorafenib treatment in advanced hepatocellular carcinoma: a pilot study. Eur Radiol. 2011;21(2):281-290. doi:10.1007/s00330-010-1914-4
3. De Robertis R, Tinazzi Martini P, Demozzi E, et al. Prognostication and response assessment in liver and pancreatic tumors: The new imaging. World J Gastroenterol. 2015;21(22):6794-6808. doi:10.3748/wjg.v21.i22.6794
4. Yang L, Ding Y, Rao S, Chen C, Zeng M. T1 Mapping on Gd-EOB-DTPA-Enhanced MRI for the Prediction of Oxaliplatin-Induced Liver Injury in a Mouse Model. J Magn Reson Imaging. 2021;53(3):896-902. doi:10.1002/jmri.27377
Figures
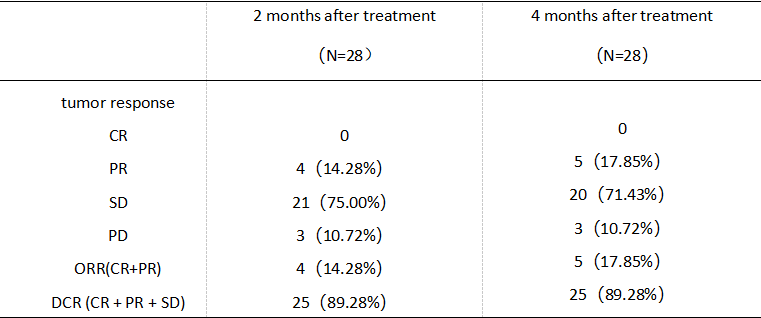
Figure 1. Efficacy evaluation of HCC patients at follow-up.Note. CR: complete response; PR: partial response; SD: stable disease; PD: progressive disease; ORR: objective response rate; DCR: disease control rate.