3994
Detection Limits and Assessment of the Hepatocellular Content of Lipids using Deuterium Metabolic Imaging: a Pilot Study.1Medicine III, Division of Endocrinology and Metabolism, Medical University of Vienna, Vienna, Austria, 2Biomedical Imaging and Image-guided Therapy, High-Field MR Center, Medical University of Vienna, Vienna, Austria
Synopsis
Keywords: Liver, Deuterium, Liver, DMI
Motivation: While HCL can be assessed in vivo using 1H-MRS it may be of interest to determine it with DMI, as this offers the possibility for dynamic studies with incorporation of deuterated substances.
Goal(s): Our goal was to explore the detection limits and estimate HCL based on DMI.
Approach: 10 healthy subjects were measured in a 7T-MR-system with liver adjusted RF surface coil applying a single-voxel 1H-MRS-GUSTEAU sequence and a 2H-MRSI sequence. HCL was assessed by comparison with the water signal from both measurements.
Results: The HCL values were underestimated when applying DMI compared to the well-established 1H-MRS ultra-short echo time GUSTEAU sequence.
Impact: Besides the use of 1H-MRS, HCL can also be assessed with DMI. Due to the much lower natural abundance of 2H compared to 1H, the detection limit for 2H-HCL was estimated to be ≥1%.
Introduction
For the study of hepatic disorders, it is of interest to assess the hepatocellular content of lipids (HCL). A well-established method to do so is single voxel 1H-MRS1. Since 2H-MR spectra incorporate the same metabolites, the question arises whether it is possible to assess HCL from deuterium metabolic imaging (DMI). Nevertheless, the natural abundance of 2H is rather low at 0.0115%, hampering the detection of metabolites other than water2. On the other hand, DMI offers a good MR sensitivity due to short T1 relaxation times and it is relatively immune to magnetic field inhomogeneities because of the lower resonance frequency compared to 1H (6.5x lower)3. The major advantage over 1H is the ability to enrich 2H metabolites by administering 2H-labeled glucose or water, e.g. by oral uptake. Thus, studies can be set up dynamically and changes in 2H metabolite signals may be assessed, which in turn may give a more detailed insight into the metabolism during different interventions.Materials & Methods
10 healthy volunteers (all male, age: 20-35y, BMI: 23.6±3.5) were measured after overnight fasting in a 7T-MR-system (Siemens Healthineers, Erlangen, Germany) using a 1H/2H surface coil (2 2H-channels (27x27cm), STARK CONTRAST MRI Coils Research, Erlangen, Germany) and a 1H/31P surface coil (∅=10cm, Rapid Biomedical, Rimpar, Germany). Subjects were positioned on their right lateral side with the liver centered on top of the RF coil. No breath holding techniques or gating was used.8 individual signals each were acquired with a GUSTEAU sequence (VOI: 3x3x3cm³, TE=6ms, TR=5s) at both the water (0ppm) and the methylene lipid resonances (-3.4ppm) with the 1H-channel of the 1H/31P coil. HCL was calculated according to Gajdošík et al.1
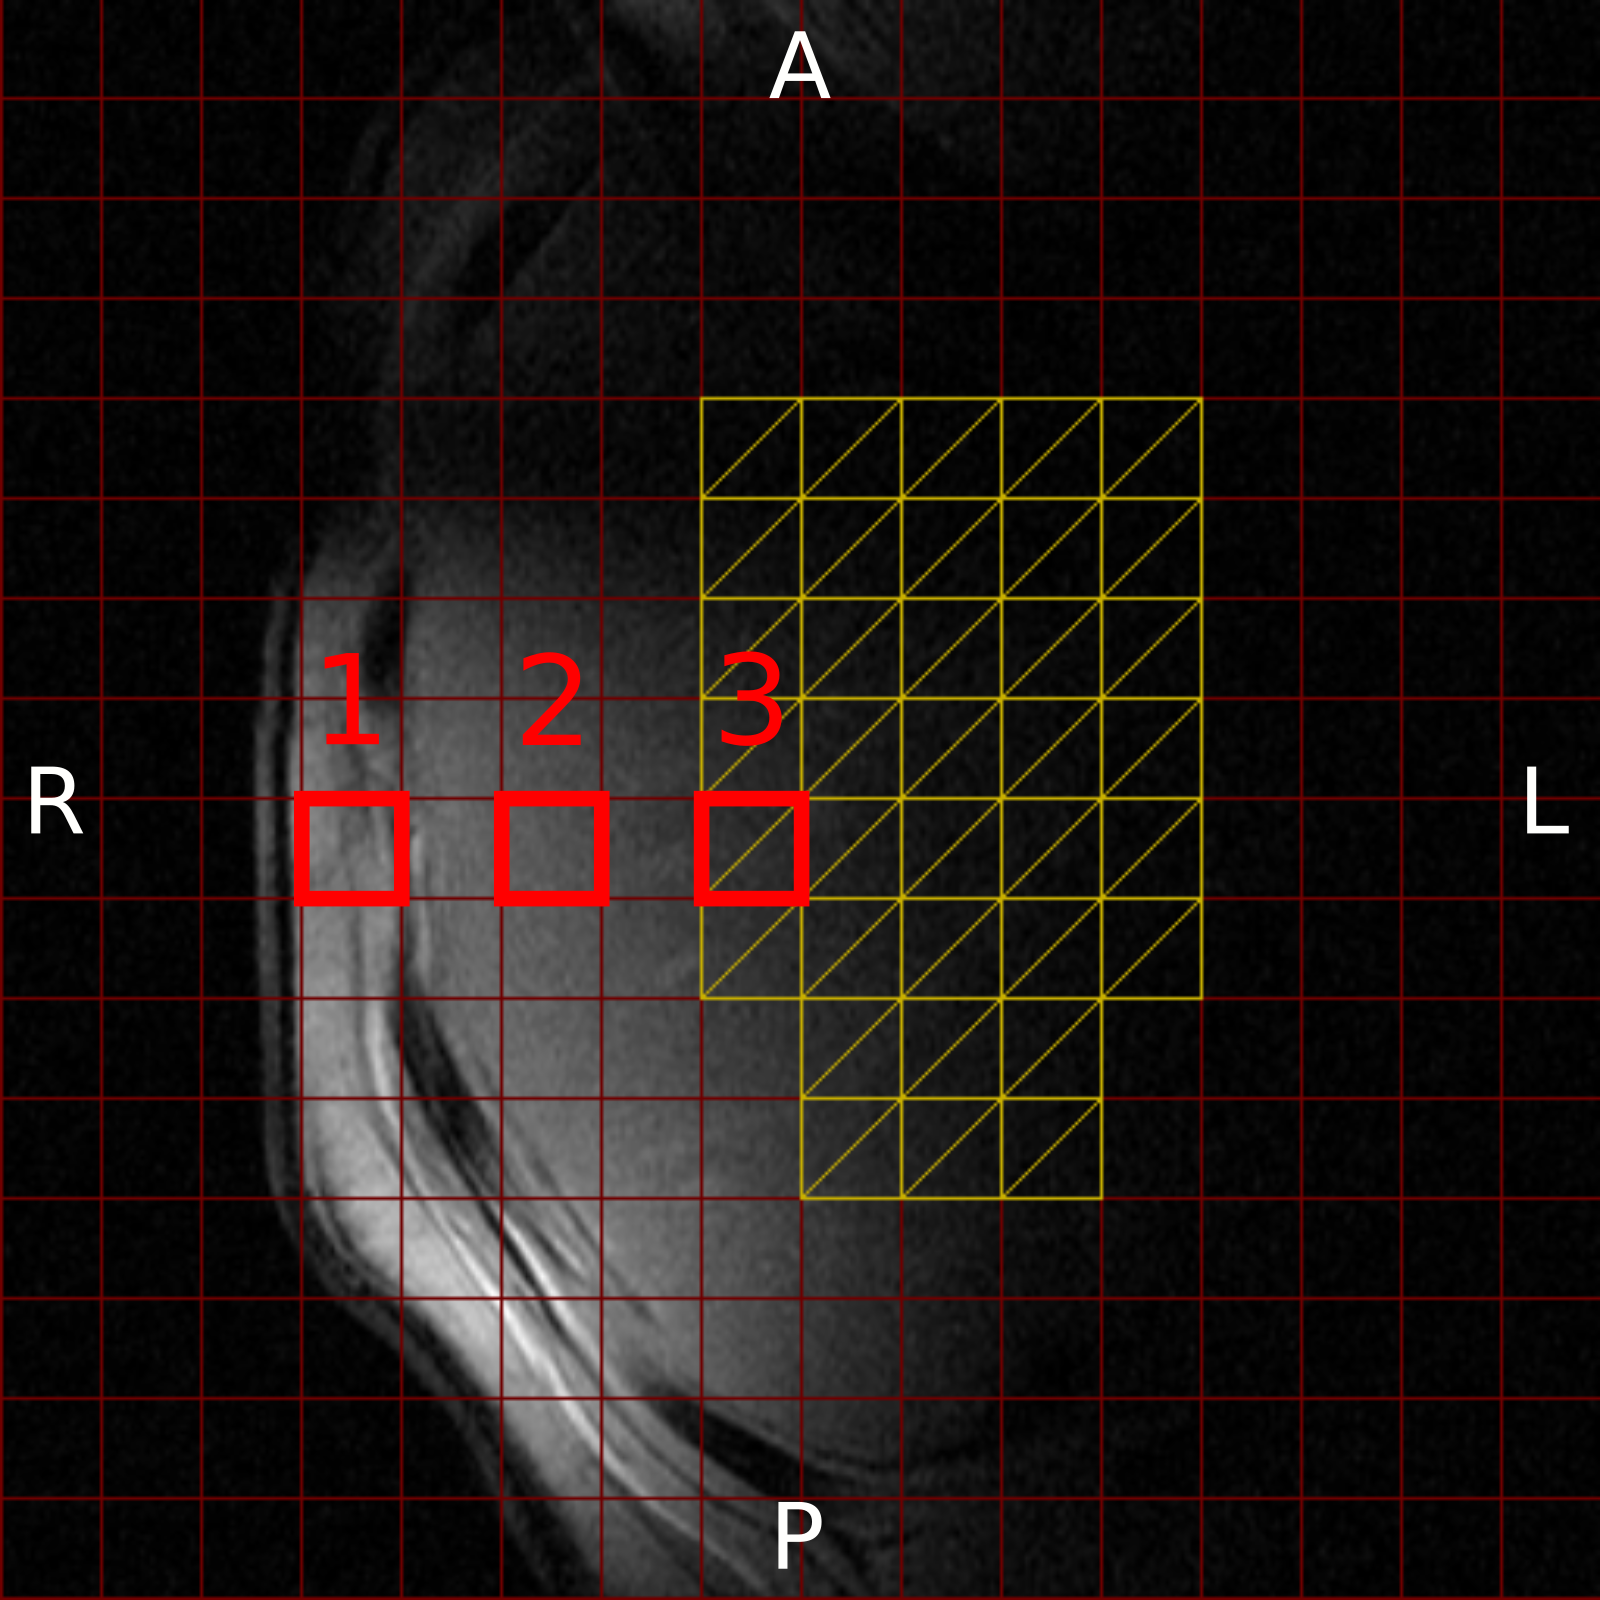
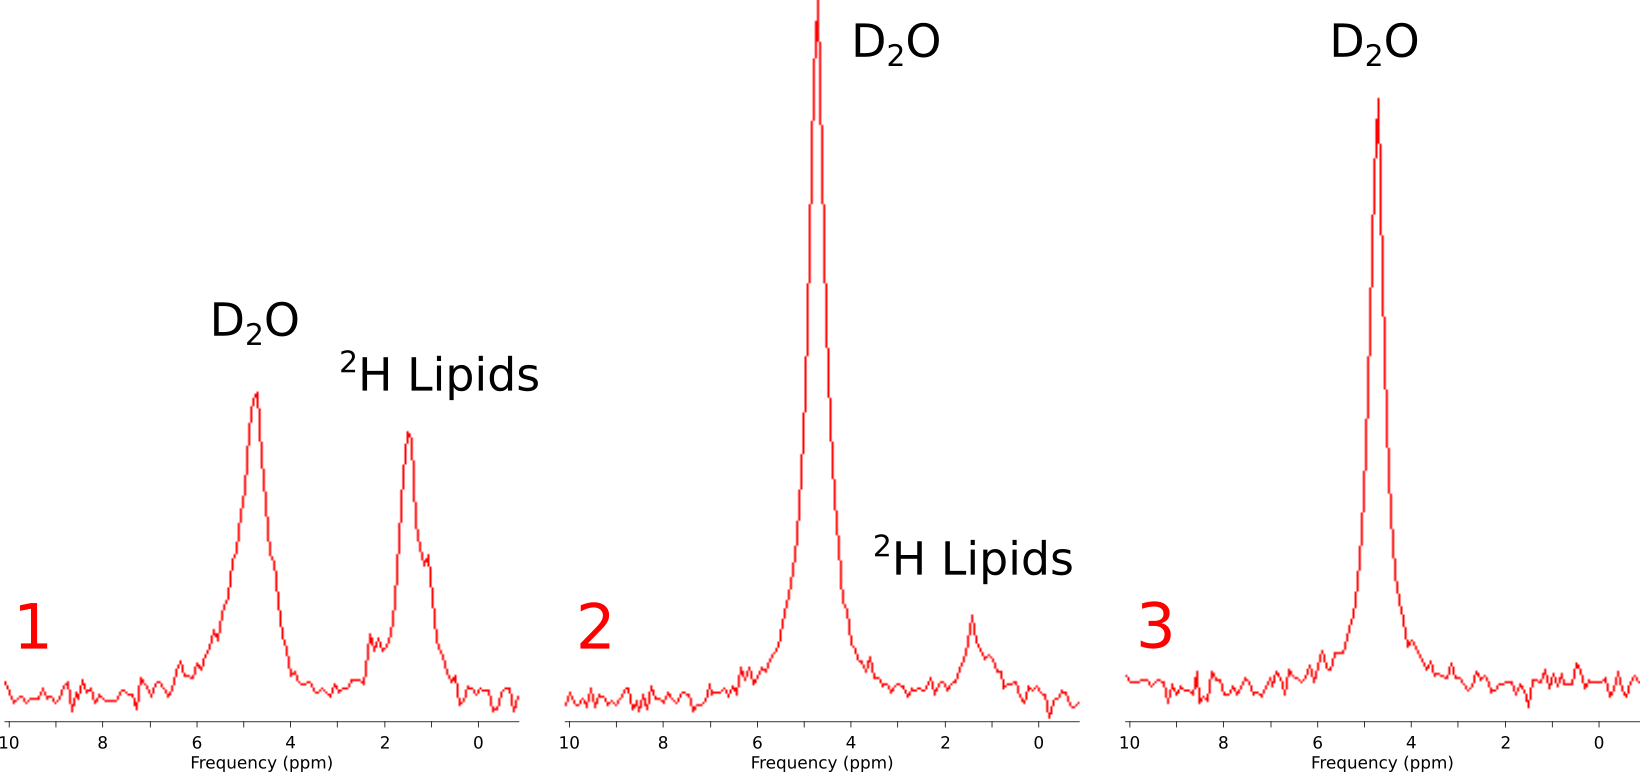
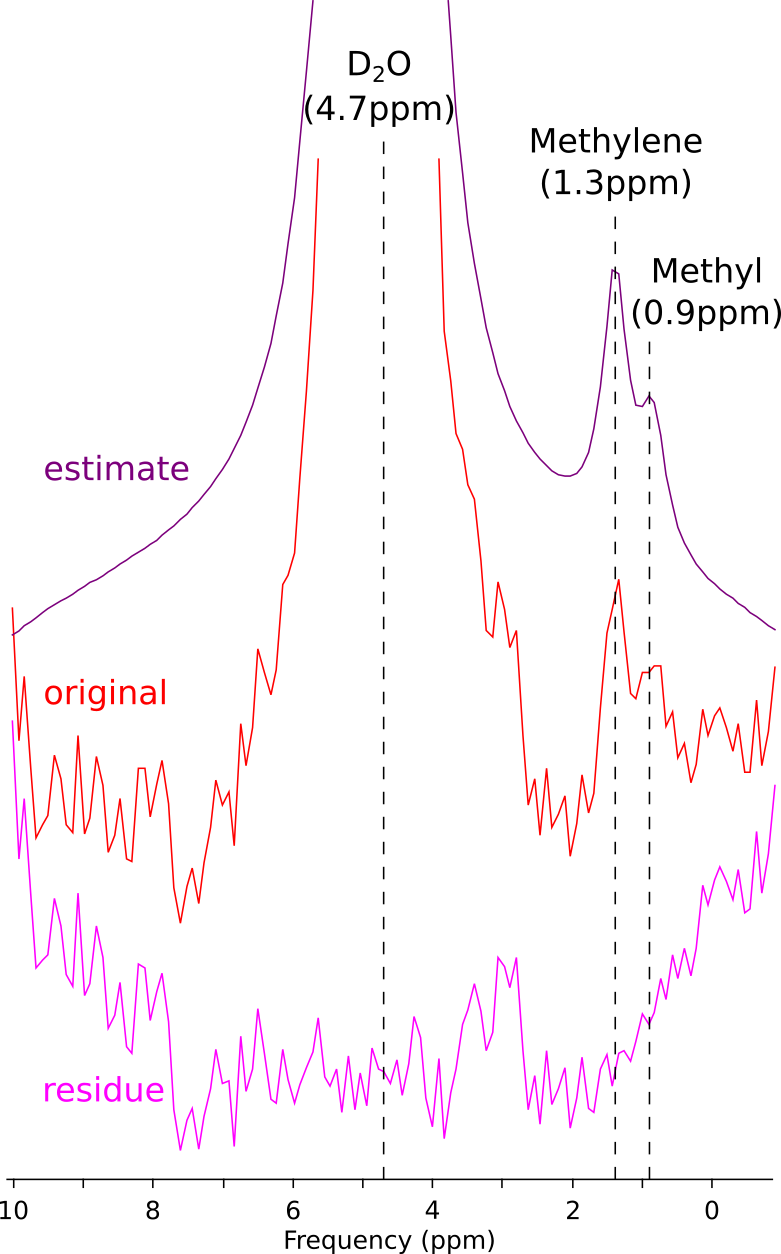
An 2H-MRSI sequence (1000ms block pulse, TE=1.1ms, TR=350ms, FOV: 280x200x200cm³, 12x8x12, zero-filled to 16x16x16, NA=32 (Hamming weighted)) with the 1H/2H coil was applied for DMI data acquisition. Due to the low SNR and only data from subjects with a 1H-HCL grater than 0.8% (n=5) were further processed: Spectra from voxels with an SNR>80 (D2O/DHO resonance) and located in the liver at a sufficient distance from the abdominal wall (>2.5cm) were averaged (Fig.1, Fig.2). Automatic frequency alignment and water phasing were performed in jMRUI4. Spectral fitting was performed using AMARES5 with the following parameters: 2 lines for the D2O resonance and 2 lines for the lipids at 1.3ppm and 0.9ppm (each ±0.1ppm) with a linewidth of 20Hz and the first order phase between -1.2ms and 1.2ms. HCL was calculated in the same way as for 1H-MRS including saturation correction for D2O/DHO (T1=350ms3), T1 of 2H methylene resonance was assumed to be 43ms, as measured in a 20% intralipid phantom solution.
Results
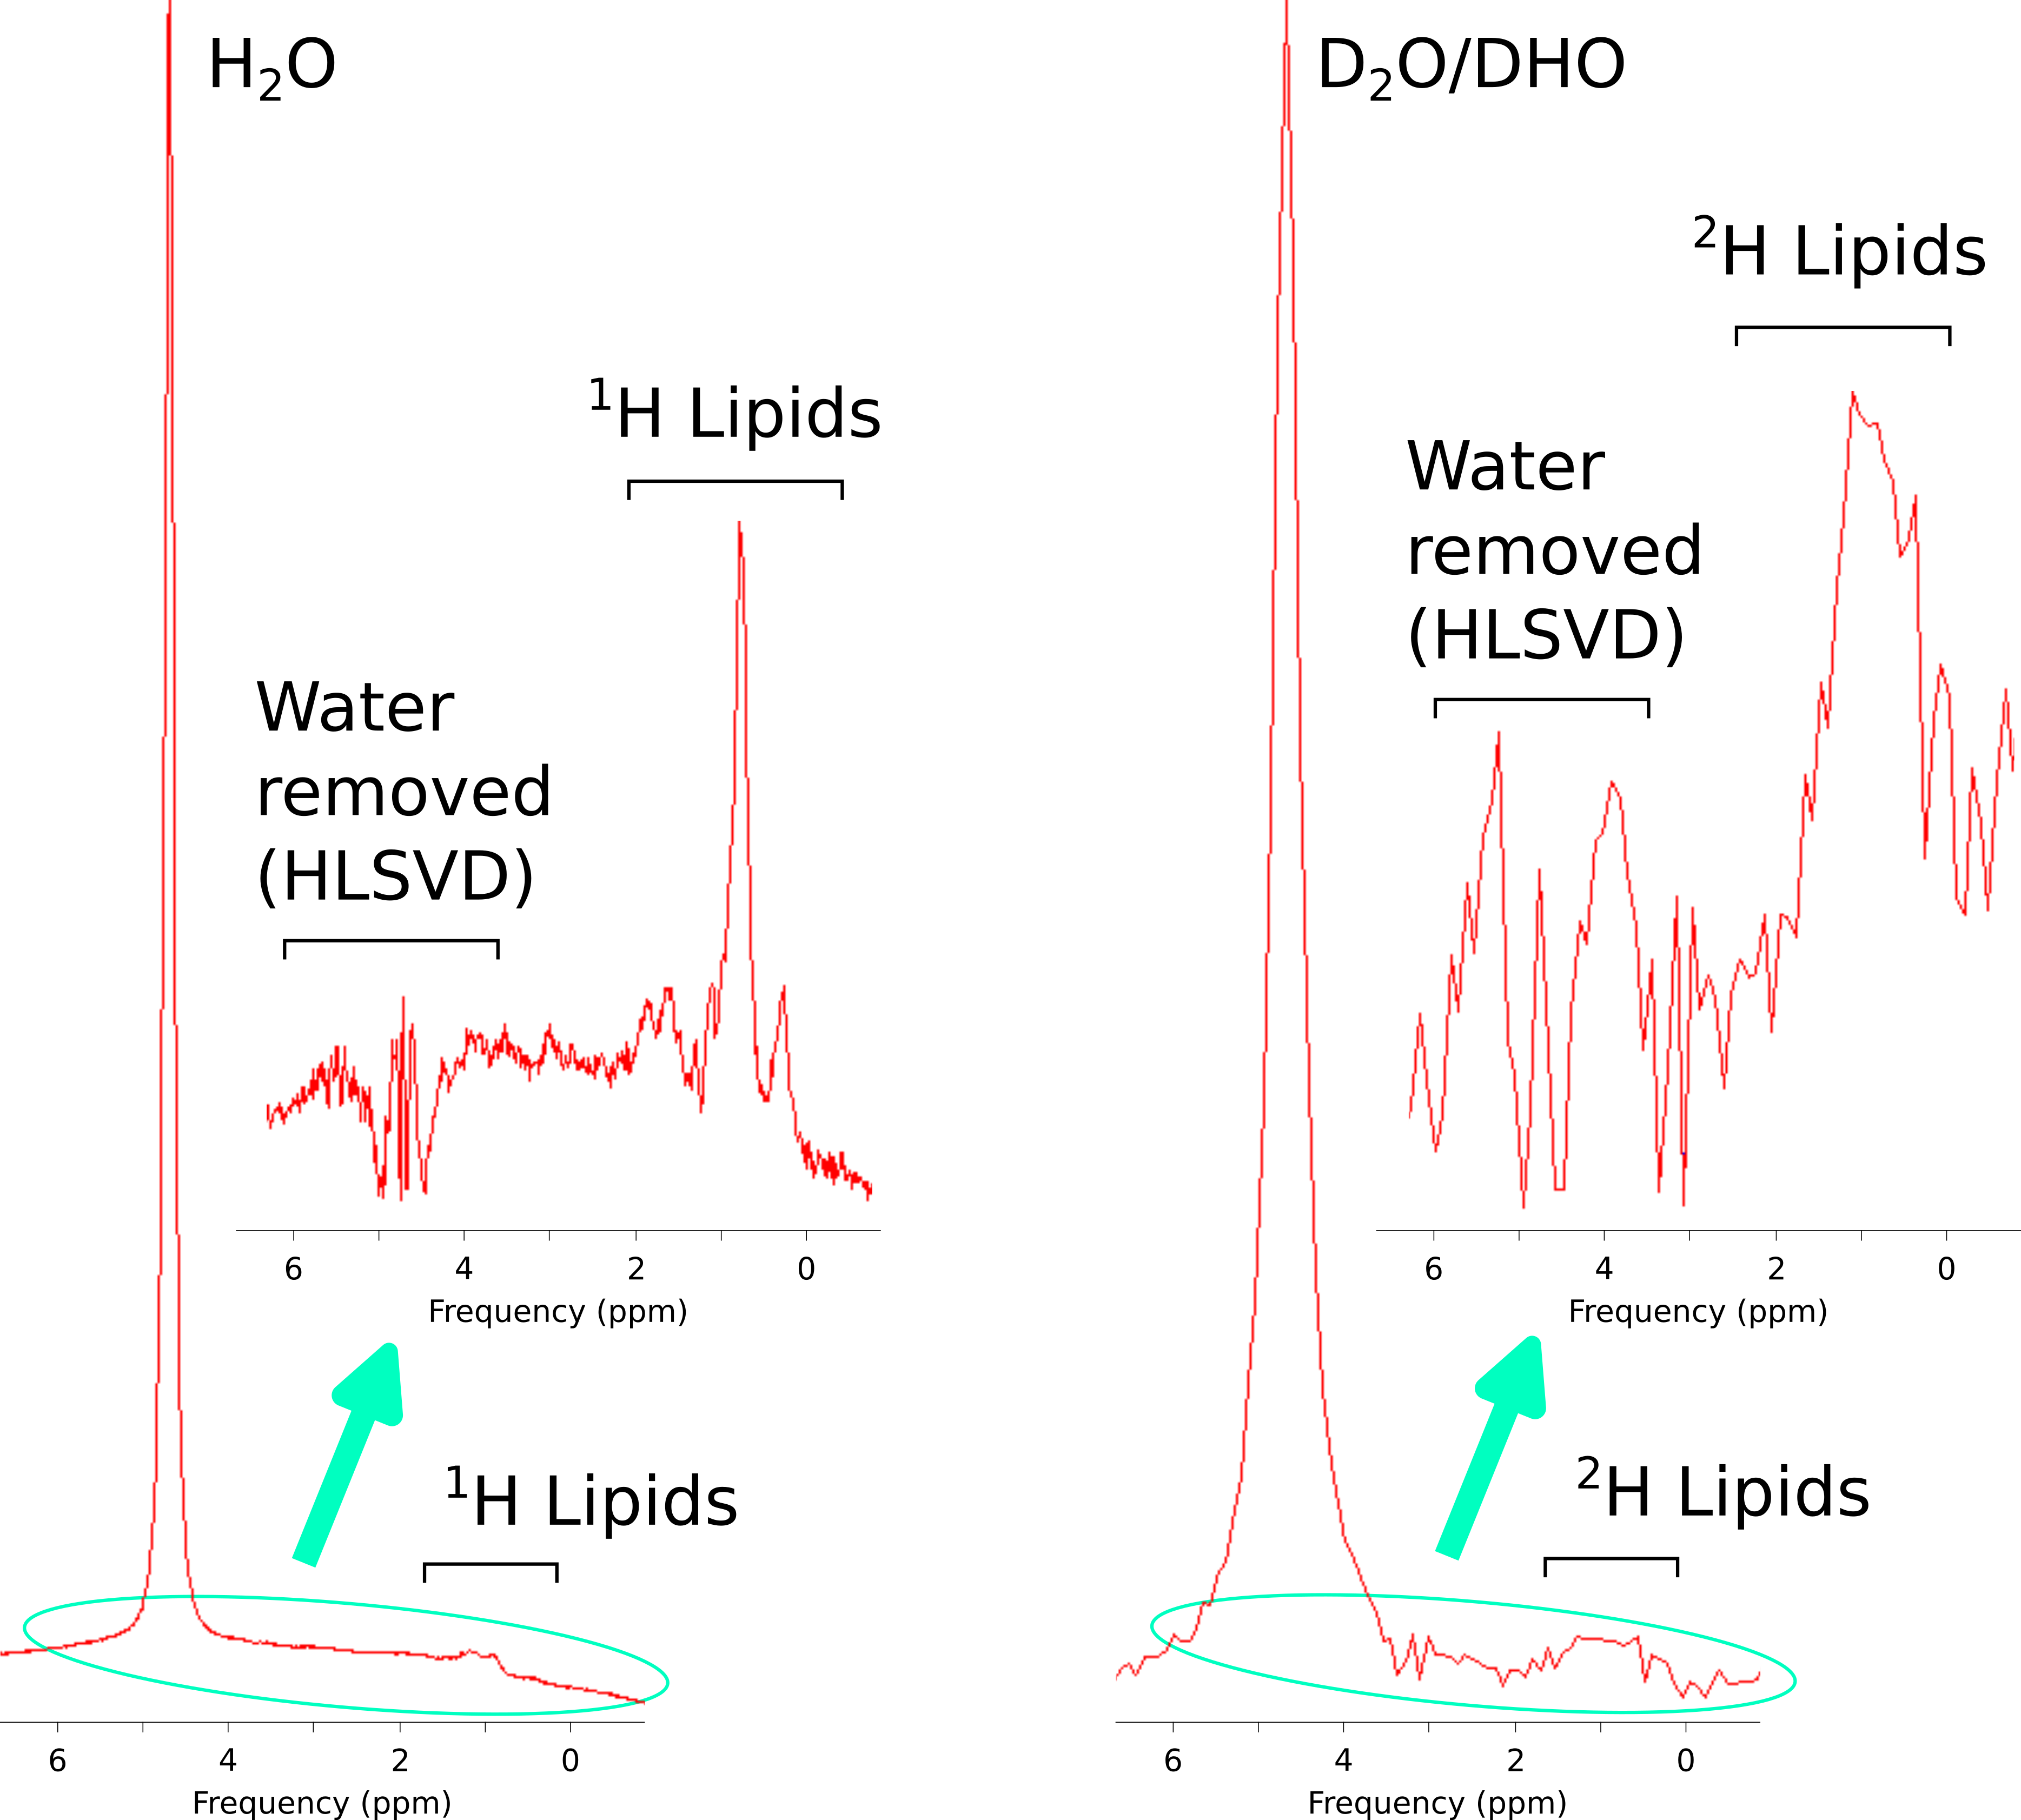
Only 5 subjects met the minimum 1H-HCL criterion for DMI evaluation. One exsample of fitting the 2H resonances of the averaged spectra is shown in Fig.3. The number of included voxel signals ranged from 177 to 214. The calculated HCL values for 1H/2H are 2.68%/2.48%, 0.90%/0.65%, 1.76%/1.40%, 0.97%/0.41% and 12.0%/2.35%. A comparison of 1H and 2H spectra is shown in Fig.4.Discussion
Due to the low 1H-MRS performance of the 1H/2H coil, the 1H-channel of the 1H/31P coil was used to acquire 1H spectra and the volunteers had to be repositioned for respective measurements. Since the natural abundance of 2H is low, a certain minimum HCL level of about 1% should be given to make an estimation based on 2H. This also means that the method should not be used independently but should be accompanied by other well-established techniques for HCL assessment, such as proposed by Gajdošík et al.1 The voxel should be selected carefully to avoid signal bleed from subcutaneous fat that may overestimate the HCL. In addition, the Hamming weighting results in a broadening of the voxel size, but also suppresses side lobes that contaminate the signal from surrounding voxels. The results show that the DMI-based assessment underestimated HCL by 10% to 20% for HCL>1.5% with one exceptional discrepancy. This determined 1H-HCL value could be caused by a misplacement of the 1H-MRS VOI, which could have been to close to the abdominal wall and therefore, being influenced by the subcutaneous fat. Finally, the conclusion of this pilot study is limited by the small number of subjects.Conclusion
The study demonstrates the feasibility of HCL assessment with DMI if a certain minimum lipid content is present in the liver. This offers the possibility to perform dynamic studies by 2H enrichment during different tracer intervention, e.g., administration with oral D2O intake. Further optimization in hardware and data acquisition could lower this threshold and improve the method.Acknowledgements
This study was supported by the Project “Role of growth hormone (GH) on hepatic lipids” (KPKL1015FW) of the Austrian Science Fund (FWF).References
- Gajdosik et al., NMR Biomed. 2015
- De Feyter et al., Sci. Adv. 2018
- De Feyter et al., J. Magn. Reson. 2021
- Naressi et al., MAGMA 2001
- Vanhamme et al., J. Magn. Reson. 1997
Figures