3991
Aplastic Anemia in the Adults: Capability of Proton Density Fat Fraction Quantification for Hematopoietic Ability Assessment and Diagnosis1Diagnostic Radiology, Fujita Health University School of Medicine, Toyoake, Japan, 2Joint Research Laboratory of Advanced Medical Imaging, Fujita Health University School of Medicine, Toyoake, Japan, 3Canon Medical Systems Corporation, Otawara, Japan, 4Radiology, Fujita Health University School of Medicine, Toyoake, Japan, 5Diagnostic Radiology, Hyogo Cancer Center, Akashi, Japan
Synopsis
Keywords: Screening, Hematologic, Proton density fat fraction
Motivation: PDFF quantification (PD-FFQ) with 6-point Dixon technique has a potential to assess hematopoietic ability assessment and diagnosis of aplastic anemia in adults.
Goal(s): The goal was to determine the capability of PD-FFQ with 6-point Dixon technique for diagnosis of aplastic anemia in adults.
Approach: Gender and age matched aplastic anemia patients and adults without aplastic anemia examined lumber MRI with PD-FFQ, and %CV and SD for vertebral bone marrow fat fraction were assessed and tested for differentiating two groups.
Results: When applied feasible threshold value, specificity of %CV was significantly higher than that of SD (p=0.03).
Impact: Proton density fat fraction quantification (PD-FFQ) with 6-point Dixon technique has a potential for hematopoietic ability assessment and diagnosis of aplastic anemia in adults.
Introduction
Bone marrow adipose tissue (BMAT) has become an area of intense research, reflected by the formation of the International Bone Marrow Adiposity Society in 2017. The increasing interest of this unique fat phenotype and endocrine organ arises from a yet not fully understood association with something known as bone health incorporating osteoporotic changes, fracture risk, impaired bone formation, hematopoiesis, or maybe even effects on tumor progression. Quantitative chemical shift-encoding based water-fat MRI using multipoint Dixon techniques is an emerging method to quantify tissue fat concentration and enables the spatially resolved assessment of parametric proton density fat fraction (PDFF) maps. Moreover, whole-body PDFF imaging is being applied to evaluate the fat content of bone marrow in patients with benign and malignant diseases or osteoporosis (1, 2). However, no one have evaluated the capability of PDFF for hematopoietic ability. We hypothesized that PDFF quantification (PD-FFQ) with 6-point Dixon technique has a potential to assess hematopoietic ability assessment and diagnosis of aplastic anemia in adults. The purpose of this study was to determine the capability of PDFF quantification (PD-FFQ) with 6-point Dixon technique for hematopoietic ability assessment and diagnosis of aplastic anemia in adults.Materials and Methods
Gender and age matched aplastic anemia patients (n=10: aplastic anemia group) and adults without aplastic anemia (n=15: control group) prospectively examined lumber MRI with PD-FFQ with 6-point Dixon technique by means of 3D-field echo (FE) pulse sequence with 6 multiple TEs (TR/ 7.6ms, TE/ 1.2, 2.2, 3.2, 4.2, 5.2 and 6.2ms, flip angle=3degree, slice thickness = 4 mm, NEX = 1, FOV = 350 × 350 mm, SPEEDER reduction factor = 1 , 30 slices, 256 × 256 matrix, 256 × 256 reconstruction matrix) at two 3T MR systems (Vantage Centurian, Canon Medical Systems Corporation, Otawara, Japan). To evaluate vertebral bone marrow fat fraction (BMFF) in each subject, region of interests (ROIs) were placed over at vertebras from L1 to L5, and mean values of each vertebra was recorded. Then, mean, standard deviation (SD) and percentage of coefficient of variation (%CV) of BMFF were determined from all ROI measurements in each patient. To compare each quantitative index between two groups, Student’s t-test was performed. The relationship between blood test result and each quantitative index was assessed by Pearson’s correlation. To compare each quantitative index among non-aplastic anemia, non-severe aplastic anemia and severe aplastic anemia groups, Tukey’s HSD test was performed. Then, ROC-based positive test was performed to compare diagnostic capability for aplastic anemia by all quantitative index as having significant differences between two groups. Finally, sensitivity, specificity and accuracy were compared among them.Results
Representative cases are shown in Figure 1 and 2. On comparison of two groups, there were significant differences of SD and %CV between aplastic anemia and control groups (SD: p=0.02, %CV: p=0.0008) (Figure 3). SD and %CV had significant and negative correlations with number of red blood cell (SD: r=-0.43, p=0.04, %CV: r=-0.41, p=0.04) and plate count (SD: r=-0.43, p=0.03, %CV: r=-0.53, p=0.007) (Figure 4). SD and %CV of non-aplastic anemia group had significant differences with those of others (p<0.05). Moreover, these values were significant differences between non-severe and severe aplastic anemia groups (p<0.05) (Figure 5). When applied feasible threshold value from ROC-based positive tests, specificity of %CV (93.3%) was significantly higher than that of SD (53%, p=0.03).Conclusion
PD-FFQ with 6-point Dixon technique has a potential for hematopoietic ability assessment and diagnosis of aplastic anemia in adults.Acknowledgements
This work was financially and technically supported by Canon Medical Systems Corporation. Drs. Nagata and Ohno received research grants from Canon Medical Systems. Five of the authors (Mr. Yuichiro Sano, Ms. Kaori Yamamoto, Ms. Maiko Shinohara, Mr. Masato Ikedo and Mr. Masao Yui) are employees of Canon Medical Systems but did not have control over any of the data and information submitted for publication or which data and information were to be included in this study. None of the patients enrolled in this study were also entered in previous studies.References
- Kim D, Kim SK, Lee SJ, et al. Simultaneous Estimation of the Fat Fraction and R₂* Via T₂*-Corrected 6-Echo Dixon Volumetric Interpolated Breath-hold Examination Imaging for Osteopenia and Osteoporosis Detection: Correlations with Sex, Age, and Menopause. Korean J Radiol. 2019;20(6):916-930.
- Bainbridge A, Bray TJP, Sengupta R, Hall-Craggs MA. Practical Approaches to Bone Marrow Fat Fraction Quantification Across Magnetic Resonance Imaging Platforms. J Magn Reson Imaging. 2020;52(1):298-306.
Figures
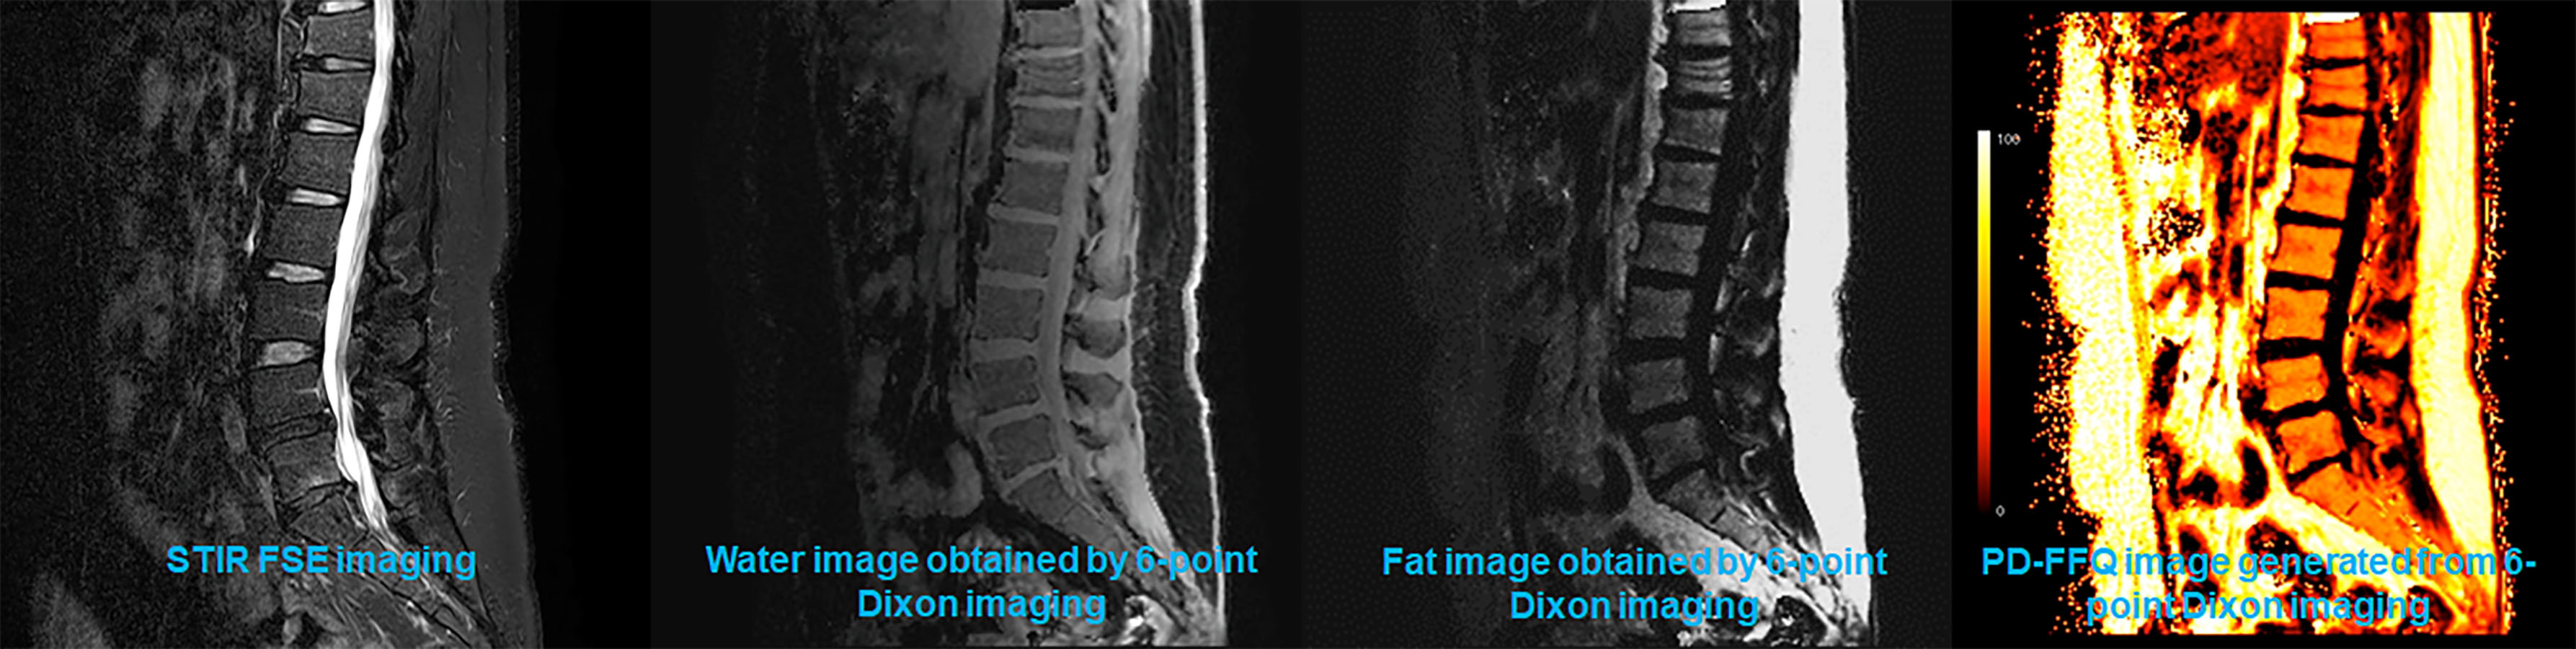
Figure 1. 45-year-old female with lumber disc herniation in non-aplastic group.
Water and fat images obtained by 6-point Dixon technique shows homogeneous signal intensity within each vertebra. PD-FFQ image shows homogeneous fat fraction within each vertebra.
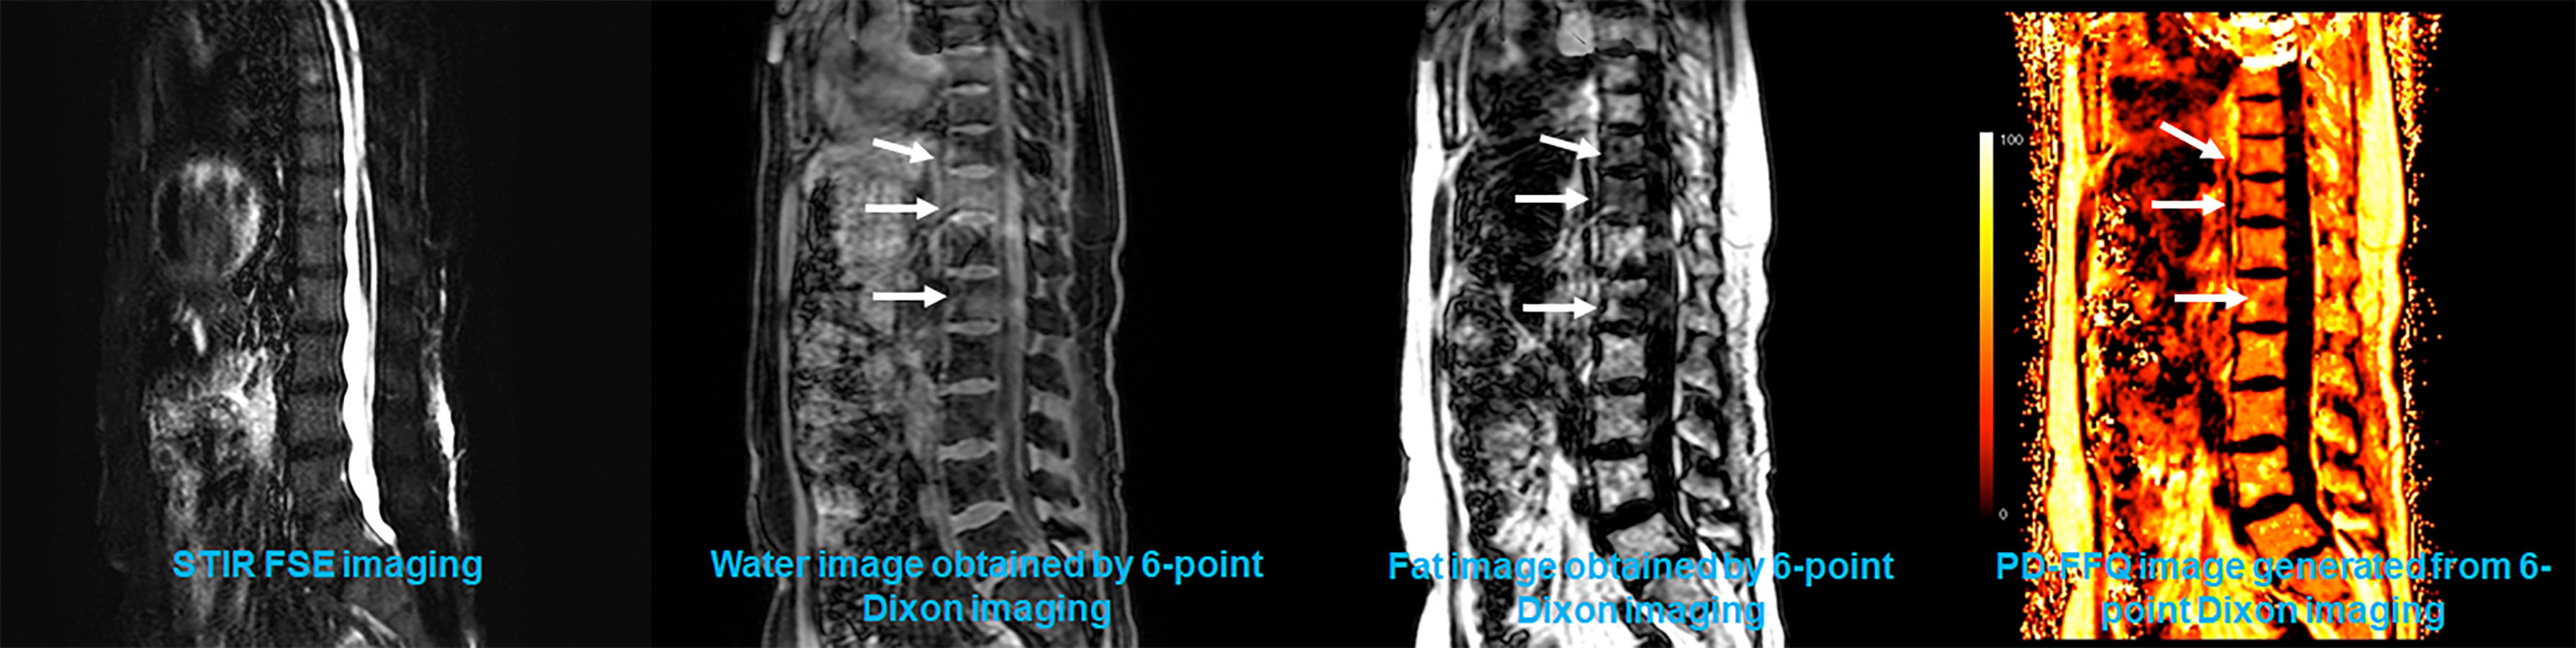
Figure 2. 62-year-old female in aplastic anemia group.
Water and fat images obtained by 6-point Dixon technique shows heterogeneous signal intensity within Th10, Th11 and L1. Extramedullary hematopoiesis (arrows) are demonstrated as heterogeneous high signal intensities on water image and low signal intensities within vertebras. PD-FFQ image shows heterogeneous fat fractions within each vertebra. SD and %CV of BMFF in aplastic anemia group were significantly larger than those in non-aplastic group (p<0.05).
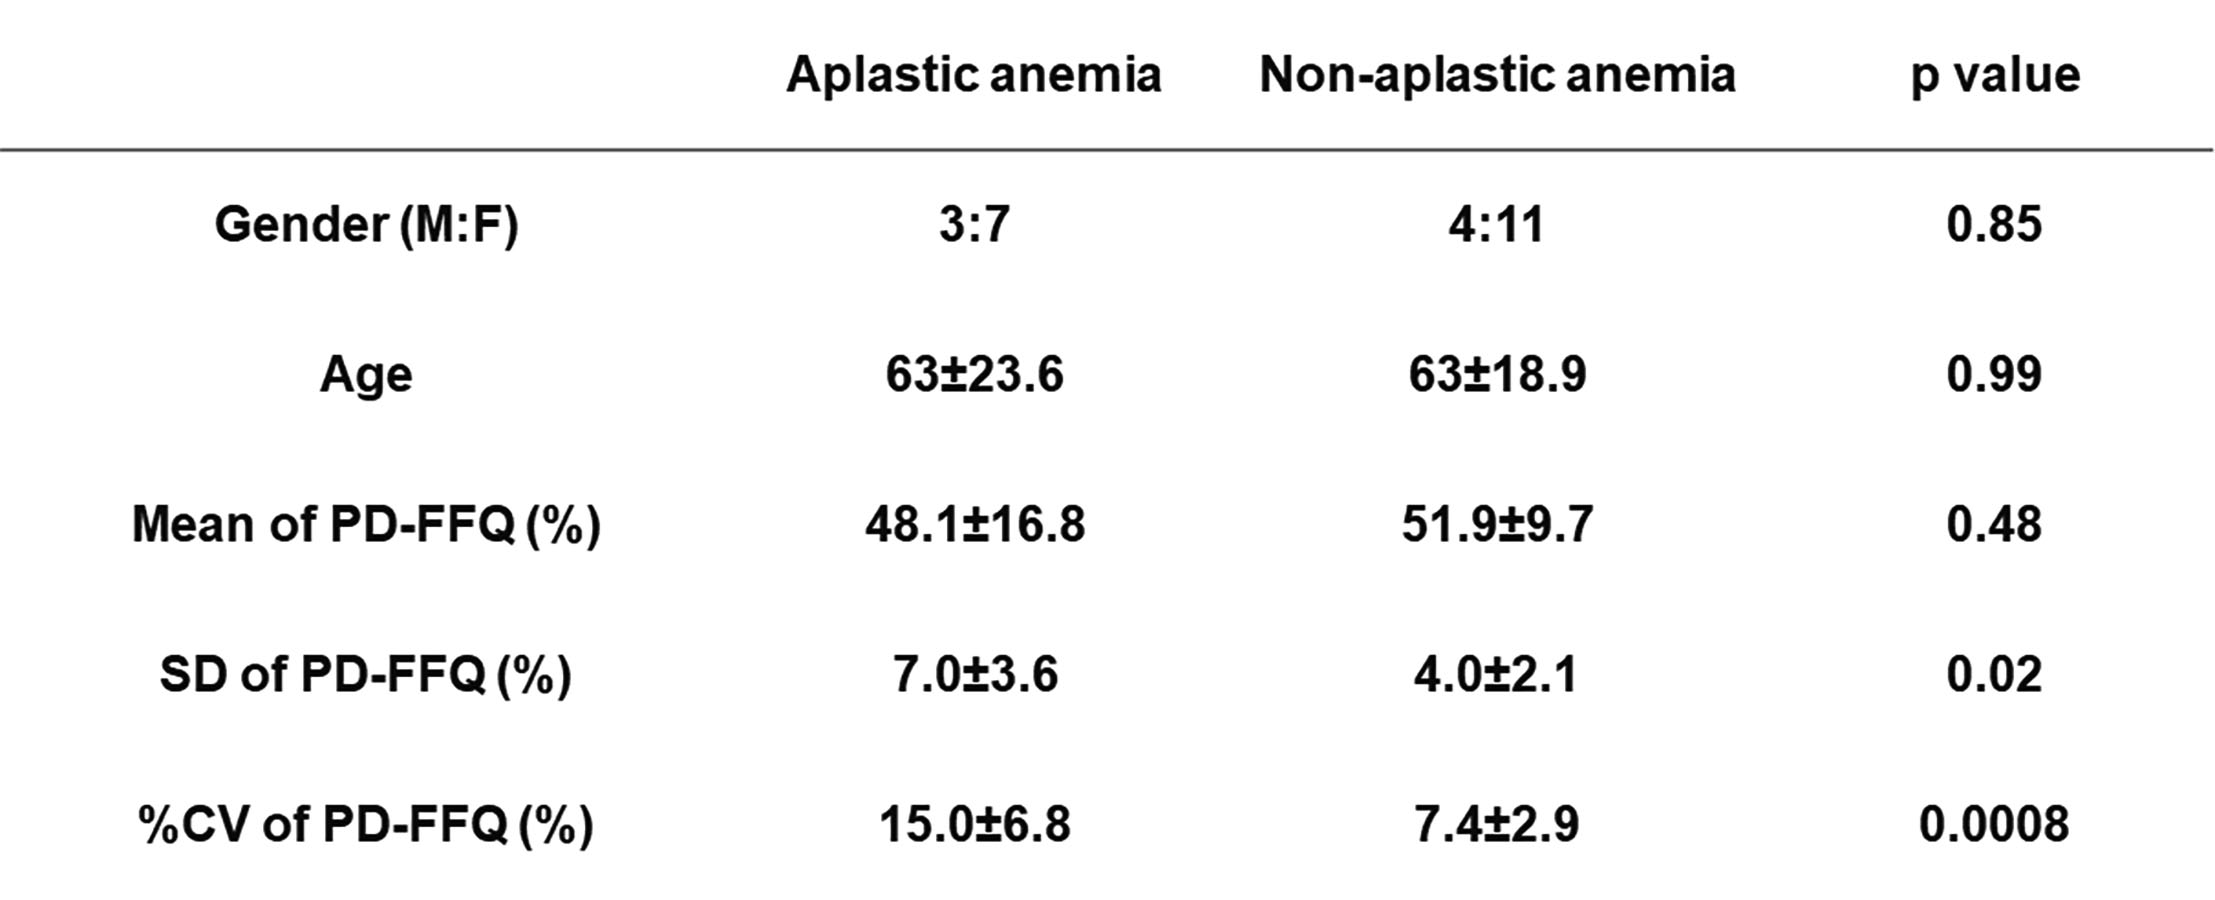
Figure 3. Comparison of gender, age and all quantitative indexes between aplastic anemia and non-aplastic anemia groups.
Mean, SD and %CV of mean values of BMFF had significant difference between two groups (p<0.05).
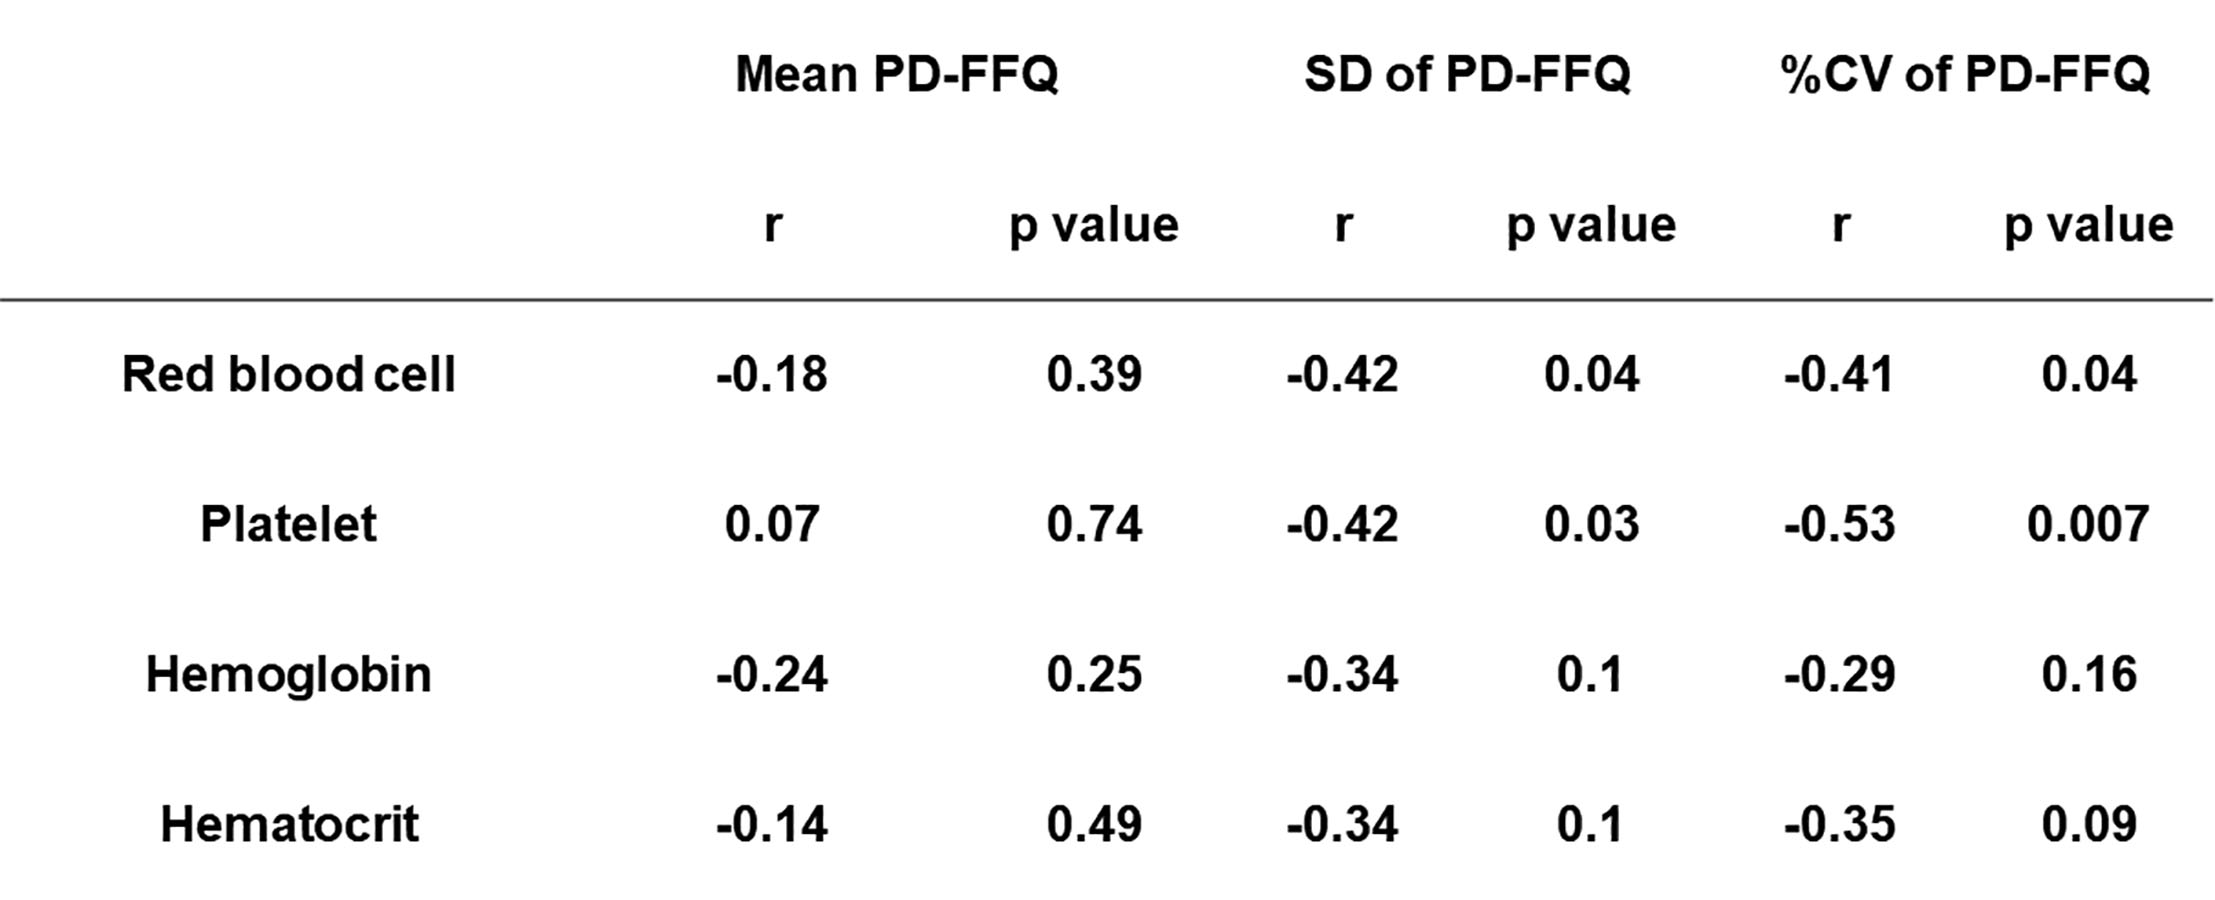
Figure 4. Correlation of mean, SD and %CV of mean values of BMFF on PD-FFQ with blood test results.
SD and %CV had significant and negative correlations with number of red blood cell (SD: r=-0.43, p=0.04, %CV: r=-0.41, p=0.04) and plate count (SD: r=-0.43, p=0.03, %CV: r=-0.53, p=0.007).
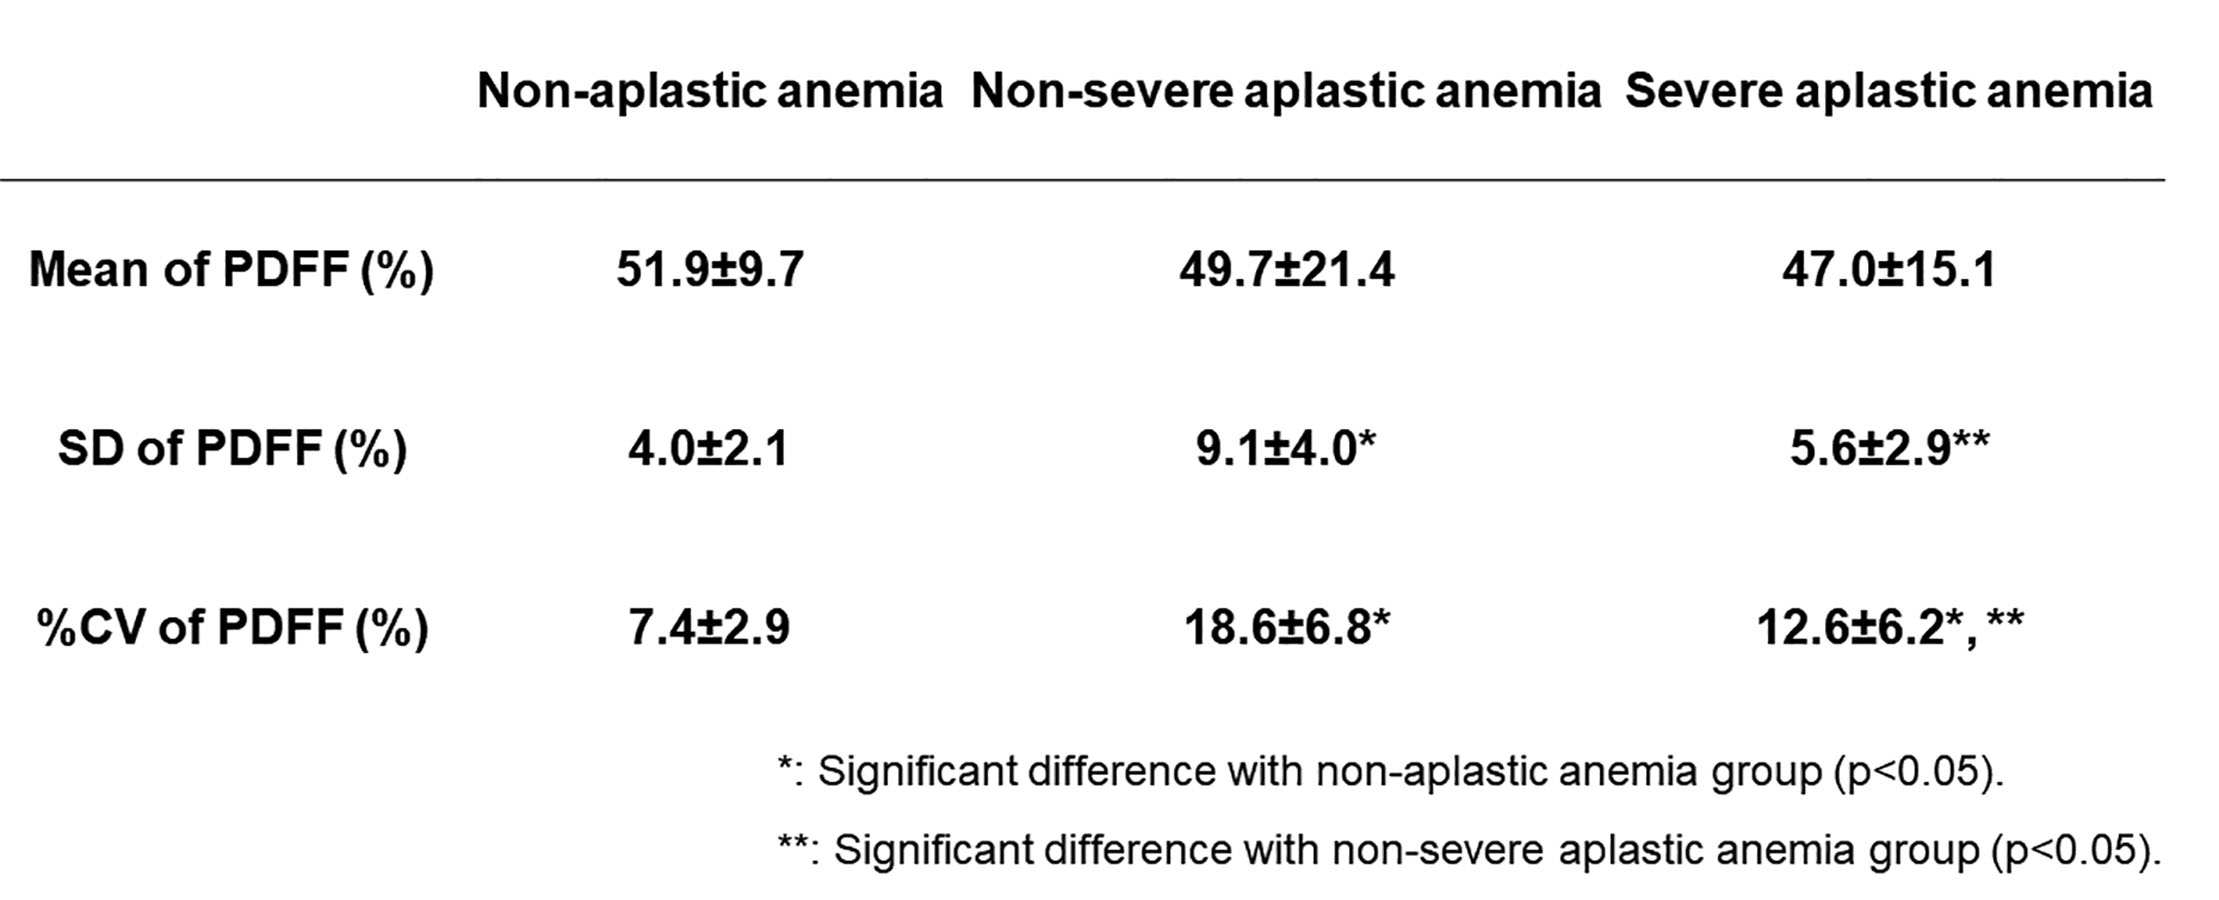
Figure 5. Comparison of mean, SD and %CV of mean values of BMFF on PD-FFQ among non-aplastic anemia, non-severe aplastic anemia and severe aplastic anemia groups.
Non-aplastic anemia group had significant differences of SD and %CV with those of others (p<0.05). Moreover, non-severe and severe aplastic anemia groups had significant differences of these values (p<0.05).