3987
Ultra-high b-value DWI in Rectal Cancer: Image Quality Assessment and Prediction of Lymph Node Metastasis Based on Radiomic Features1Xijing Hospital, Air Force Medical University, Xi’an, Shaanxi, China, China
Synopsis
Keywords: Cancer, Diffusion/other diffusion imaging techniques
Motivation: The potential benefits of ultra-high b-value DWI have not yet been elucidated for clinical values of rectal cancer.
Goal(s): To evaluate image quality and lymph node metastasis in rectal cancer on multi-b value diffusion-weighted imaging (DWIb1000, DWIb2000 and DWIb3000).
Approach: The image quality of three sets of DWI was measured by two radiologists independently. The radiomics model was trained on 70%, and tested on the remainder
Results: The DWIb2000 exhibited excellent lesion conspicuity and was able to determine the outcome of of lymph node metastasis rectal with a predictive value of 0.728
Impact: The DWIb2000 had great potential in improving detection of rectal cancer and was helpful to stratify the risk of lymph node metastasis of rectal cancer.
INTRODUCTION:
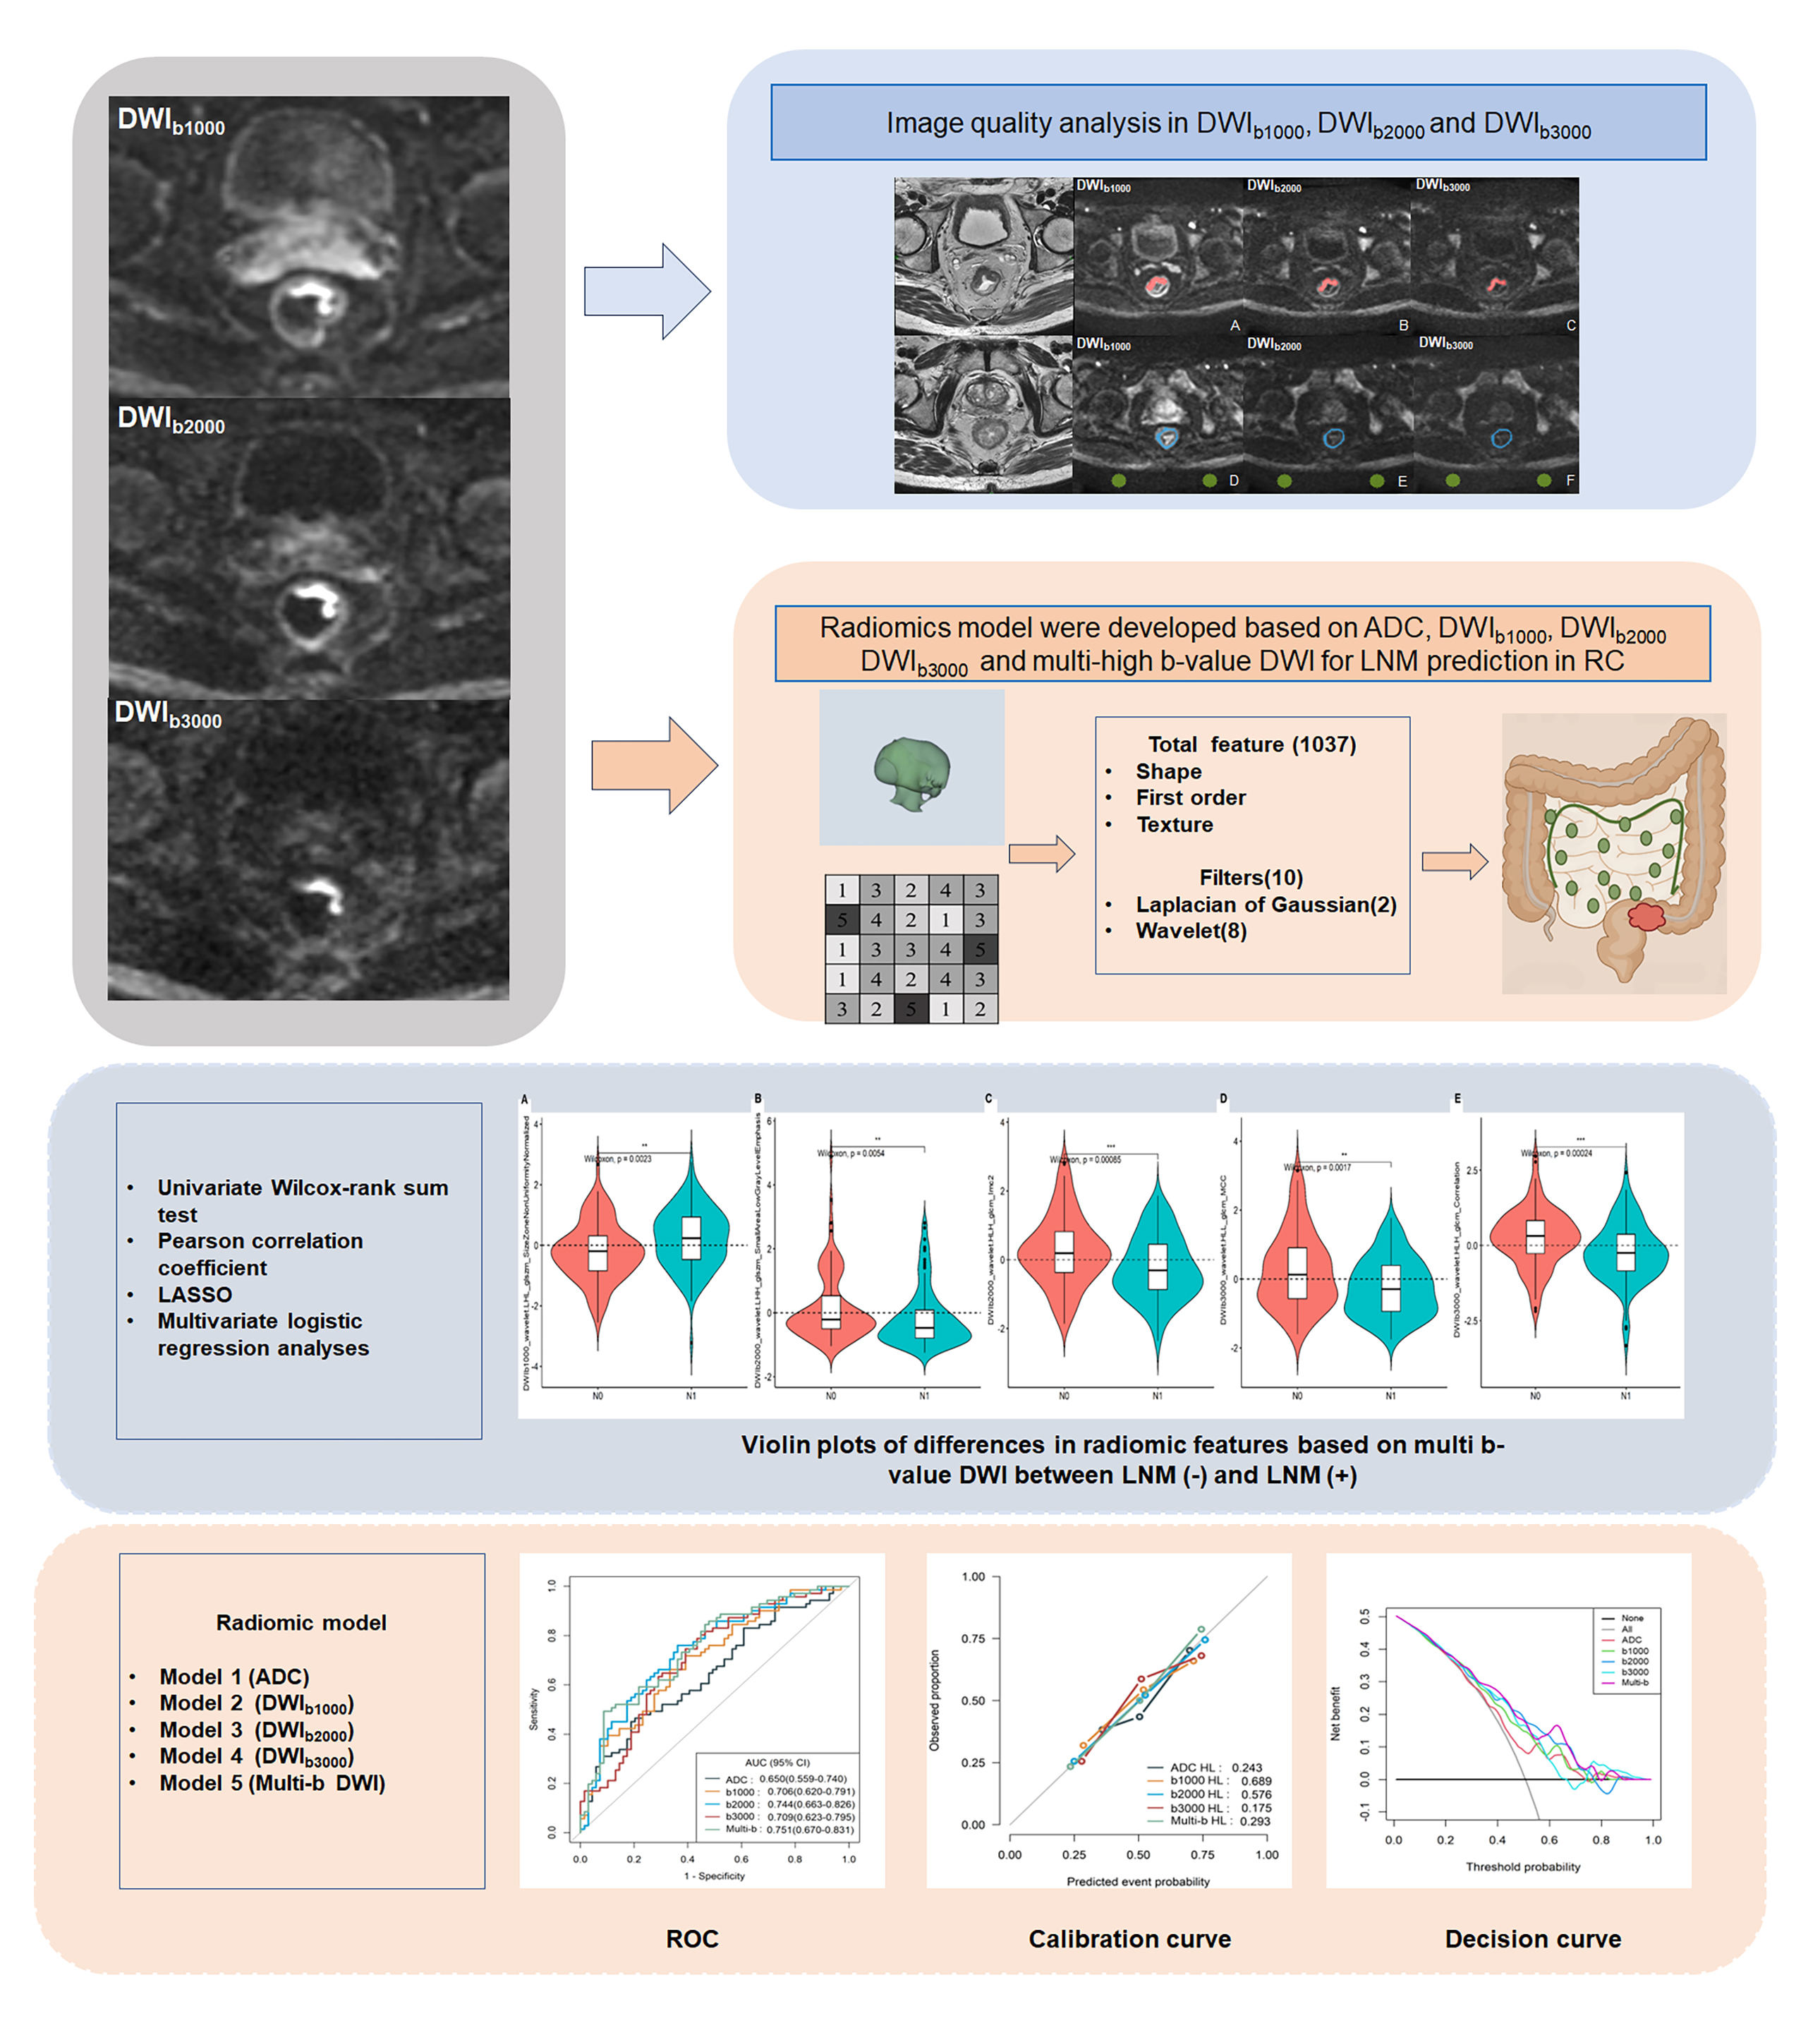
Lymph node metastasis (LNM) plays a pivotal role in both the prognosis and treatment decisions for patients with rectal cancer (RC)1. In the contemporary medical landscape, radiomics has emerged as a valuable approach for analyzing a plethora of objective quantitative image features, encompassing tumor shape, Wavelet and Gaussian Laplace transform high-order statistical features. These radiomic techniques provide a fundamental methodology for predicting LNM in RC by decoding the tumor's phenotype2-4. Notably, ultra-high b-value DWI images have demonstrated enhanced sensitivity and effectiveness in identifying lesions and exploring tissue microstructure characteristics when compared to standard DWIb10005. In a prior investigation, our research team ascertained that the apparent diffusion coefficient (ADC) calculated using ultra-high b-value DWI outperformed the ADC derived from routine DWI in prognostic predictions for RC6. Regrettably, to the best of our knowledge, there is currently a dearth of radiomic studies leveraging ultra-high b-value DWI to preoperatively predict the likelihood of LNM in RC.METHODS:
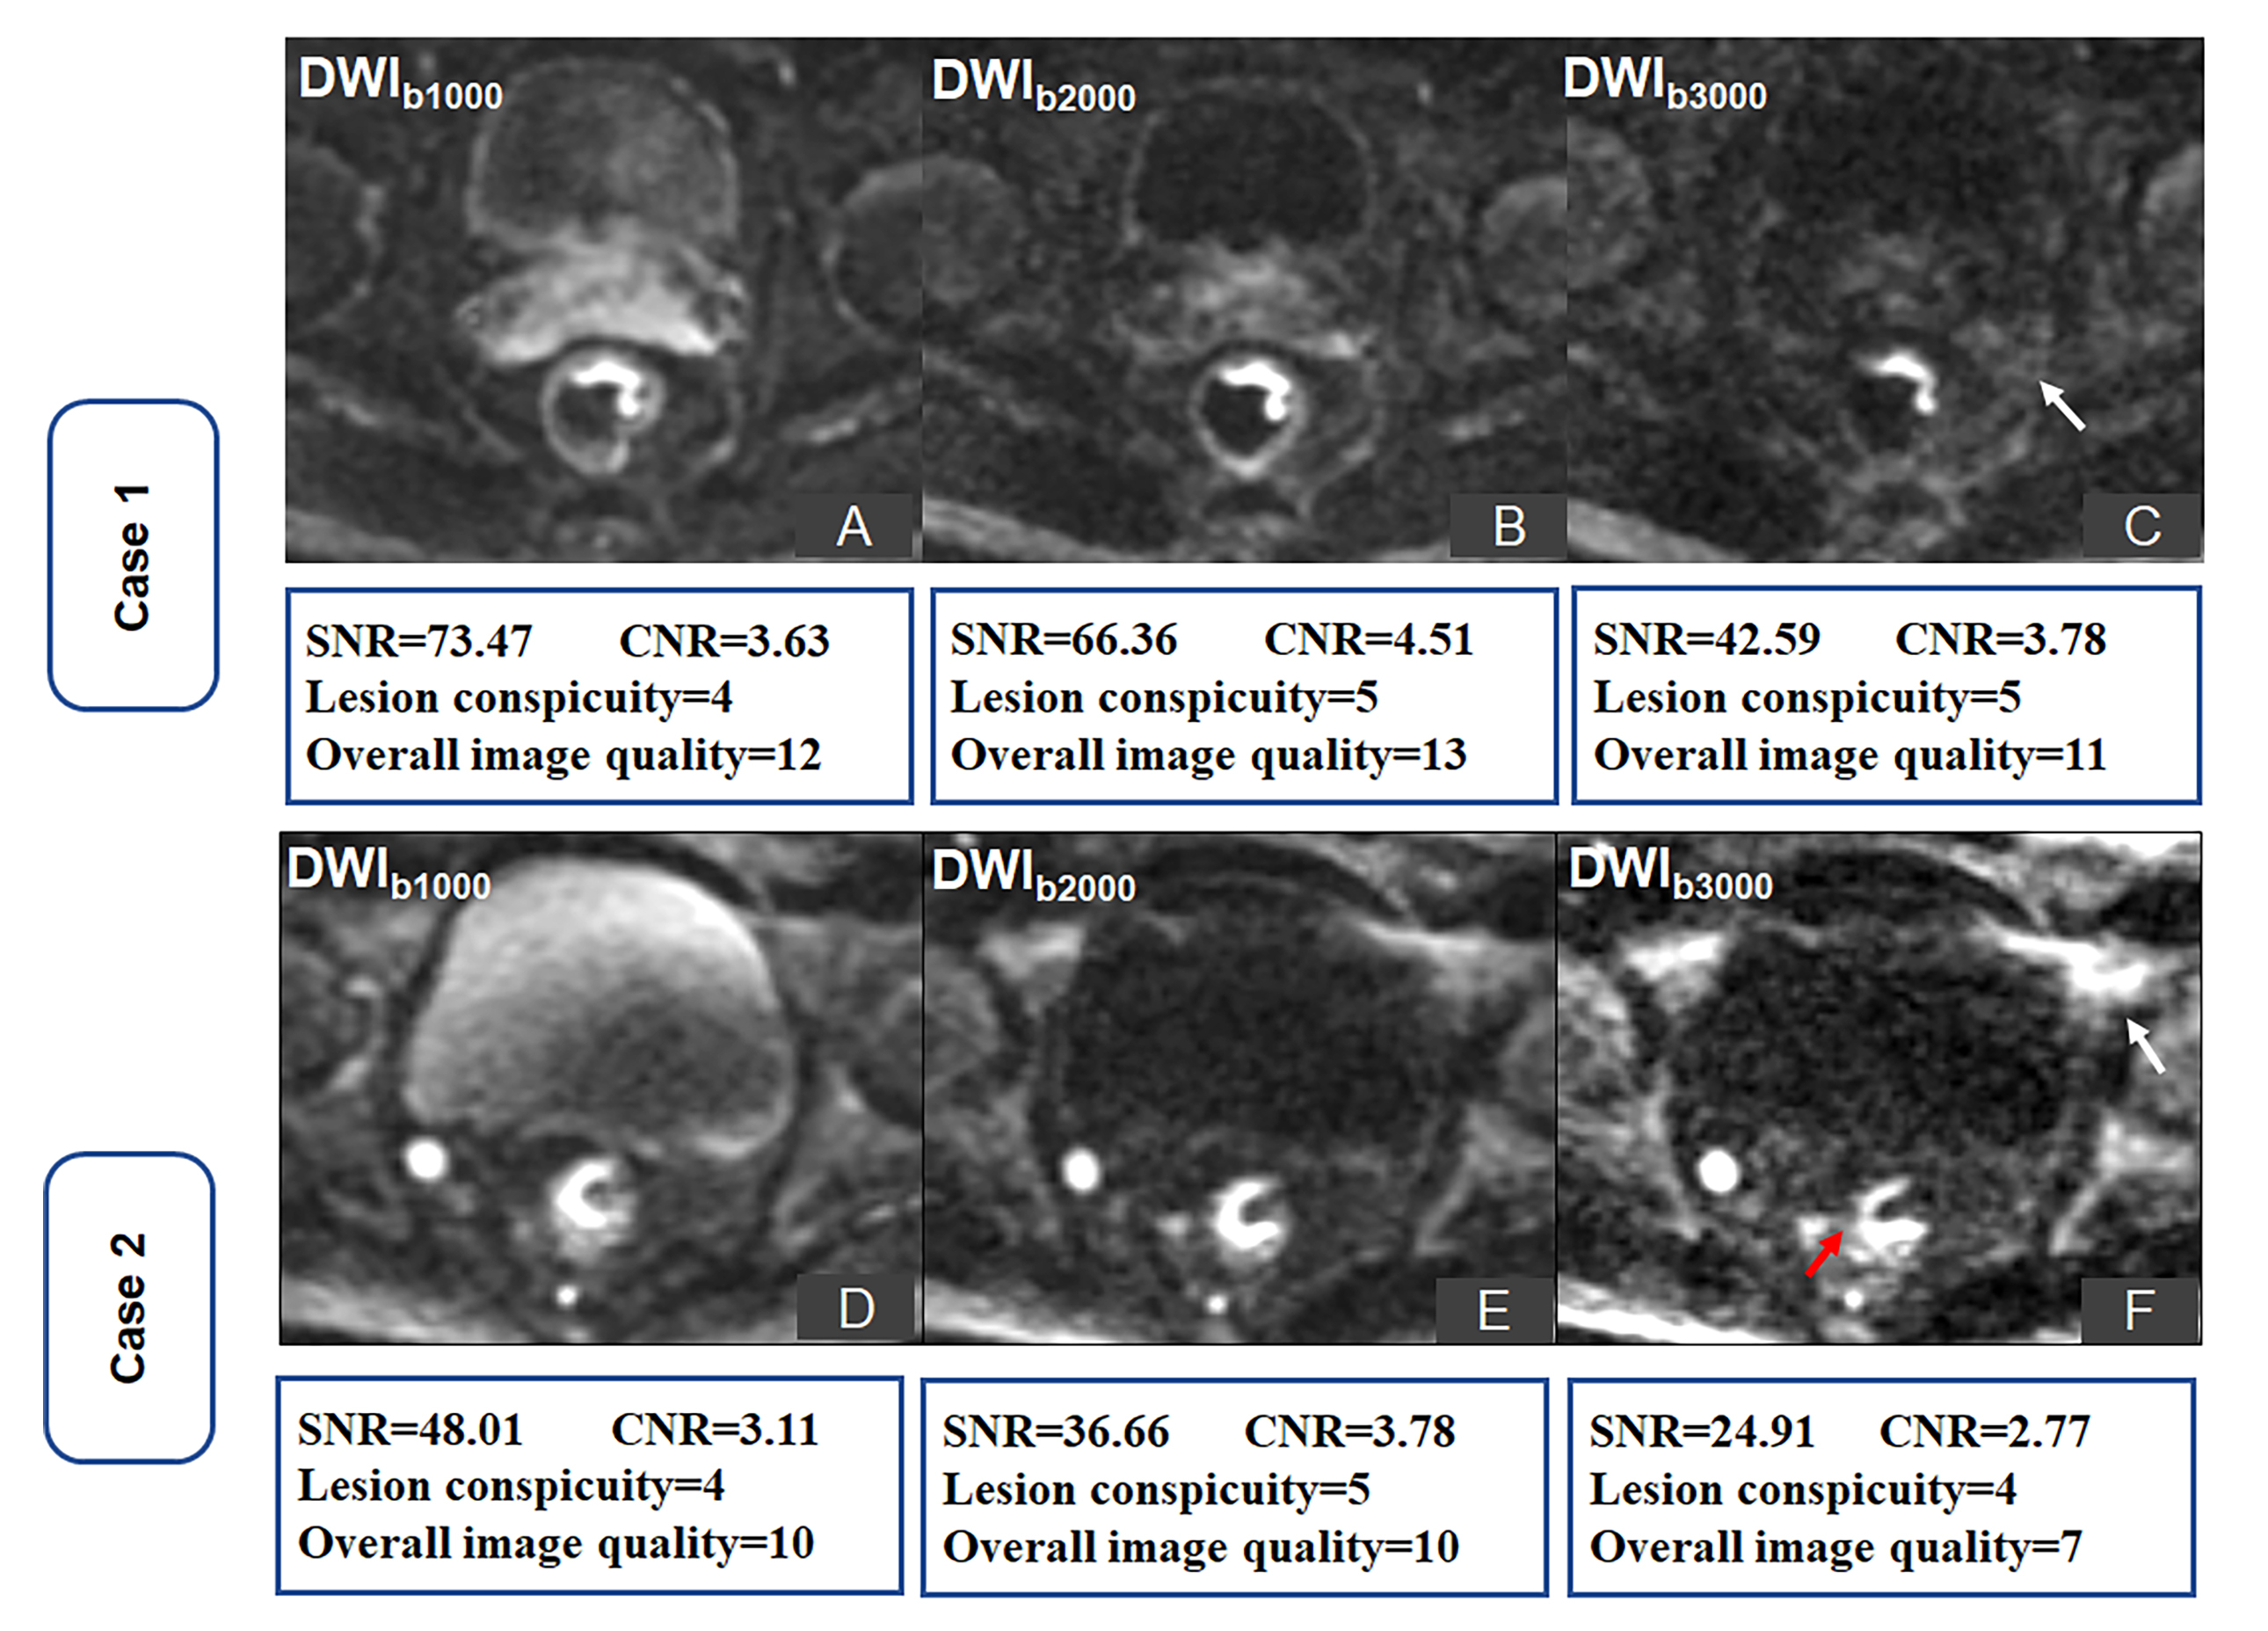
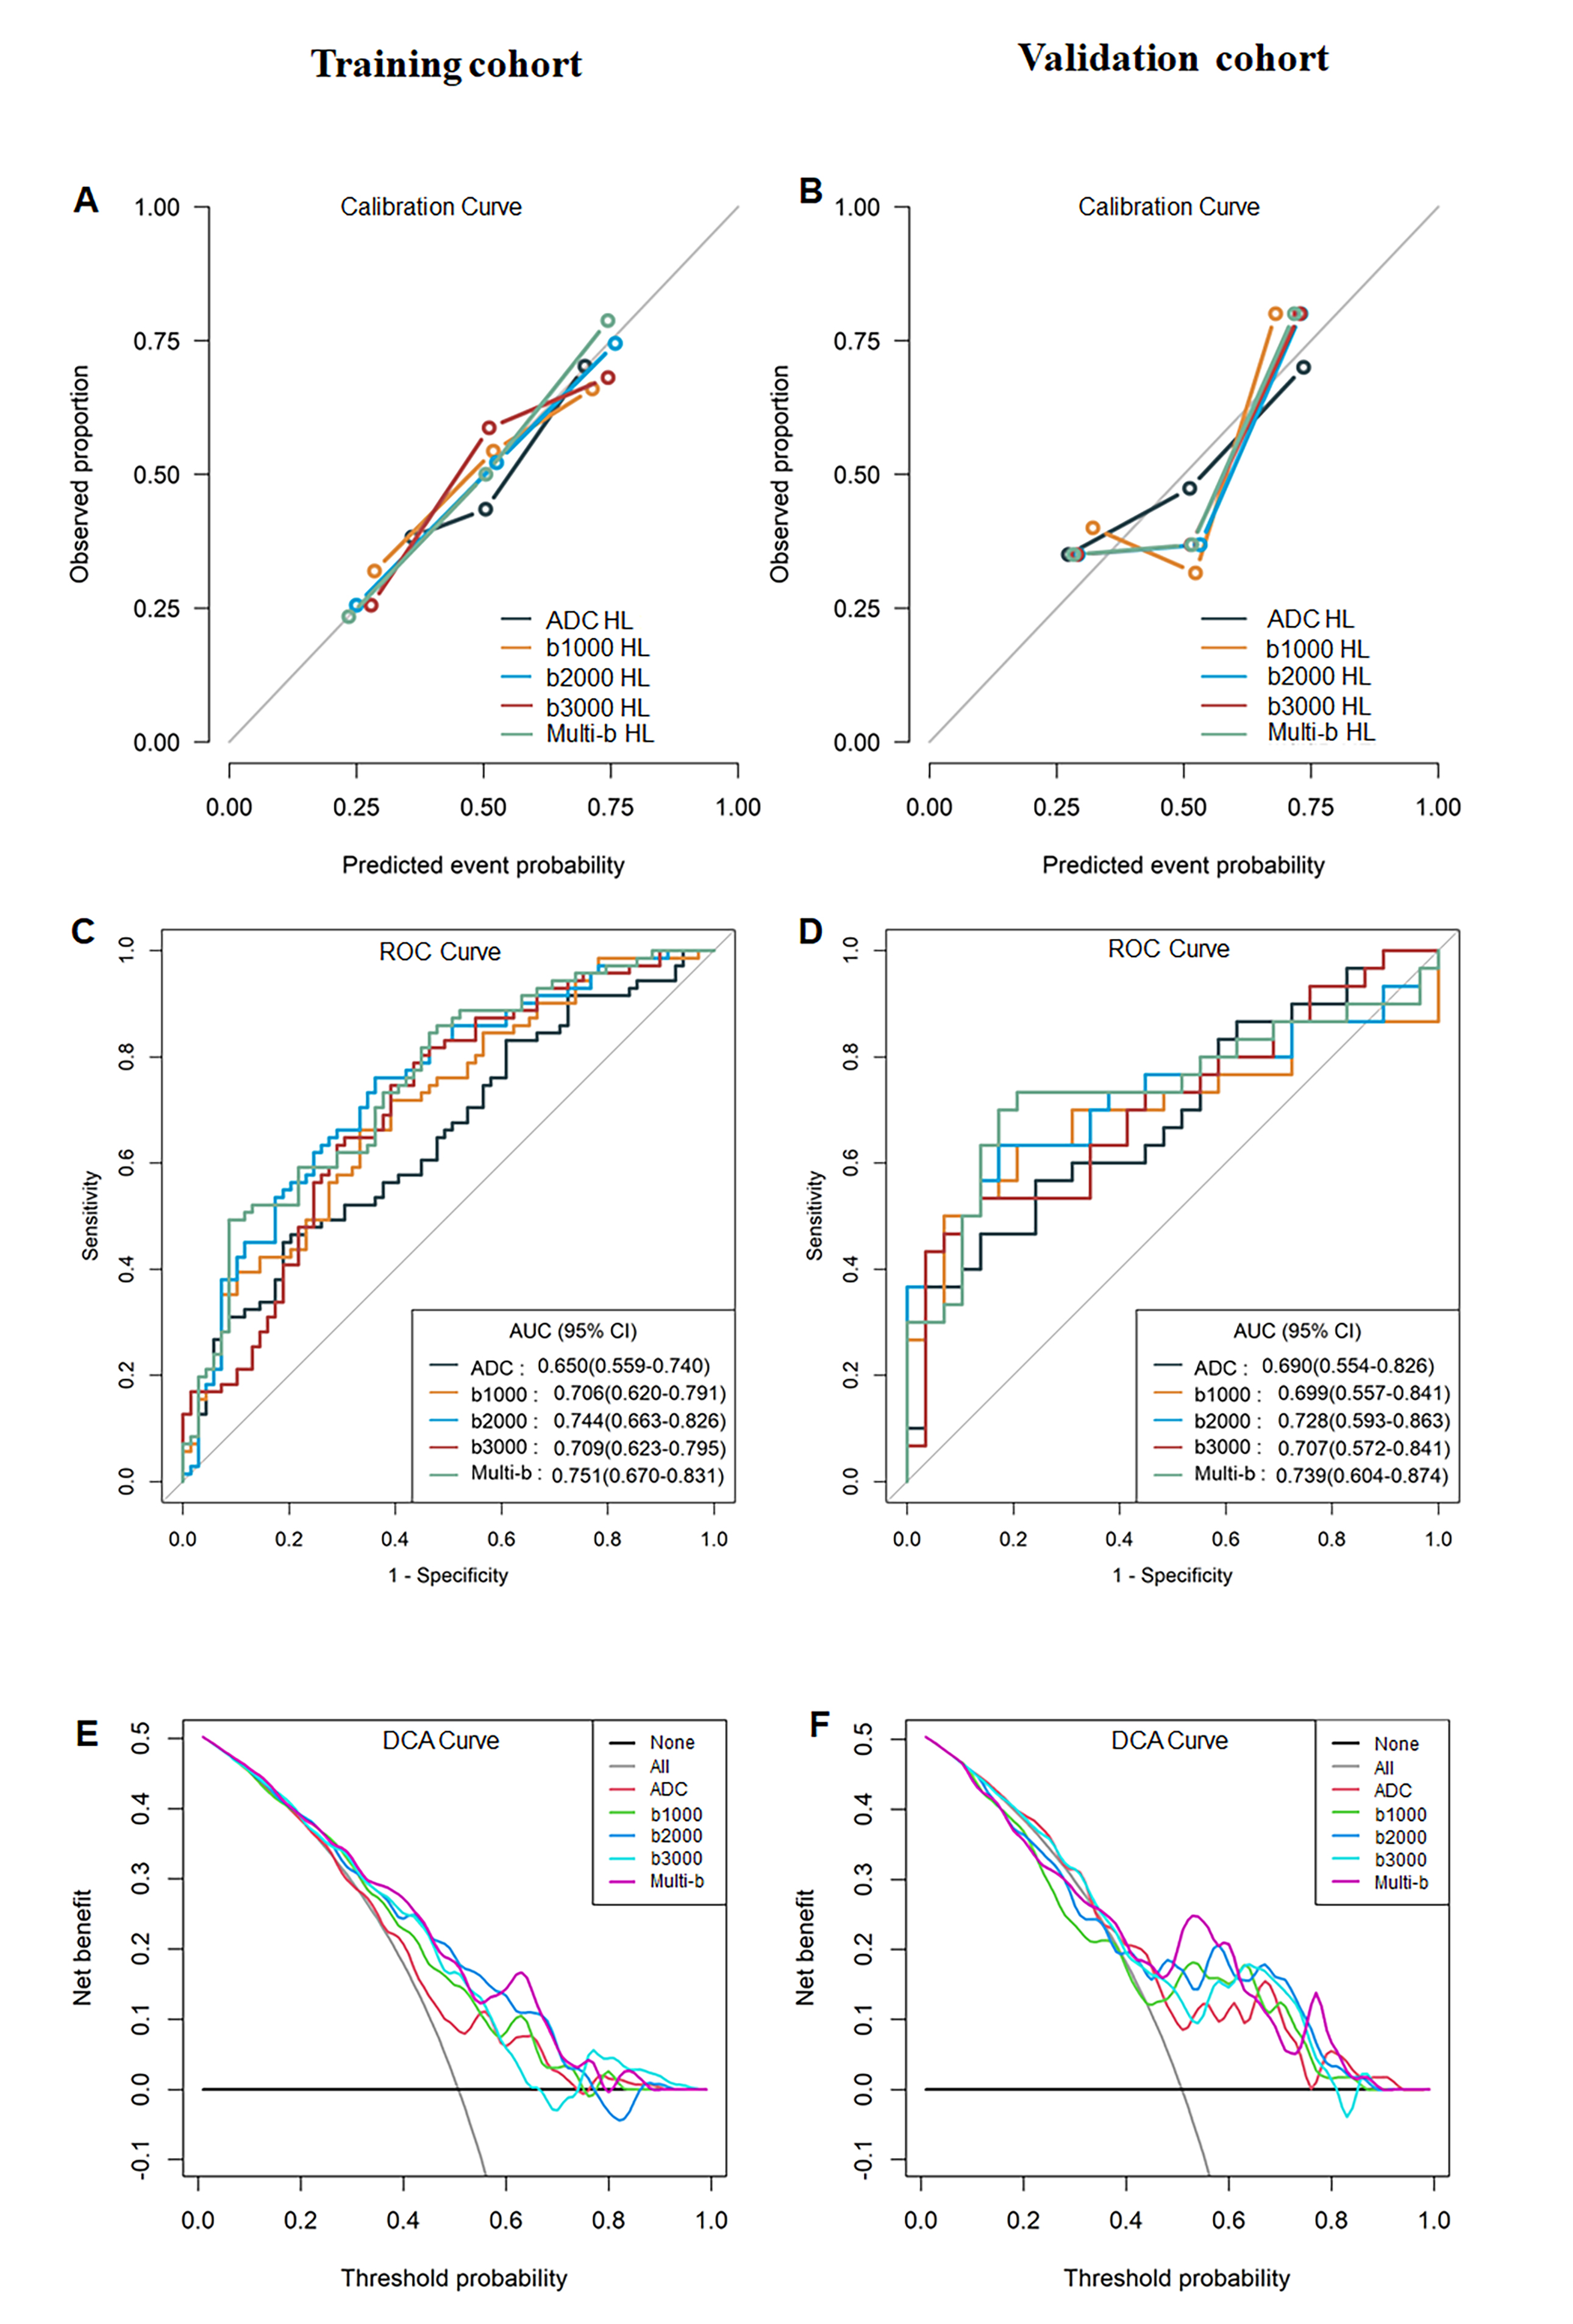
This study was approved by the institutional review board and the written informed consent was obtained from all subjects. This retrospective study included 199 patients with RC who had underwent multi-b value DWI in a 3.0-T MR scanner. Radiomic features of VOI were implemented by a PHIgo-AK software (GE Healthcare, China) based on PyRadiomics. Subjective (five-point Likert scale) and objective assessment (signal-to-noise ratio (SNR), contrast-to-noise ratio (CNR), and signal-intensity ratio (SIR) of quality image were performed at DWIb1000, DWIb2000 and DWIb3000 by two radiologists. The enrolled patients were then divided into a training cohort (n=140) and validation cohort (n=59) at a ratio of 7:3. Radiomics features were extracted within the volume of interest of tumor on ADC map (b=0, 1000 s/mm2), DWIb1000, DWIb2000 and DWIb3000. Five prediction models for regional lymph node metastasis were developed based on selected features by using univariate Wilcox-rank sum test, Pearson correlation coefficient, Least absolute shrinkage and selection operator (LASSO), and multivariate logistic regression analyses. The performance of radiomic models were evaluated with receiver operating characteristic (ROC) curve, calibration, and decision curve analysis (DCA).RESULTS:
The mean signal intensity of the tumor (SIlesion), SNR, artifact scored, and anatomic differentiability scored gradually decreased as the b value increased. However, the CNR on DWIb2000 was superior to that of DWIb1000 and DWIb3000 (4.59±0.86, 3.82±0.77 and 4.18±0.84, p<0.001, respectively). The SIR value and lesion conspicuity scored in DWIb2000 were the highest among the three sets of DWI sequences. No significant differences between the overall image quality score of DWIb2000 and DWIb1000 were noted (11.41±0.82 VS 11.72±0.75, p=0.059). The overall image quality scored of DWIb2000 was higher than that of DWIb3000 ( p<0.001). Moreover, the area under the curve (AUC) of receiver operating characteristic (ROC) for radiomics model based on ADC maps, DWIb1000, DWIb2000, DWIb3000, and multi-b value DWI in predicting LNM were 0.690, 0.699, 0.728, 0.707 and 0.739 in the validation cohorts, respectively. The AUC values of radiomic models based on DWIb2000 was higher than conventional ADC maps, DWIb1000 and DWIb3000. The radiomics model based on multi-b value DWI performed best in predicting LNM and had good net benefits.DISCUSSION:
This study has demonstrated that DWIb2000 exhibits superior CNR and SIR values, along with moderate SNR values. Importantly, there was no significant discrepancy in the overall image quality score between DWIb2000 and DWIb1000. The DWIb2000 model has displayed more robust classification performance than all individual models, implying that DWIb2000 holds substantial potential for tumor detection and the prediction of LNM in RC. This outcome can be attributed to two main factors. Firstly, DWIb2000 offers significant advantages in terms of CNR, SIR, and lesion conspicuity (p < 0.001). This leads to the creation of a clearer visual boundary, enhancing the accuracy of manual lesion delineation and facilitating the extraction of quantitative high-dimensional features from the Volume of Interest (VOI). Consequently, this improves the reliability and stability of the radiomic features. Secondly, previous research has indicated that histogram features of the apparent diffusion coefficient (ADCaqp), based on ultra-high b-value DWI, exhibit correlations with Aquaporin-1 (AQP1) staining intensity (p < 0.05)7. Additionally, other studies have shown that radiomic features derived from the ADC3000 or ADC2000 maps possess higher diagnostic value than ADC in predicting AQP1 expression in RC8. Ultra-high b-value DWI can provide more powerful insights into AQP1 expression and RC prognosis compared to traditional DWI. Notably, AQP1 expression has been associated with lymph node metastasis and poorer survival outcomes9.Acknowledgements
We thank Dr. Xiaocheng Wei for helping to proofread the manuscriptReferences
1. BENSON A B, VENOOK A P, AL-HAWARY M M, et al. NCCN Guidelines Insights: Rectal Cancer, Version 6.2020 [J]. J Natl Compr Canc Netw, 2020, 18(7): 806-15.
2. TOMASZEWSKI M R, GILLIES R J. The Biological Meaning of Radiomic Features [J]. Radiology, 2021, 298(3): 505-16.
3. JIA H, JIANG X, ZHANG K, et al. A Nomogram of Combining IVIM-DWI and MRI Radiomics From the Primary Lesion of Rectal Adenocarcinoma to Assess Nonenlarged Lymph Node Metastasis Preoperatively [J]. J Magn Reson Imaging, 2022, 56(3): 658-67.
4. WONG C, FU Y, LI M, et al. MRI-Based Artificial Intelligence in Rectal Cancer [J]. J Magn Reson Imaging, 2023, 57(1): 45-56.
5. TANG L, ZHOU X J. Diffusion MRI of cancer: From low to high b-values [J]. J Magn Reson Imaging, 2019, 49(1): 23-40.
6. ZHANG G, XU Z, ZHENG J, et al. Ultra-high b-Value DWI in predicting progression risk of locally advanced rectal cancer: a comparative study with routine DWI [J]. Cancer Imaging, 2023, 23(1): 59.
7. ZHANG G, MA W, DONG H, et al. Based on Histogram Analysis: ADC(aqp) Derived from Ultra-high b-Value DWI could be a Non-invasive Specific Biomarker for Rectal Cancer Prognosis [J]. Sci Rep, 2020, 10(1): 10158.
8. CHEN Y, LI B, JIANG Z, et al. Multi-parameter diffusion and perfusion magnetic resonance imaging and radiomics nomogram for preoperative evaluation of aquaporin-1 expression in rectal cancer [J]. Abdom Radiol (NY), 2022, 47(4): 1276-90.
9. ZHANG G, HAO Y, CHEN L, et al. Expression of aquaporin 1, 3 and 5 in colorectal carcinoma: correlation with clinicopathological characteristics and prognosis [J]. Pathol Oncol Res, 2023, 29: 1611179.
Figures