3982
Predicting Disease-Free Survival in Rectal Cancer Patients via Radiomics Signatures from Multi-Modality MRI Images: a multi-center study1Shanghai Key Laboratory of Magnetic Resonance, East China Normal University, Shanghai, China, 2Department of Radiology, Fudan University Shanghai Cancer Center, Shanghai, China, 3MR Research Collaboration, Siemens Healthineers, Shanghai, China, 4Institute of Research and Clinical Innovations, Neusoft Medical Systems Co., Ltd, Beijing, China
Synopsis
Keywords: Cancer, Data Analysis
Motivation: Accurate prediction of disease-free survival (DFS) of rectal cancer patients has substantial influences on treatment planning.
Goal(s): To explore the value of ADC and T2W images in predicting DFS for rectal cancer patients.
Approach: Radiomics models using features extracted from ADC and T2W were built and evaluated.
Results: Models built with ADC features and clinical variables achieved C-Index values of 0.675 and 0.768 over the internal and external test cohorts, respectively. Models built with T2W features and clinical variables achieved C-Index values of 0.724 and 0.747 over the internal and external test cohorts, respectively.
Impact: Both the shape features extracted from ADC maps and the first-order features extracted from T2W images demonstrated strong predictive power for DFS estimation, implying the potential of combination anatomical images with diffusion models to predict DFS in rectal cancer patients.
Introduction
Rectal cancer (RC) is a widespread malignancy with a significant global impact, and its high recurrence rate contributes to its substantial mortality1. While progress has been made in reducing the risk of local recurrence or distant metastasis (ROM) following surgery through the refinement of standard adjuvant therapies, including radiation and chemotherapy, it still affects approximately 30% of RC patients2, 3.Survival analysis is vital for understanding and predicting outcomes for patients with rectal cancer and influences clinical decisions. MRI is an important modality for diagnosis of rectal cancer and diffusion MRI can provide extra information about the microstructure and organization of biological tissues, therefore, we hypothesized that combining radiomics features from structural T1W images and diffusion MRI might improve the prediction of DFS.
Methods
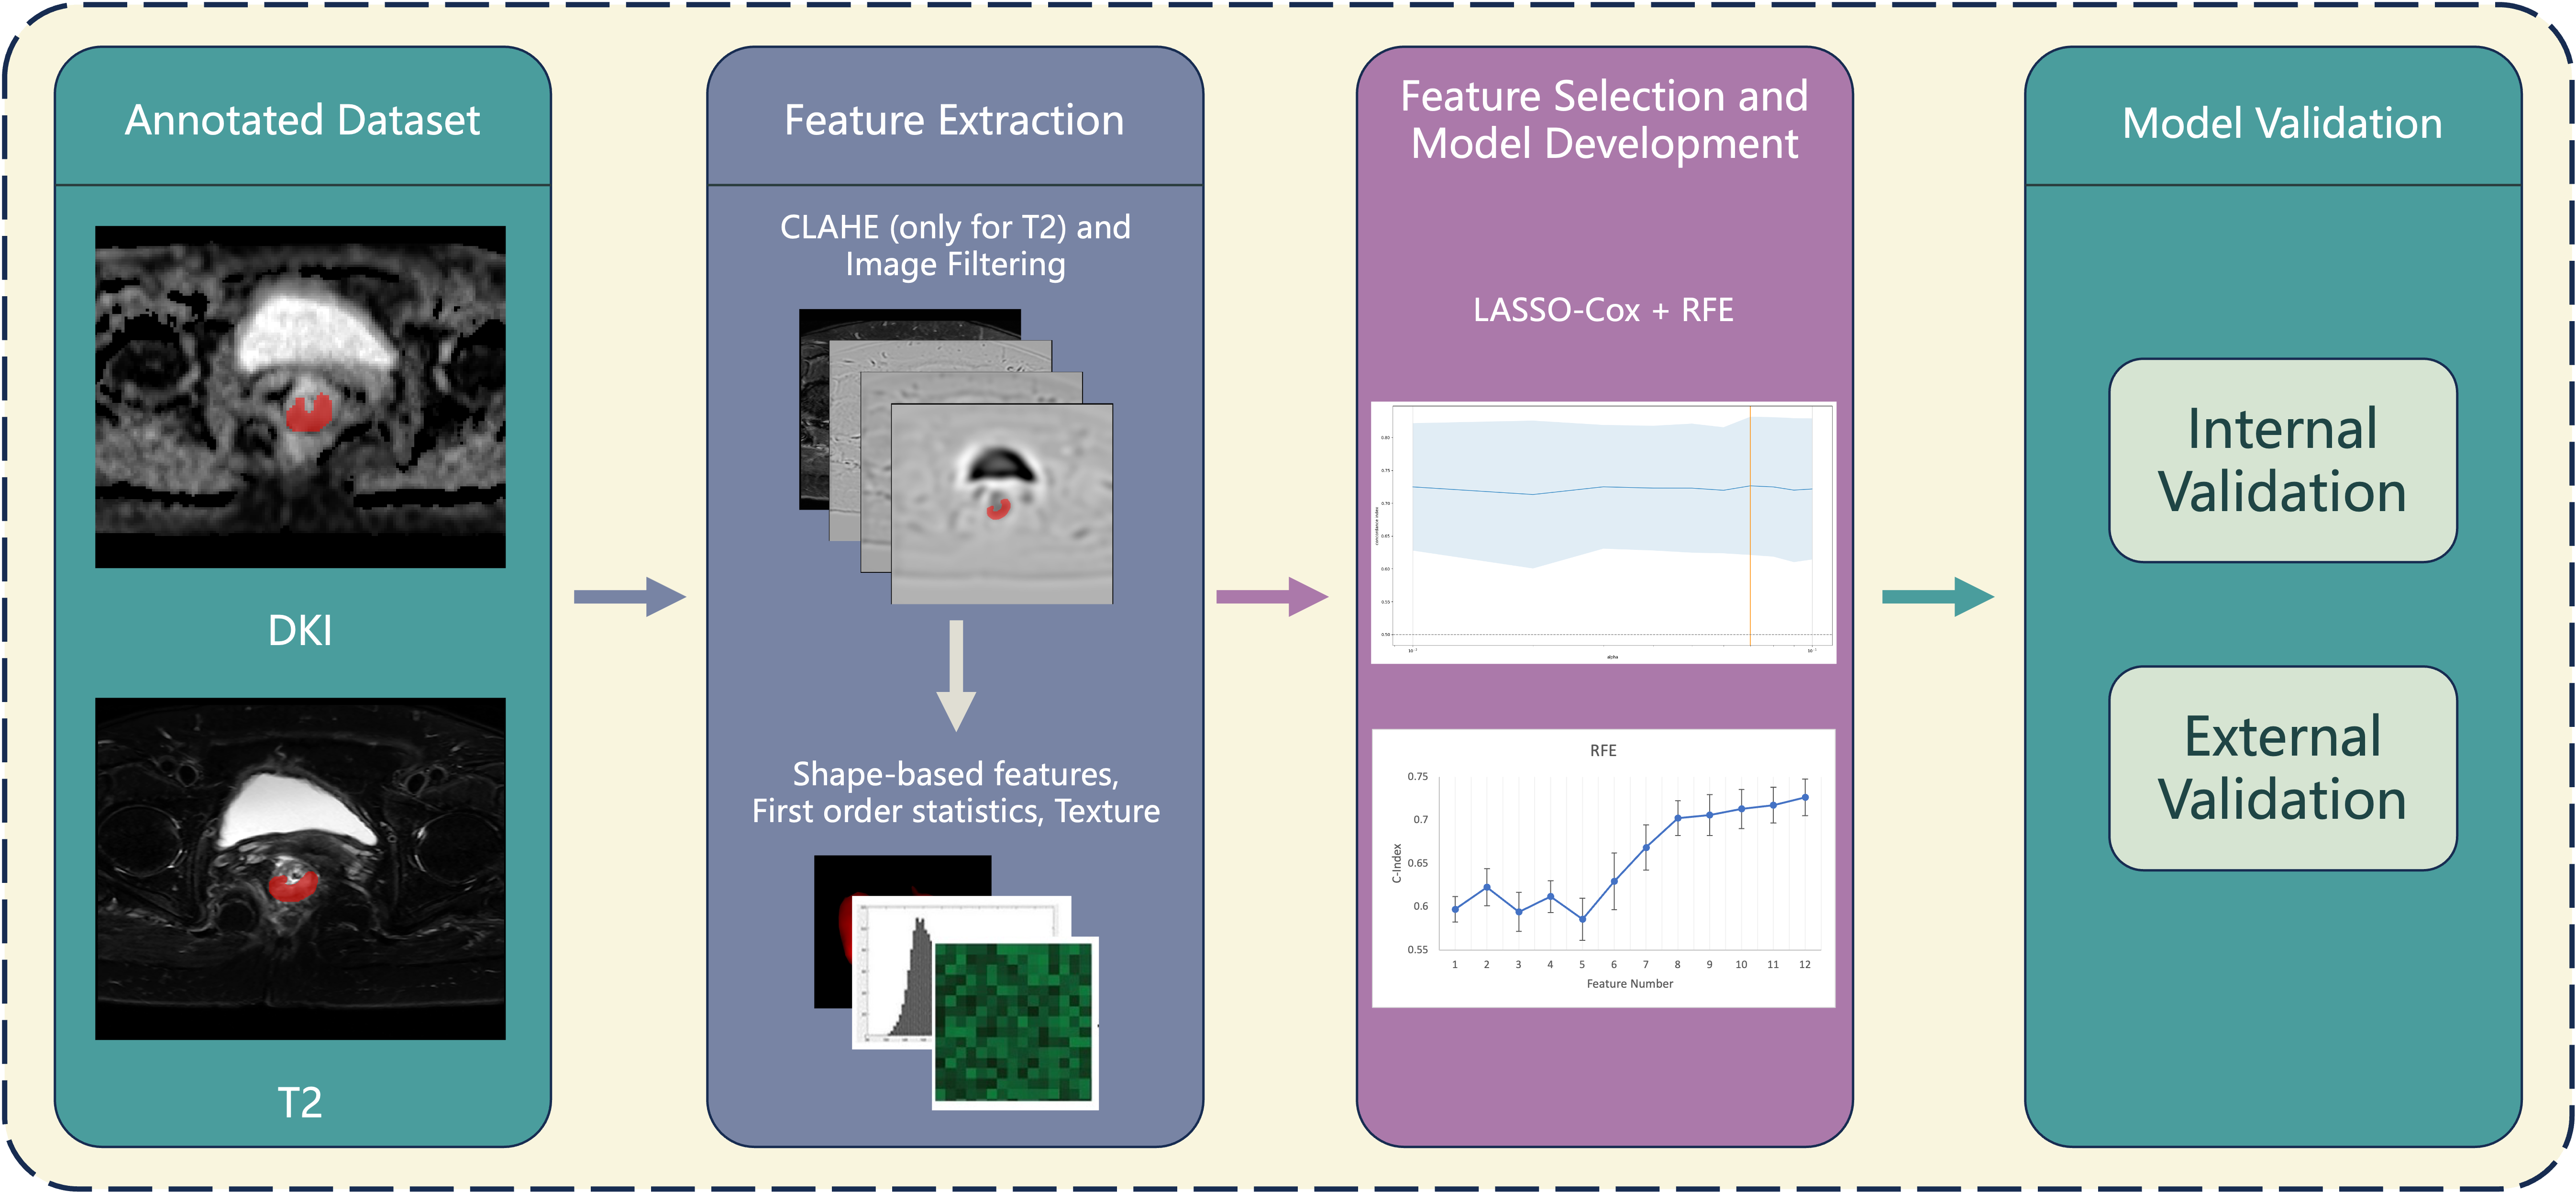
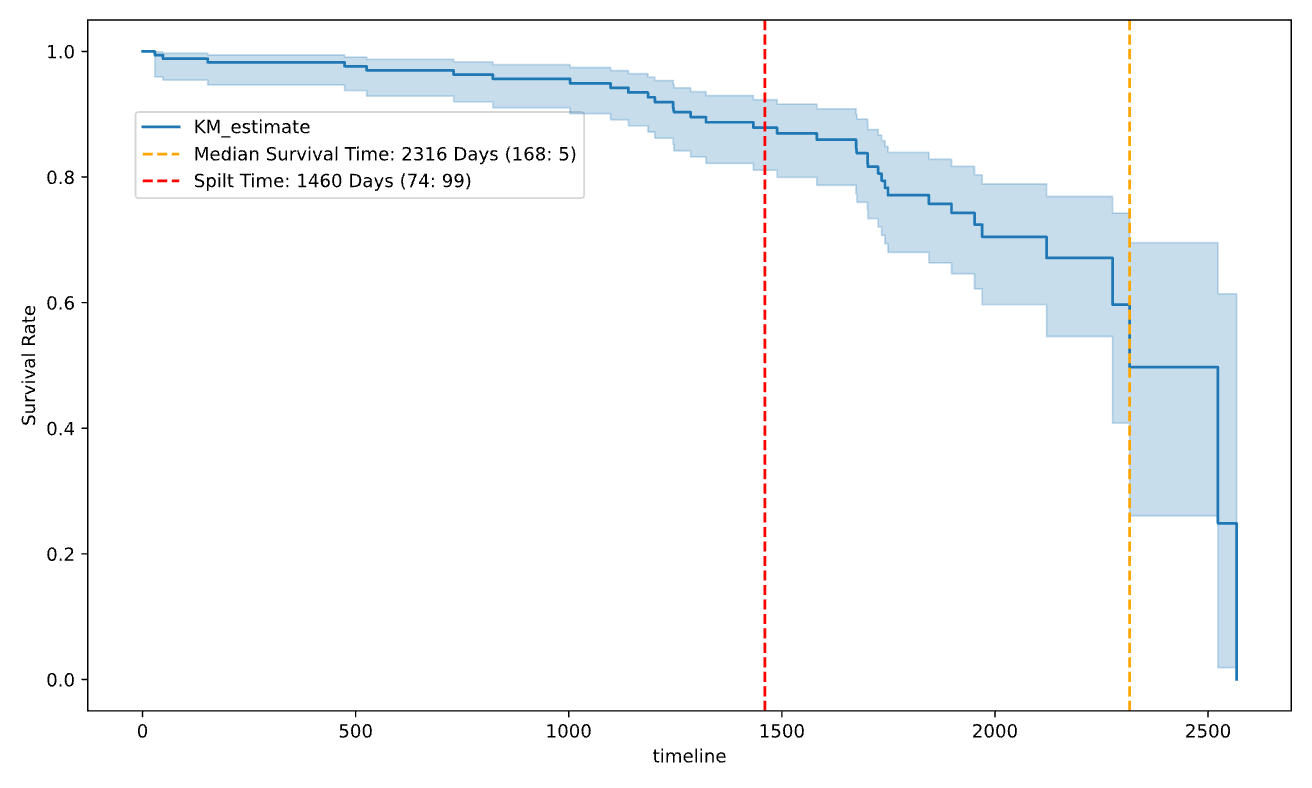
A total of 220 participants were retrospectively collected from two institutes. Participants from institute 1 were split into a training (N=121) and an internal test cohort (N=52, institute 1), and participants from institute 2 were used as an external test cohort (N=47). All MRI examinations were performed on 3-T scanners (Skyra, SIMENS Medical Systems, Germany). The imaging sequences included T2-weighted and diffusion weighted imaging (DWI). ADC maps were derived from DWI images, and used with T2W images to build radiomics models.The workflow is depicted in Figure 1. Before radiomic feature extraction, we normalized image intensity to the range of [0, 1]. Contrast Limited Adaptive Histogram Equalization (CLAHE) was used to enhance T2W images. Radiomic features were extracted from ROIs with PyRadiomics (ver. 3.0.1)4 from both ADC maps and T2 images. Features extracted included 14 shape features, 18 first-order statistics, and 75 texture features obtained from the original images, as well as images filtered with Laplacian of Gaussian (LoG) with different sigma values (1.0, 3.0, and 5.0). Totally, we extracted 386 radiomics features from each ROI. All radiomics features were standardized with z-score. As shown in Figure 2, to make sure the survival time distributed equally in the training and test cohorts, we split the study cohort into early-stage and late-stage groups by survival time of 4 years, then we split each group into training and testing cohorts with the same ratio. We used a heuristic approach to select features, in which features were grouped into subgroups (shape, original first-order, original texture, LoG first-order and LoG texture) and a scout model was built for features of each group, and features retained in the scout model with a validation C-Index ≥ 0.6 were used for further model construction. When building the scout models or the final model, LASSO-Cox regression in conjunction with Recursive Feature Elimination (RFE) was used for feature selection, different from previous work5. Five-fold cross validation was used to determine the optimal alpha value of LASSO-Cox, and then RFE was used to further select features retained in model. In the end, we developed two separate optimal models, using ADC features and T2W features. Features retained in the radiomics models were also combined with clinical variables to build combined models. All models were built with scikit-survival (ver.0.19.0)6, a Python module for survival analysis built on top of scikit-learn.Results
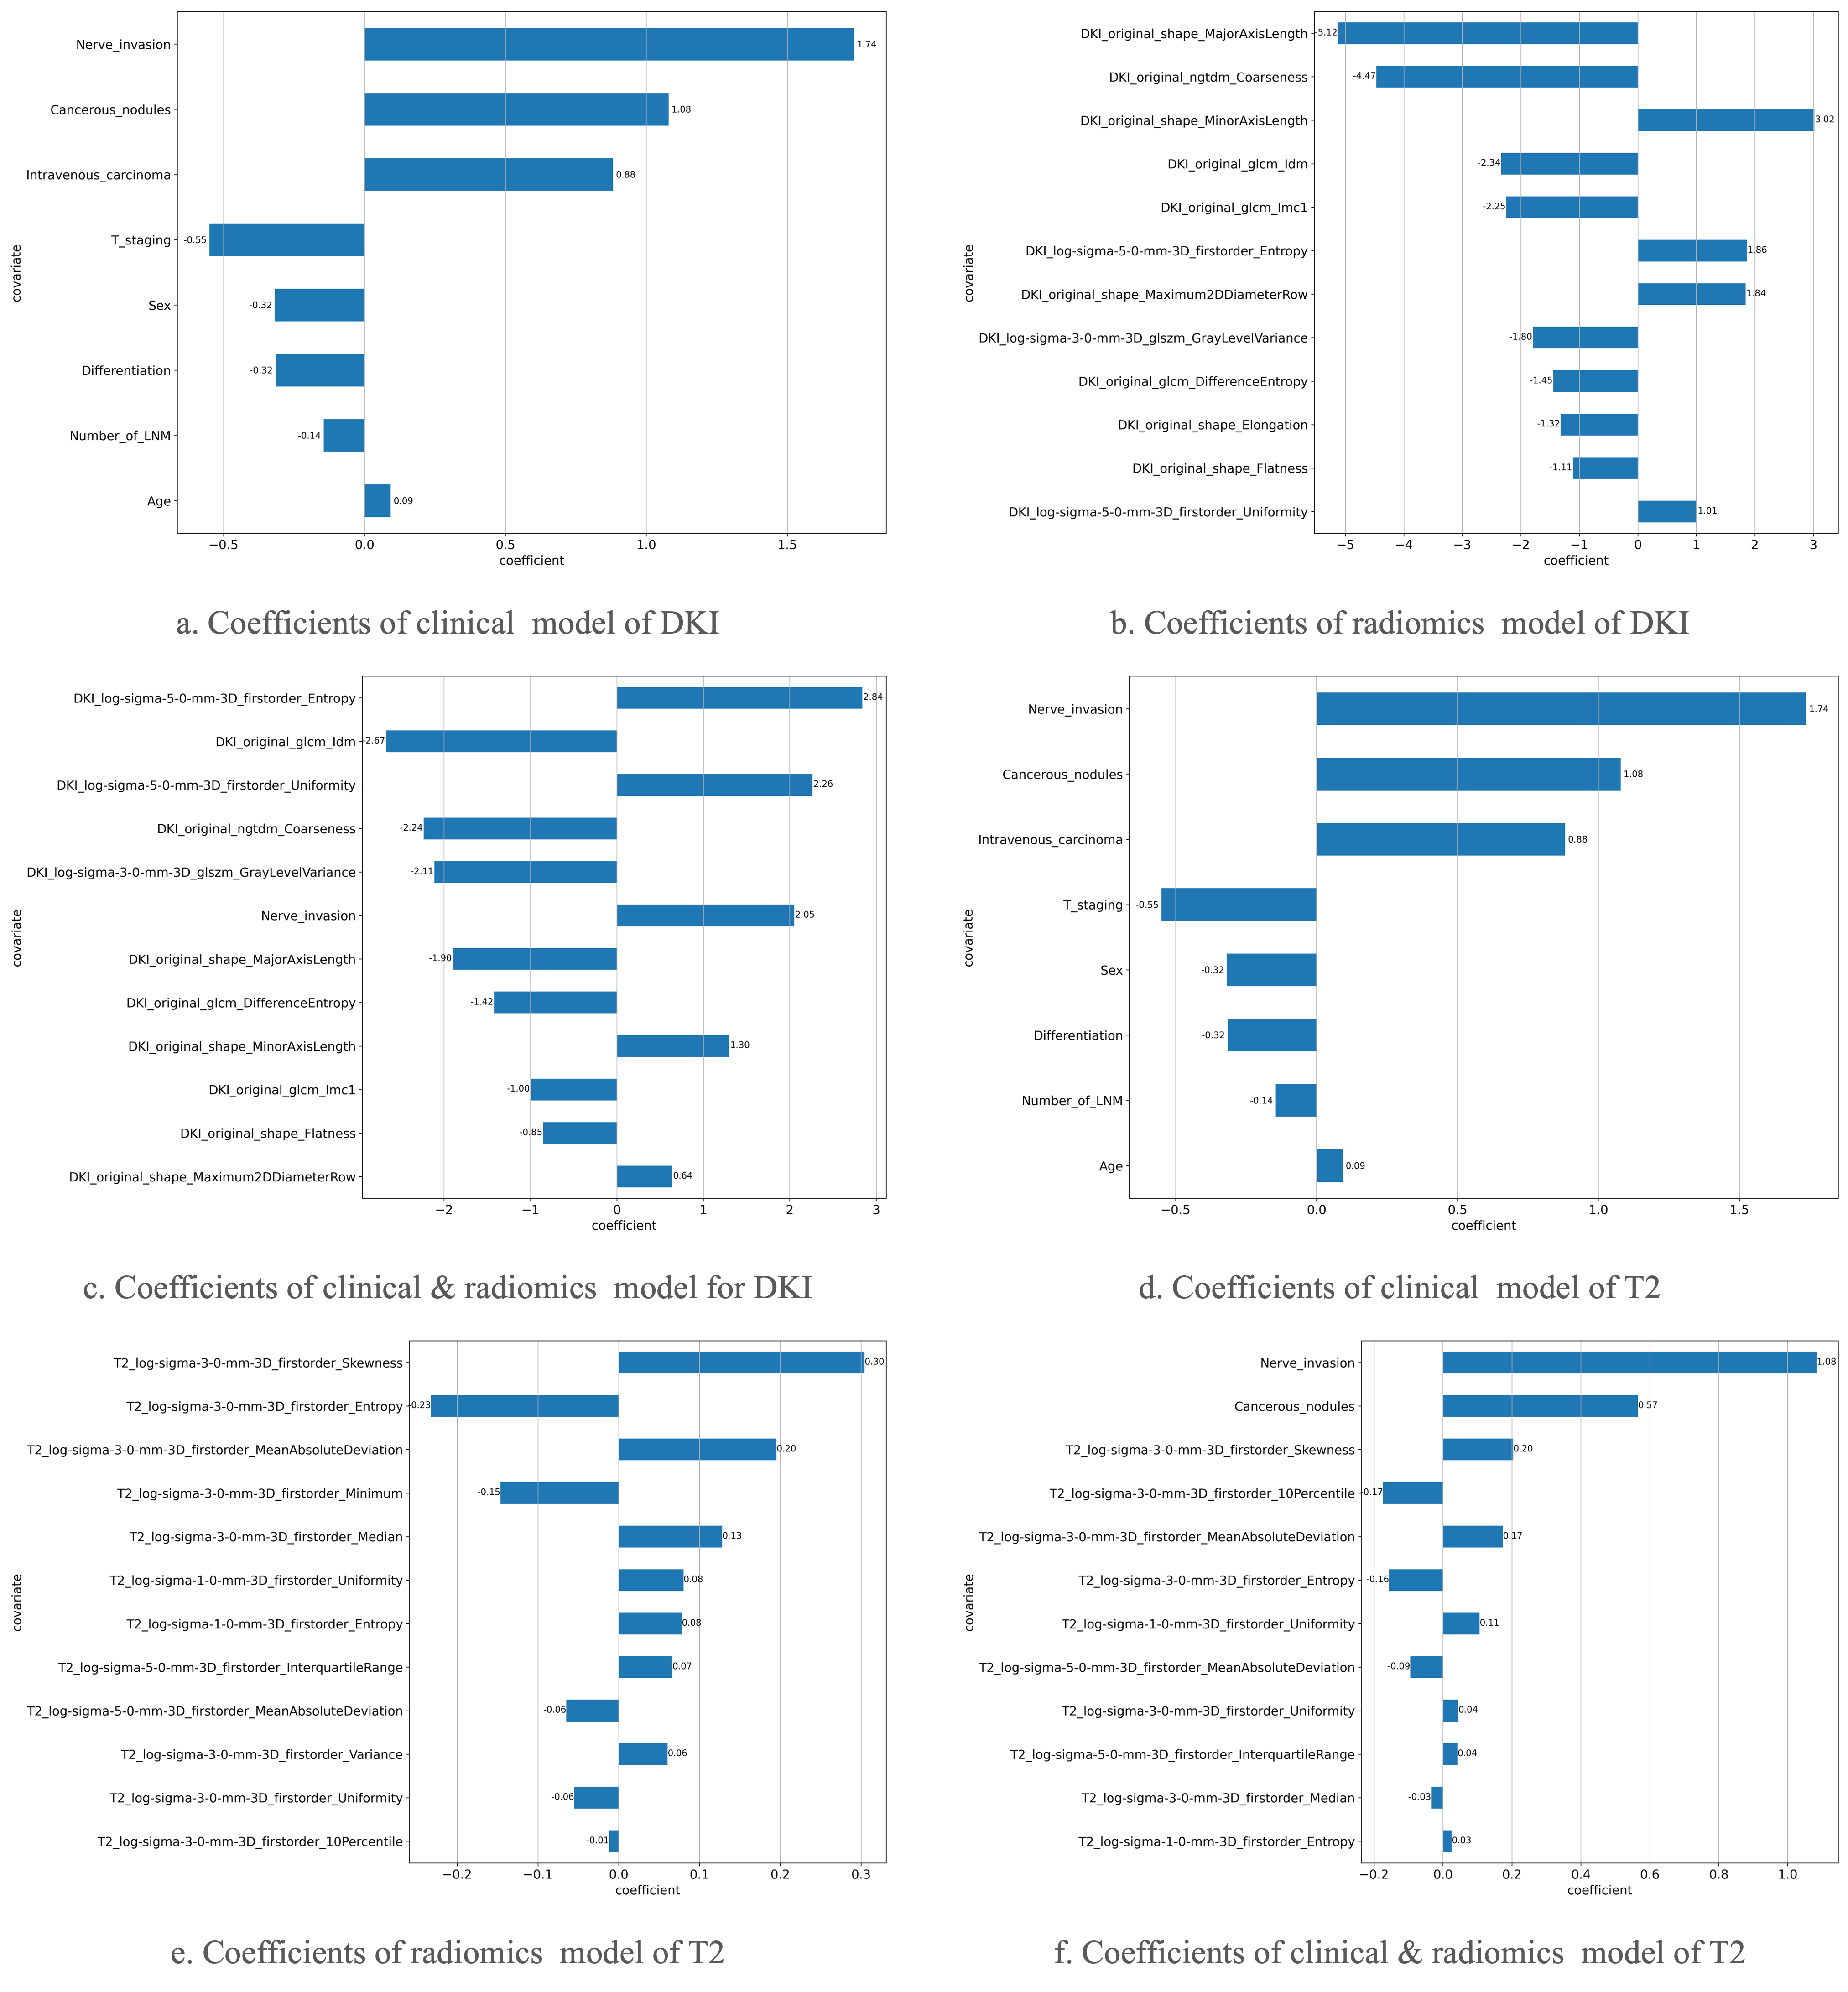
The best models constructed using subgroups of features are listed in Table 1, incorporate baseline clinicopathologic characteristics, including sex, age, carcinoembryonic antigen (CEA), carbohydrate antigen 19 (CA-19), anal verge, lymph node metastasis (LNM), cancerous nodules, T stage, tumor differentiation, intravascular tumor embolus, and neural invasion. Our study indicated that shape features extracted from ADC maps outperformed clinical features, achieving a C-index value of 0.673 in the internal validation cohort using radiomics alone, and an impressive 0.768 when combined with clinical features in the external validation cohort. First-order features extracted from LoG-filtered T2 images achieved a C-index of 0.615, and when combined with clinical variables, the combined model achieved improved C-index values of 0.724 and 0.747 over the internal and external test cohorts, respectively. Coefficients (i.e., logarithm of the hazard rate) of the selected features are visualized in Figure 3.Discussion
To create a more equally-distributed training and test cohorts, we split the study cohort into subgroups using a 4-year DSF threshold. Our experimental results demonstrated the usefulness of this approach. Our modeling results highlighted the significant contributions of shape features extracted from ADC maps and first-order features extracted from LoG filtered T2W images in predicting DFS for rectal cancer patients. Future research should address the challenge of survival time imbalance and new data splitting strategy can be involved to ensure the same distributions of subjects in training and testing cohorts. Besides, more diffusion related models and parameters can be explored.Acknowledgements
No acknowledgement found.References
1. Siegel RL, Miller KD, Fuchs HE, Jemal A. Cancer statistics, 2022. CA Cancer J Clin. 2022;72(1):7–33.
2. Glynne-Jones R, Wyrwicz L, Tiret E, Brown G, Rodel C, Cervantes A, et al. Rectal cancer: ESMO Clinical Practice Guidelines for diagnosis, treatment and follow-up. Ann Oncol. 2018;29(Suppl 4):iv263.
3. Jeffery M, Hickey BE, Hider PN. Follow-up strategies for patients treated for non-metastatic colorectal cancer. Cochrane Database Syst Rev. 2019;9:CD002200.
4. Van Griethuysen J J M, Fedorov A, Parmar C, et al. Computational radiomics system to decode the radiographic phenotype. Cancer research. 2017; 77(21): e104-e107.
5. Liu Z, Wang Y, Shen F, et al. Radiomics based on readout-segmented echo-planar imaging (RS-EPI) diffusion-weighted imaging (DWI) for prognostic risk stratification of patients with rectal cancer: a two-centre, machine learning study using the framework of predictive, preventive, and personalized medicine[J]. EPMA Journal, 2022, 13(4): 633-647.
6. S. Pölsterl. “scikit-survival: A Library for Time-to-Event Analysis Built on Top of scikit-learn,” Journal of Machine Learning Research. 2020; 20(212): 1–6.
Figures