3980
Value of orthogonal axial MR images in T-staging for gastric cancer: a retrospective comparison1The First Affiliated Hospital, Sun Yat-sen University, GuangZhou, China, 2The Seventh Affiliated Hospital, Sun Yat-sen University, ShenZhen, China, 3MR Scientific Marketing, SIEMENS Healthineers Ltd., Shanghai, ShangHai, China
Synopsis
Keywords: Digestive, Cancer
Motivation: Orthogonal axial images (OAI), which may improve staging performance, had been ignored in previous studies about gastric cancer (GC) T-staging using MRI.
Goal(s): To assess the value of MR OAI in GC preoperative T-staging.
Approach: Diagnostic performance metrics, over- and understaging fractions, overall accuracy (compared by McNemar test) for MRI lacking or incorporating OAI and MDCT were quantified referring to pathological T-stage.
Results: The overall accuracy was significantly higher for MRI with OAI than those without OAI, while marginally better than MDCT. Both MRI with OAI and MDCT exhibited superior staging performance than MRI without OAI.
Impact: By incorporating orthogonal axis images, MRI exhibited diagnostic performance marginally better than MDCT in preoperative T-staging of gastric cancer, thereby offering a superior, non-invasive and radiation-free protocol to determine prognosis and guide appropriate treatment strategies.
Introduction
In gastric cancer (GC) T-staging, endoscopic ultrasound (EUS) and multi-detector CT (MDCT) are commonly employed 1-7. However, they have drawbacks like highly operator-dependence and the injection of iodine contrast medium 1,8,9. Therefore, MRI is gaining ground in T-staging of GC, with performance comparable to EUS and MDCT 3,7,10,11. However, previous studies omitted orthogonal axial scans 3,10,12,13,14, which are emphasized in rectal cancer (RC) T-staging 15,16.This study aims to determine the value of MR orthogonal axial images (OAI) in GC preoperative T-staging by comparing staging performance of MRI with and without orthogonal axial images (OAI) against MDCT.
Methods
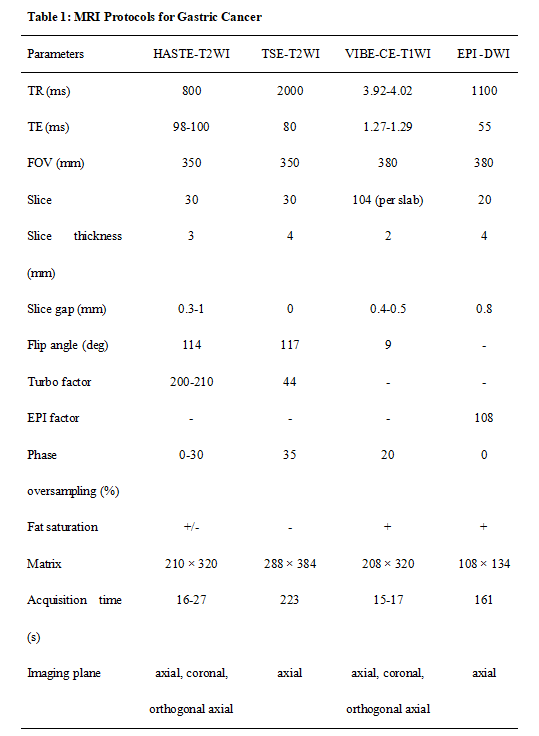
133 patients who had undergone preoperative abdominal MDCT and stomach MRI following by surgery were included. Prior to imaging, all patients were instructed to fast, inject antiperistaltic agents and ingest water to distend the stomach. MRI examinations were performed on Magnetom Vida 3T MR scanner (Siemens Healthcare, Erlangen, Germany) with parameters presented in Table 1. Non-enhanced MRI included axial, coronal, and orthogonal axial half-Fourier acquisition single-shot turbo spine-echo (HASTE) T2WI, and axial turbo spin-echo (TSE) T2WI. Subsequently, axial diffusion-weighted imaging (DWI) was acquired using a free-breathing, single-shot echo-planar imaging (EPI) sequence with b values of 0 and 800 mm2/s. Contrast-enhanced MRI included axial, coronal, and orthogonal axial contrast-enhanced T1WI were obtained using the volumetric interpolated breath-hold examination (VIBE) sequence. The orthogonal axial position was prescribed to be perpendicular to the gastric wall where the deepest tumor invasion was identified in axial or coronal images. MDCT examinations were performed on Aquilion PRIME (Toshiba Medical System) and IQon (Philips Healthcare), using protocols designed for GC patients. The venous phase images were obtained 70 seconds post injection of iodinated contrast agent. Independently and in consensus, two radiologists evaluated three image sets: MRI lacking or incorporating OAI, and MDCT images. Pathological data was reviewed by a pathologist according to AJCC 8th edition17. The diagnostic performance (accuracy, sensitivity and specificity) for each image set at each T-stage, over- and understaging fractions, and the overall accuracy were computed using pathologic T-stage as reference. To compare the overall accuracy of each image set, the McNemar test was employed. To assess interobserver agreement, the weighted kappa value with a 95% confidence interval (CI) was calculated. Statistical significance was inferred at P < 0.05.Results
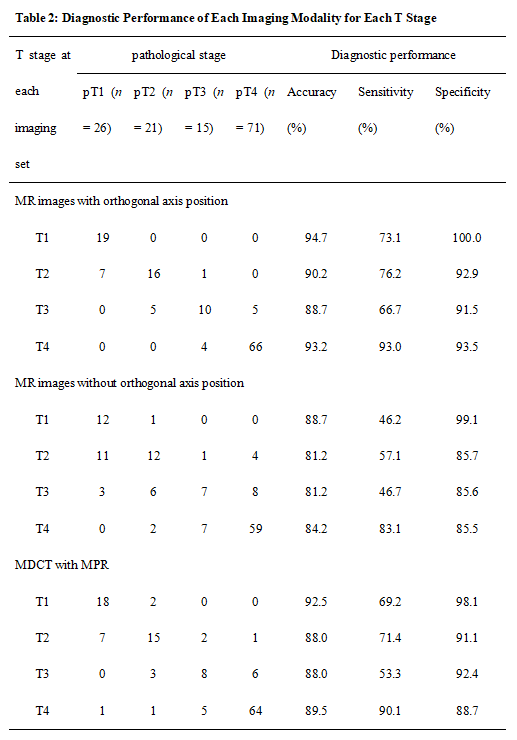
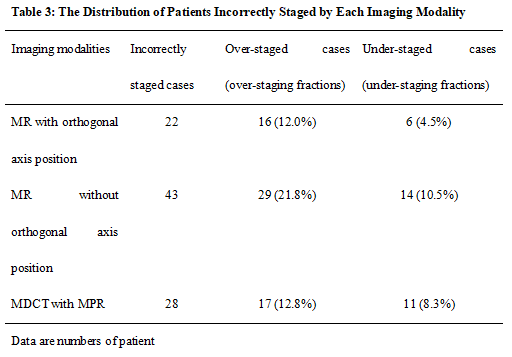
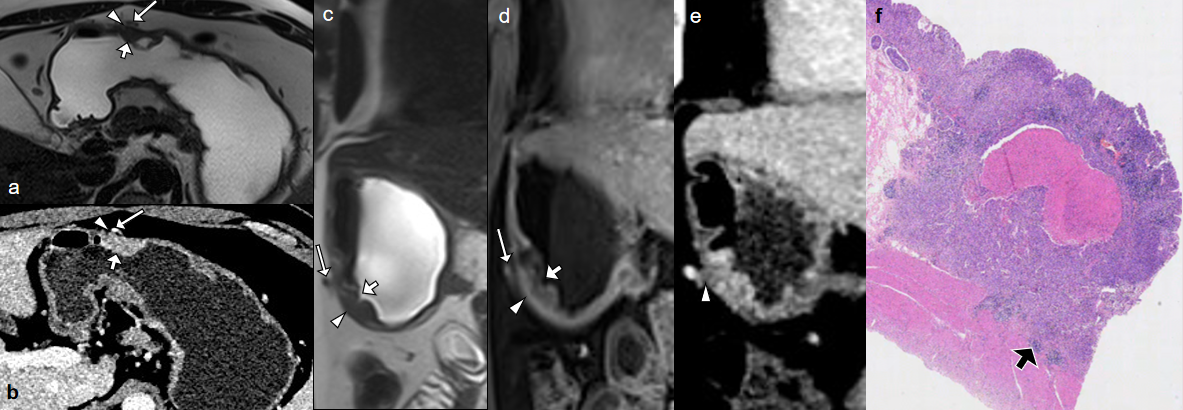
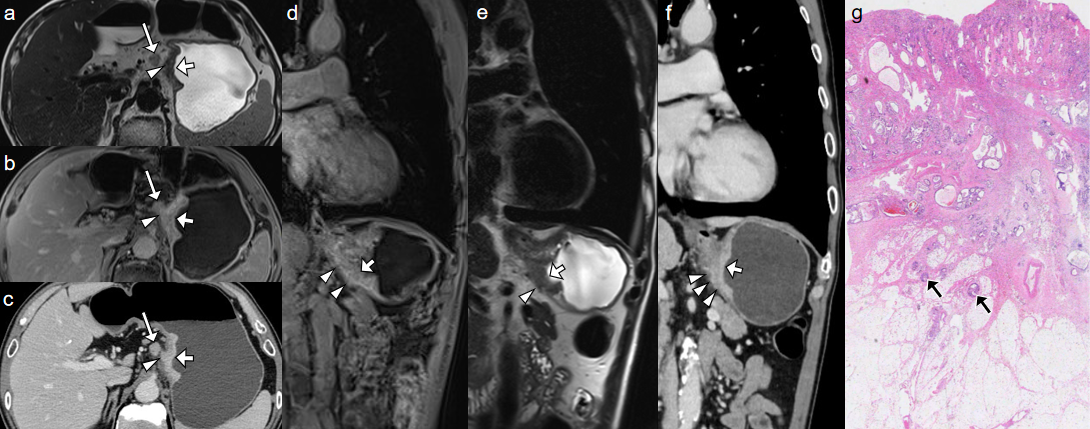
For pathology, 26 tumors were staged as pT1 (19.5%), 21 as pT2 (15.8%), 15 as pT3 (11.3%), and 71 as pT4a (53.4%). Table 2 displayed the diagnostic performance (accuracy, sensitivity and specificity) for each T-stage of each imaging set. Both MR with OAI and MDCT with MPR exhibited superior diagnostic performance across each T-stage of GC than MRI without OAI. The overall accuracy for T-staging of GC was significantly higher for MRI with OAI compared to those without them (83.5% vs 67.7%, P < 0.001), and was comparable to that of MDCT with MPR (83.5% vs 78.9%, P = 0.345). Table 3 showed the distribution of patients incorrectly staged by each image set. Incorporating OAI led to a notable reduction in overstaging fraction (from 21.8% to 12.0%) and understaging fraction (from 10.5% to 4.5%), as opposed to MRI without OAI. Figure 1 and 2 showed image examples of two patents, alongside corresponding histopathological features. The weighted kappa values were as follows: 0.823 (excellent consistency, 95% CI: 0.762, 0.883) for MRI with OAI, 0.594 (moderate consistency, 95% CI: 0.501, 0.686) for MRI without OAI, and 0.751 (good consistency, 95% CI: 0.686, 0.817) for MDCT with MPR.Discussion
This study represents the first attempt to evaluate the utility of MR OAI in preoperative T-staging of GC, which is crucial but had been ignored by previous studies. Our results suggest that the diagnostic performance of MRI for GC T-staging can be significantly increased by incorporating OAI. Furthermore, MRI incorporating OAI can serve as an effective tool for preoperative T-staging in GC, with diagnostic performance slightly superior to MDCT. Additionally, incorporating OAI led to a notable reduction in both over- and understaging cases, thereby guiding appropriate treatment. Meanwhile, MRI with OAI shows better consistency between radiologists than MDCT, which represents superior repeatability. Last but not least, MRI offers non-invasive evaluation without radiation exposure, superior soft-tissue contrast and functional images, thereby showing prospect in GC evaluation.Conclusion
In summary, MR OAI have demonstrated significant value in the preoperative T-staging in GC. MRI incorporating OAI provides satisfactory T-staging performance for GC, which is marginally better than MDCT.Acknowledgements
We great thank Yun-zhu WU and Miao LIN for their time and valuable contributions to the study.References
1. Ajani JA, D'Amico TA, Bentrem DJ et al. Gastric Cancer, Version 2.2022, NCCN Clinical Practice Guidelines in Oncology. J Natl Compr Canc Netw. 2022; 20:167-192
2. Chen CY, Hsu JS, Wu DC et al. Gastric cancer: preoperative local staging with 3D multi-detector row CT--correlation with surgical and histopathologic results. Radiology. 2007; 242:472-482
3. Joo I, Lee JM, Kim JH, Shin CI, Han JK, Choi BI. Prospective comparison of 3T MRI with diffusion-weighted imaging and MDCT for the preoperative TNM staging of gastric cancer. J Magn Reson Imaging. 2015; 41:814-821
4. Joshi SS, Badgwell BD. Current treatment and recent progress in gastric cancer. CA Cancer J Clin. 2021; 71:264-279
5. Lee IJ, Lee JM, Kim SH et al. Diagnostic performance of 64-channel multidetector CT in the evaluation of gastric cancer: differentiation of mucosal cancer (T1a) from submucosal involvement (T1b and T2). Radiology. 2010; 255:805-814
6. Lordick F, Carneiro F, Cascinu S et al. Gastric cancer: ESMO Clinical Practice Guideline for diagnosis, treatment and follow-up. Ann Oncol. 2022; 33:1005-1020
7. Zhang Y, Yu J. The role of MRI in the diagnosis and treatment of gastric cancer. Diagn Interv Radiol. 2020; 26:176-182
8. Giganti F, Orsenigo E, Arcidiacono PG et al. Preoperative locoregional staging of gastric cancer: is there a place for magnetic resonance imaging? Prospective comparison with EUS and multidetector computed tomography. Gastric Cancer. 2016; 19:216-225
9. Huang Z, Xie DH, Guo L et al. The utility of MRI for pre-operative T and N staging of gastric carcinoma: a systematic review and meta-analysis. Br J Radiol. 2015; 88:20140552
10. Anzidei M, Napoli A, Zaccagna F et al. Diagnostic performance of 64-MDCT and 1.5-T MRI with high-resolution sequences in the T staging of gastric cancer: a comparative analysis with histopathology. Radiol Med. 2009; 114:1065-1079
11. Borggreve AS, Goense L, Brenkman HJF et al. Imaging strategies in the management of gastric cancer: current role and future potential of MRI. Br J Radiol. 2019; 92:20181044
12. Liu S, He J, Guan W et al. Added value of diffusion-weighted MR imaging to T2-weighted and dynamic contrast-enhanced MR imaging in T staging of gastric cancer. Clin Imaging. 2014; 38:122-128
13. Sohn KM, Lee JM, Lee SY, Ahn BY, Park SM, Kim KM. Comparing MR imaging and CT in the staging of gastric carcinoma. AJR Am J Roentgenol. 2000; 174:1551-1557
14. Kang BC, Kim JH, Kim KW et al Value of the dynamic and delayed MR sequence with Gd-DTPA in the T-staging of stomach cancer: correlation with the histopathology. Abdom Imaging. 2000; 25:14-24
15. Kaur H, Choi H, You YN et al. MR imaging for preoperative evaluation of primary rectal cancer: practical considerations. Radiographics. 2012; 32:389-409
16. Nougaret S, Reinhold C, Mikhael HW, Rouanet P, Bibeau F, Brown G. The Use of MR Imaging in Treatment Planning for Patients with Rectal Carcinoma: Have You Checked the "DISTANCE"? Radiology. 2013; 268:329-343
17. Amin MB ES, Greene FL et al. AJCC Cancer Staging Manual, 8th ed. Springer, New York; 2017.
Figures