3977
Amide proton transfer-weighted MRI in predicting tumor budding grade of rectal adenocarcinoma: A prospective pilot study1The Sixth Affiliated Hospital, Sun Yat-sen University, Guangzhou, China
Synopsis
Keywords: Cancer, CEST & MT
Motivation: Tumor budding (TB) is an important additional prognostic factor for patients with colorectal cancer (CRC).
Goal(s): Accurate TB assessment before surgery can help guide clinical decisions and improve patient prognosis.
Approach: This study explored the feasibility of amide proton transfer-weighted (APTw) MR imaging in assessing TB grade in patients with rectal cancer (RC).
Results: We found that RC lesions with high-grade TB had higher APTw 90th percentile values than low-grade TB.
Impact: APTw MRI may be beneficial for implementing more accurate personalized treatment and improving tumor prognosis.
Introduction
Tumor budding, generally defined as the isolated single cancer cell or clusters of up to four cancer cells at the invasive margin, is an important additional prognostic biomarker in CRC [1]. TB has been likened to an epithelial-mesenchymal transition and is commonly associated with more aggressive and migratory potential [2]. Changes in cell morphology and cell metabolism are also important features of TB. Currently, the College of American Pathologists and the International Colorectal Cancer Histopathology Reporting Protocol highlight the importance of detecting TB [3] and making accurate TB assessments before surgery, as this can help guide clinical decisions and improve patient prognosis.TB is usually diagnosed based on biopsy, which is performed during colonoscopy, an invasive method that is not always well accepted by patients. Thus, exploring non-invasive preoperative assessment methods for TB can help the clinical implementation of more accurate personalized treatment and improve tumor prognosis. Amide proton transfer weighted (APTw) MRI is a molecular imaging method based on chemical exchange saturation transfer technology, which can detect endogenous mobile proteins and peptide molecules. Proteomic analysis shows that the abundance of certain metabolic proteins in tumor tissues exhibiting abnormal proliferation is associated with increased APTw signaling [4]. This study investigated the feasibility of APTw MRI imaging in assessing TB grade in patients with RC compared to apparent diffusion constant (ADC).
Methods
This study was approved by the Sixth Affiliated Hospital of Sun Yat-sen University ethics committee, and informed consent was obtained from all study participants (ethics approval number: 2022ZSLYEC-339).A total of 74 patients with pathologically confirmed RC who underwent axial T2WI, diffusion-weighted imaging (DWI), and APTw MRI scans on a 3.0T MRI scanner (Discovery MR750w, GE Healthcare) and then surgery were assessed. All quantitative parameters were measured independently by two radiologists who were blinded to the pathological results; the average value was used for analysis. TB was counted and scored by an experienced pathologist; TB classification was based on the number of buds and was defined as follows: bd1 (low level): 0-4 buds; bd2 (intermediate level): 5-9 buds; bd3 (high level): 10 or more buds. Inter-observer reproducibility of ADC and APT was assessed using intraclass correlation coefficients (ICCs). Differences in APTw-90th percentile and ADC means between Bd grades 1, 2, and 3 were evaluated using the Kruskal-Wallis test. Differences in APTw-90th percentile and ADC means among different TB groups were evaluated using independent samples t-test or Mann-Whitney U test. The diagnostic performance of quantitative parameters was evaluated using receiver operating characteristic (ROC) curve analysis and compared using the DeLong test.
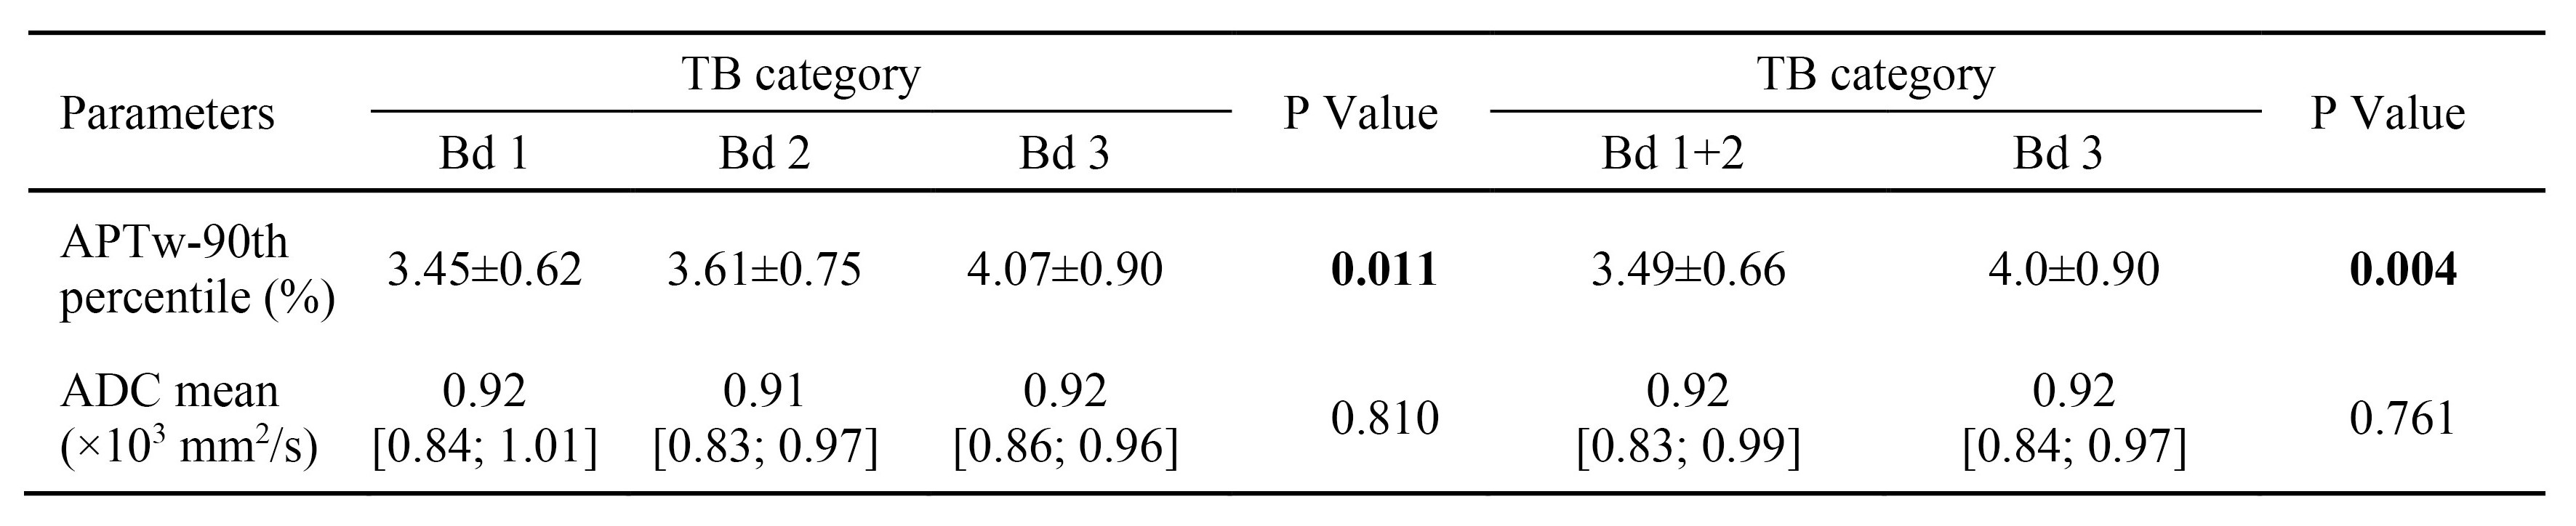
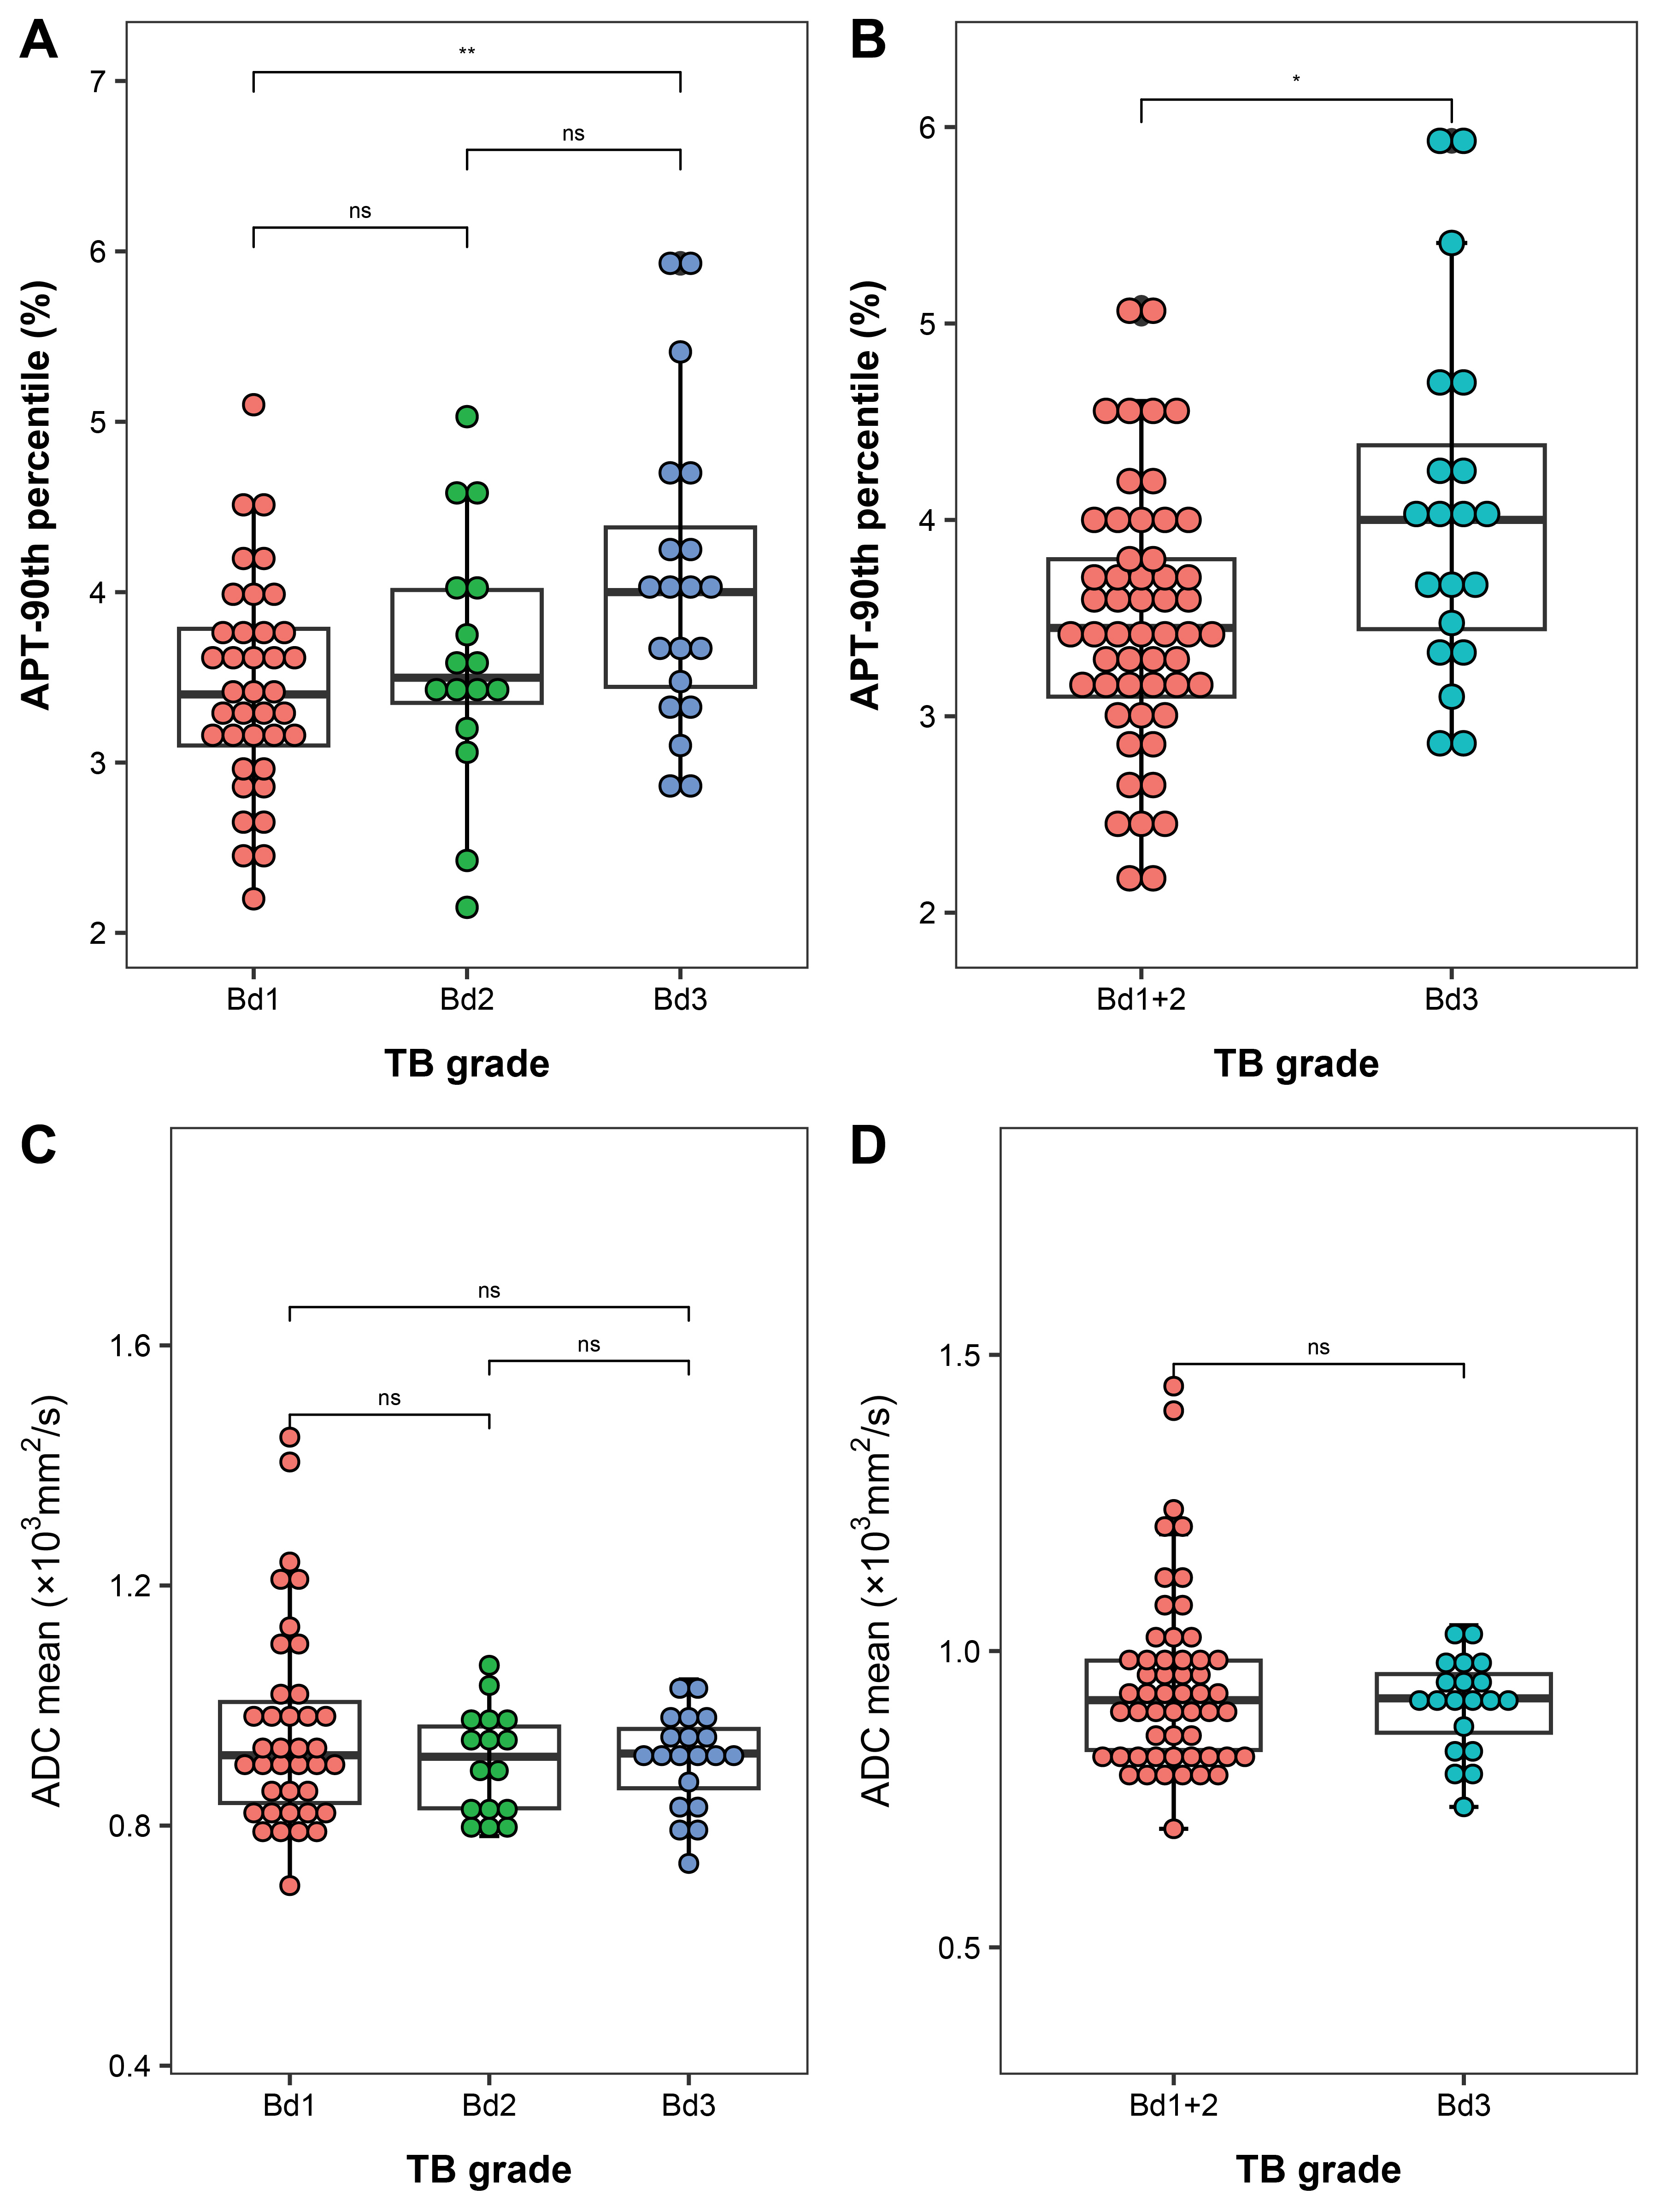
Results
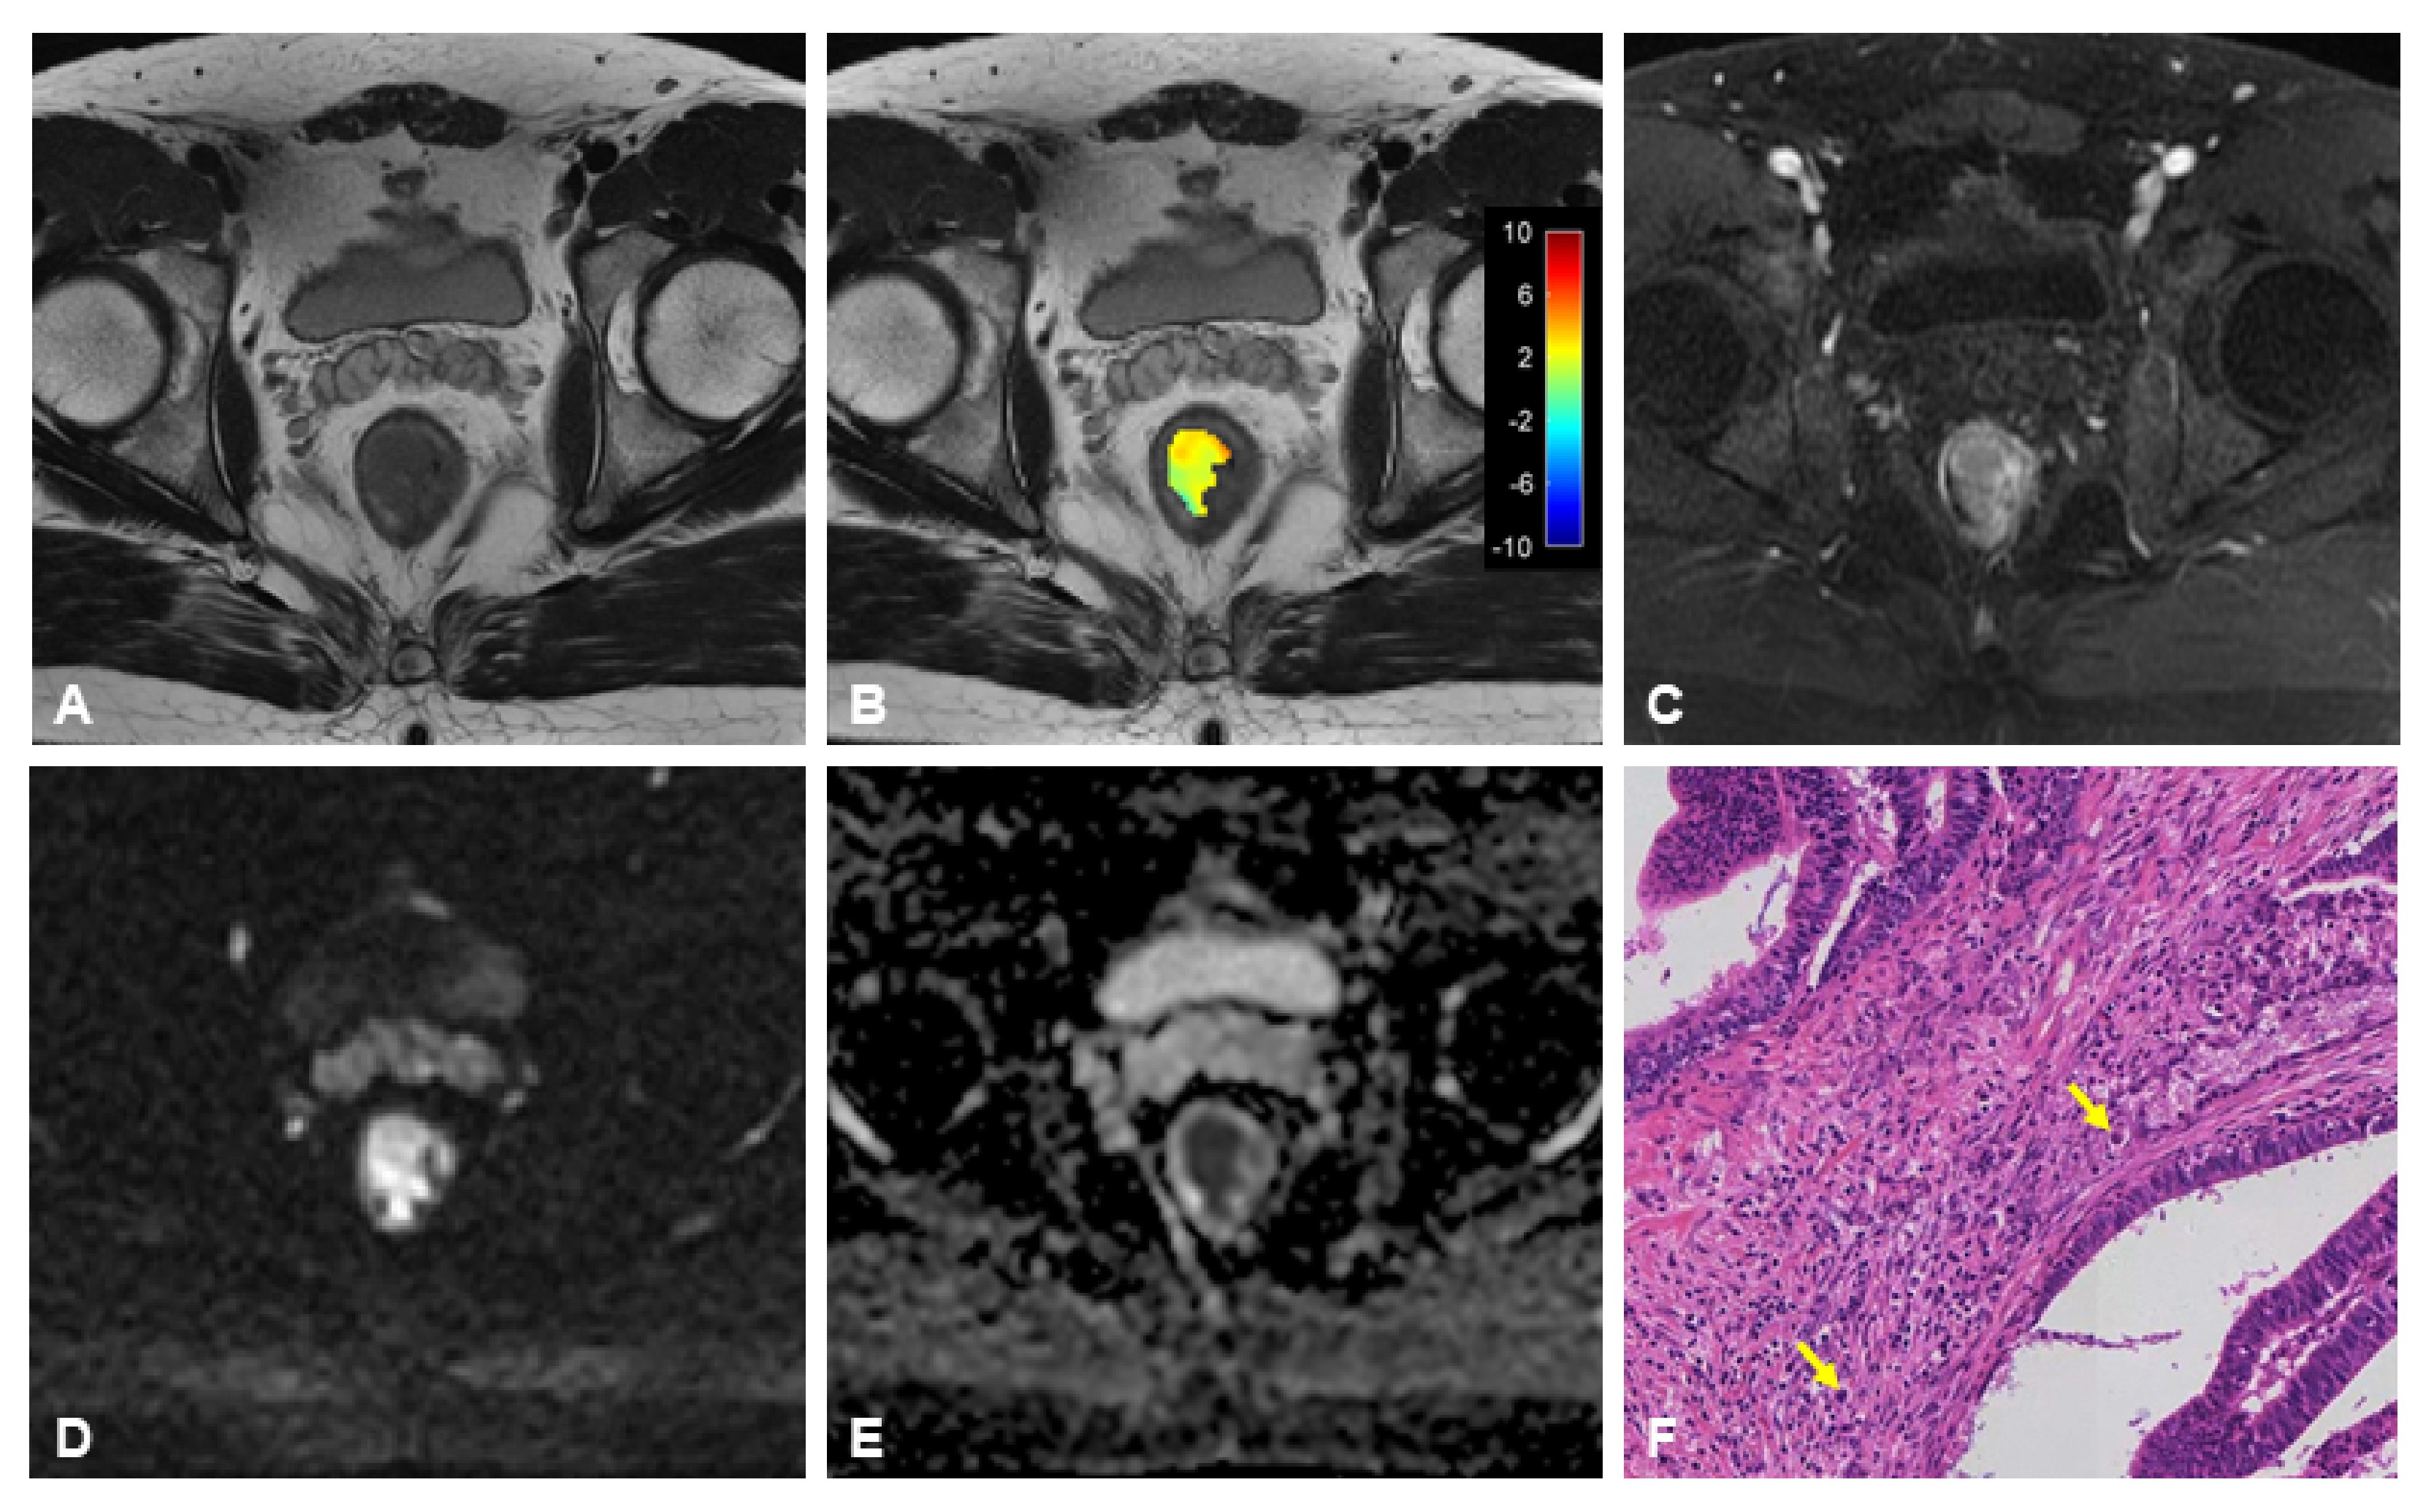
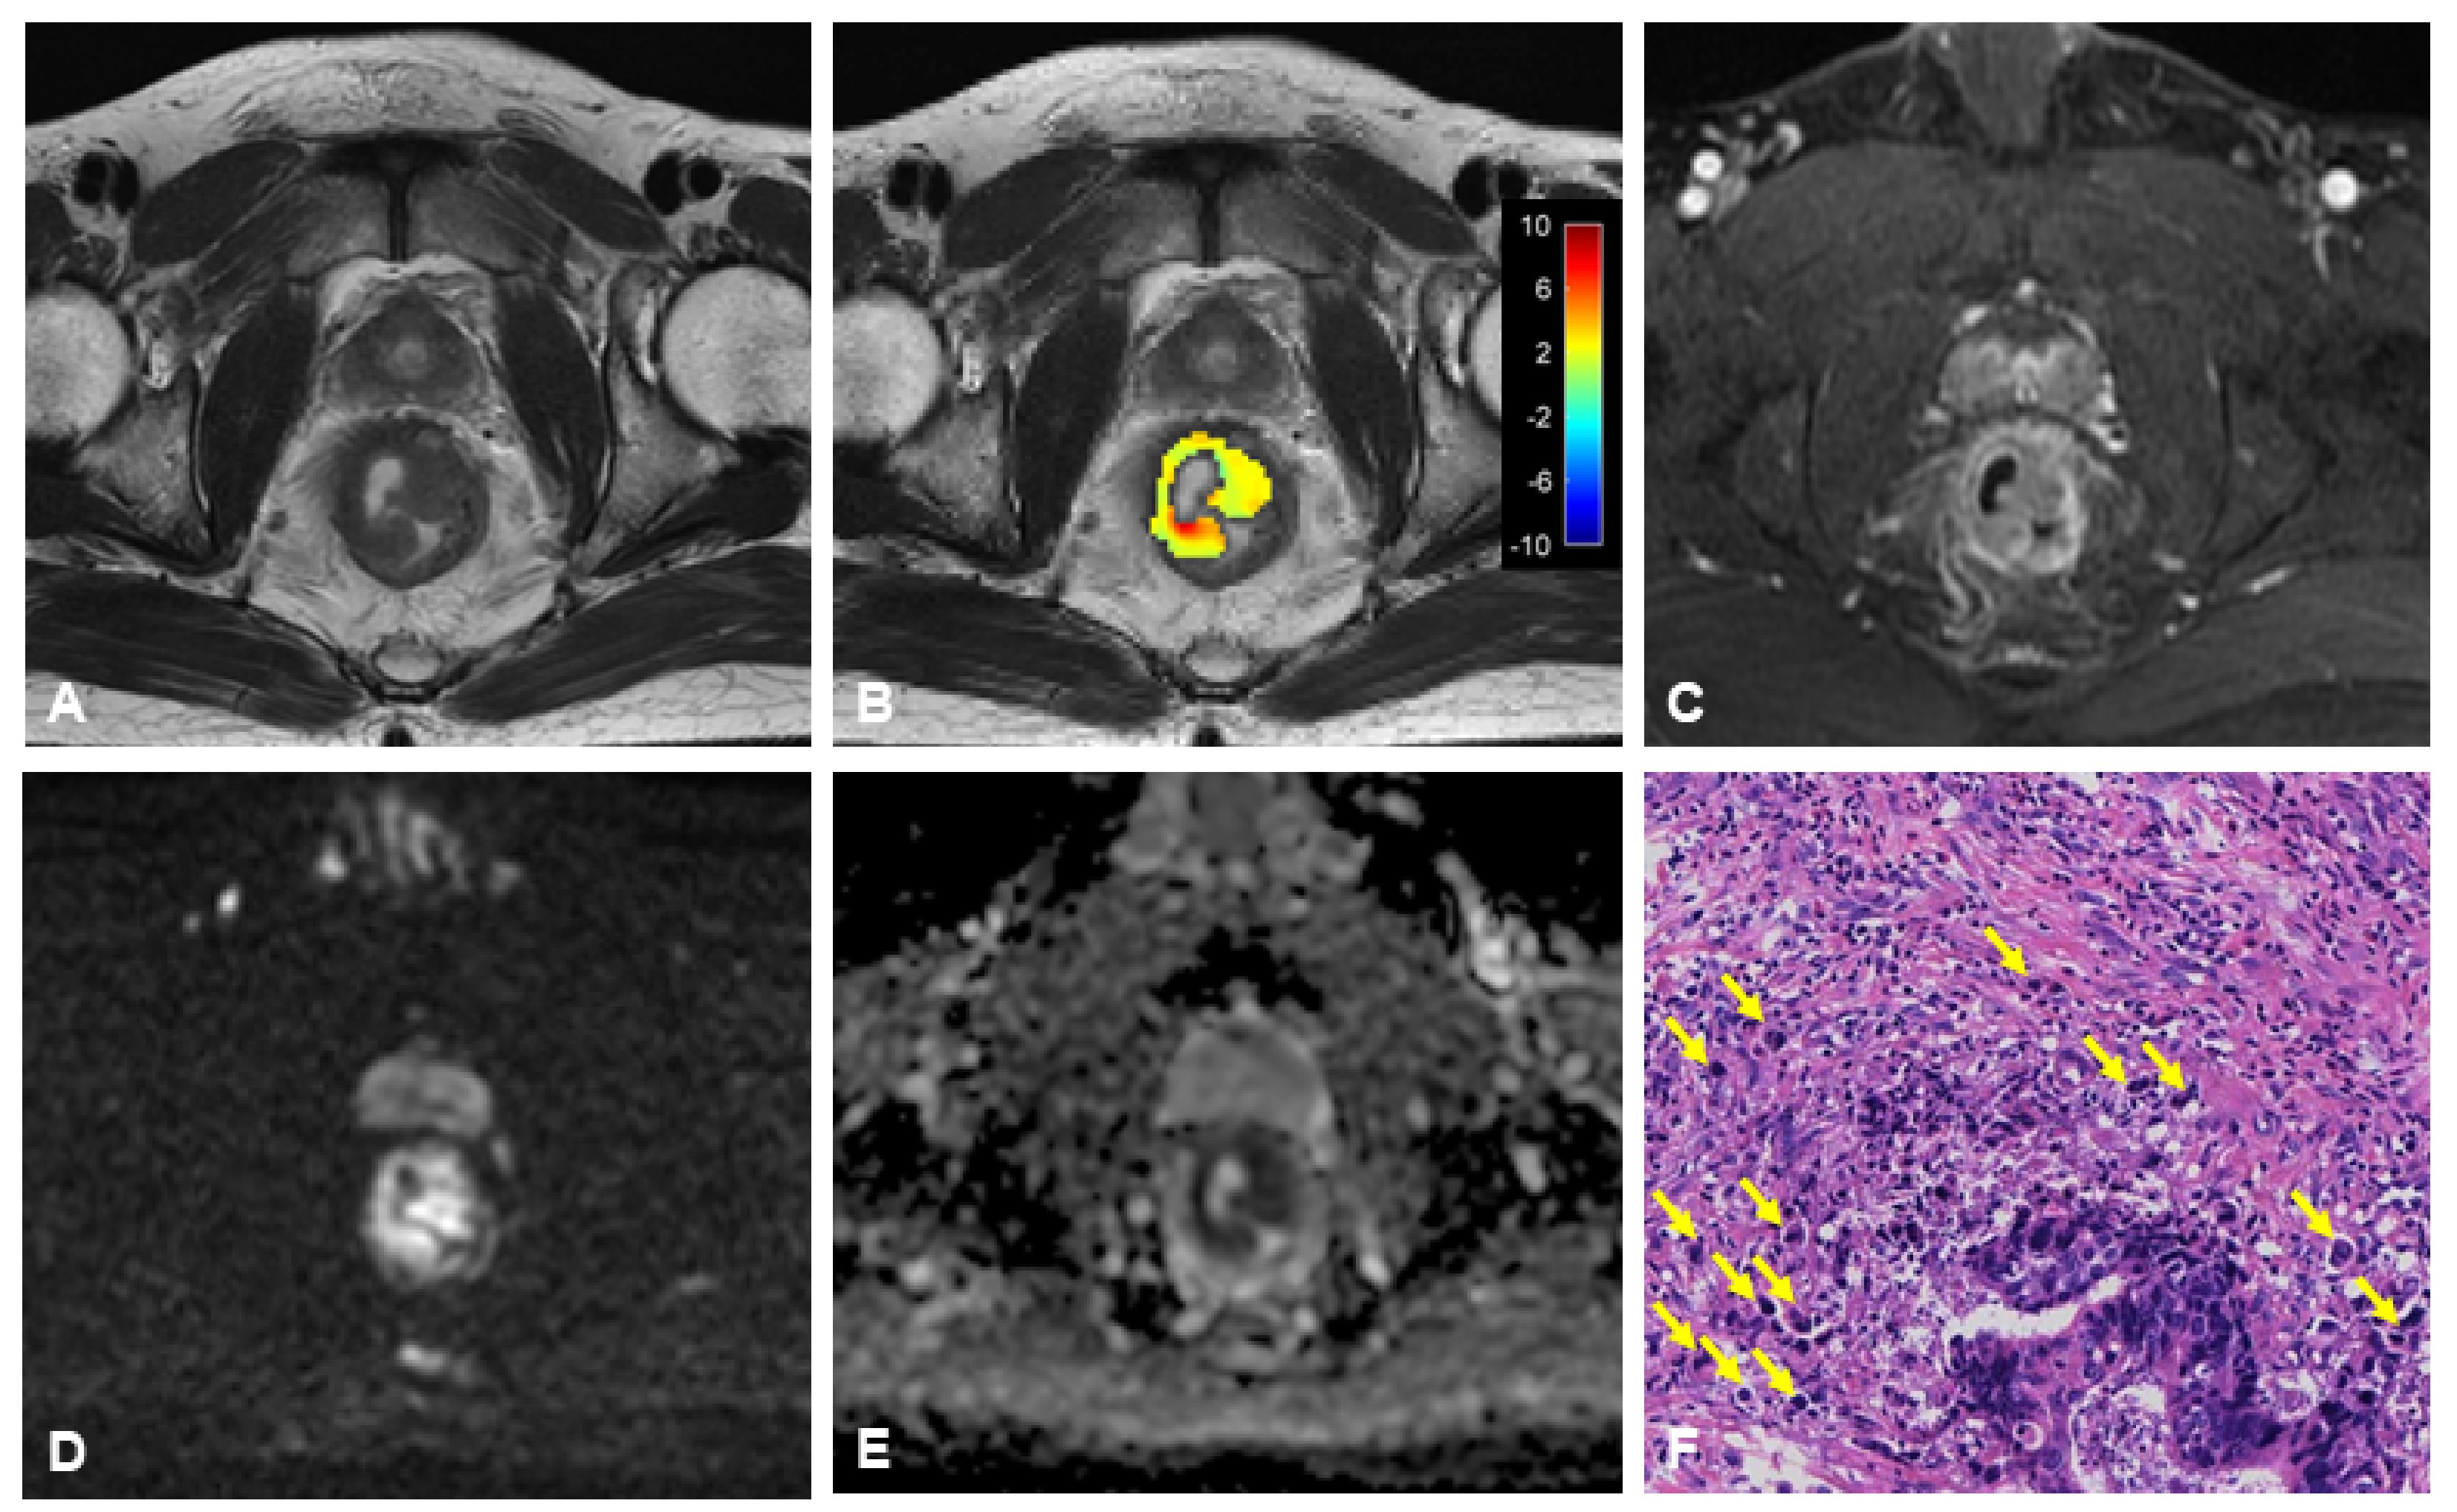
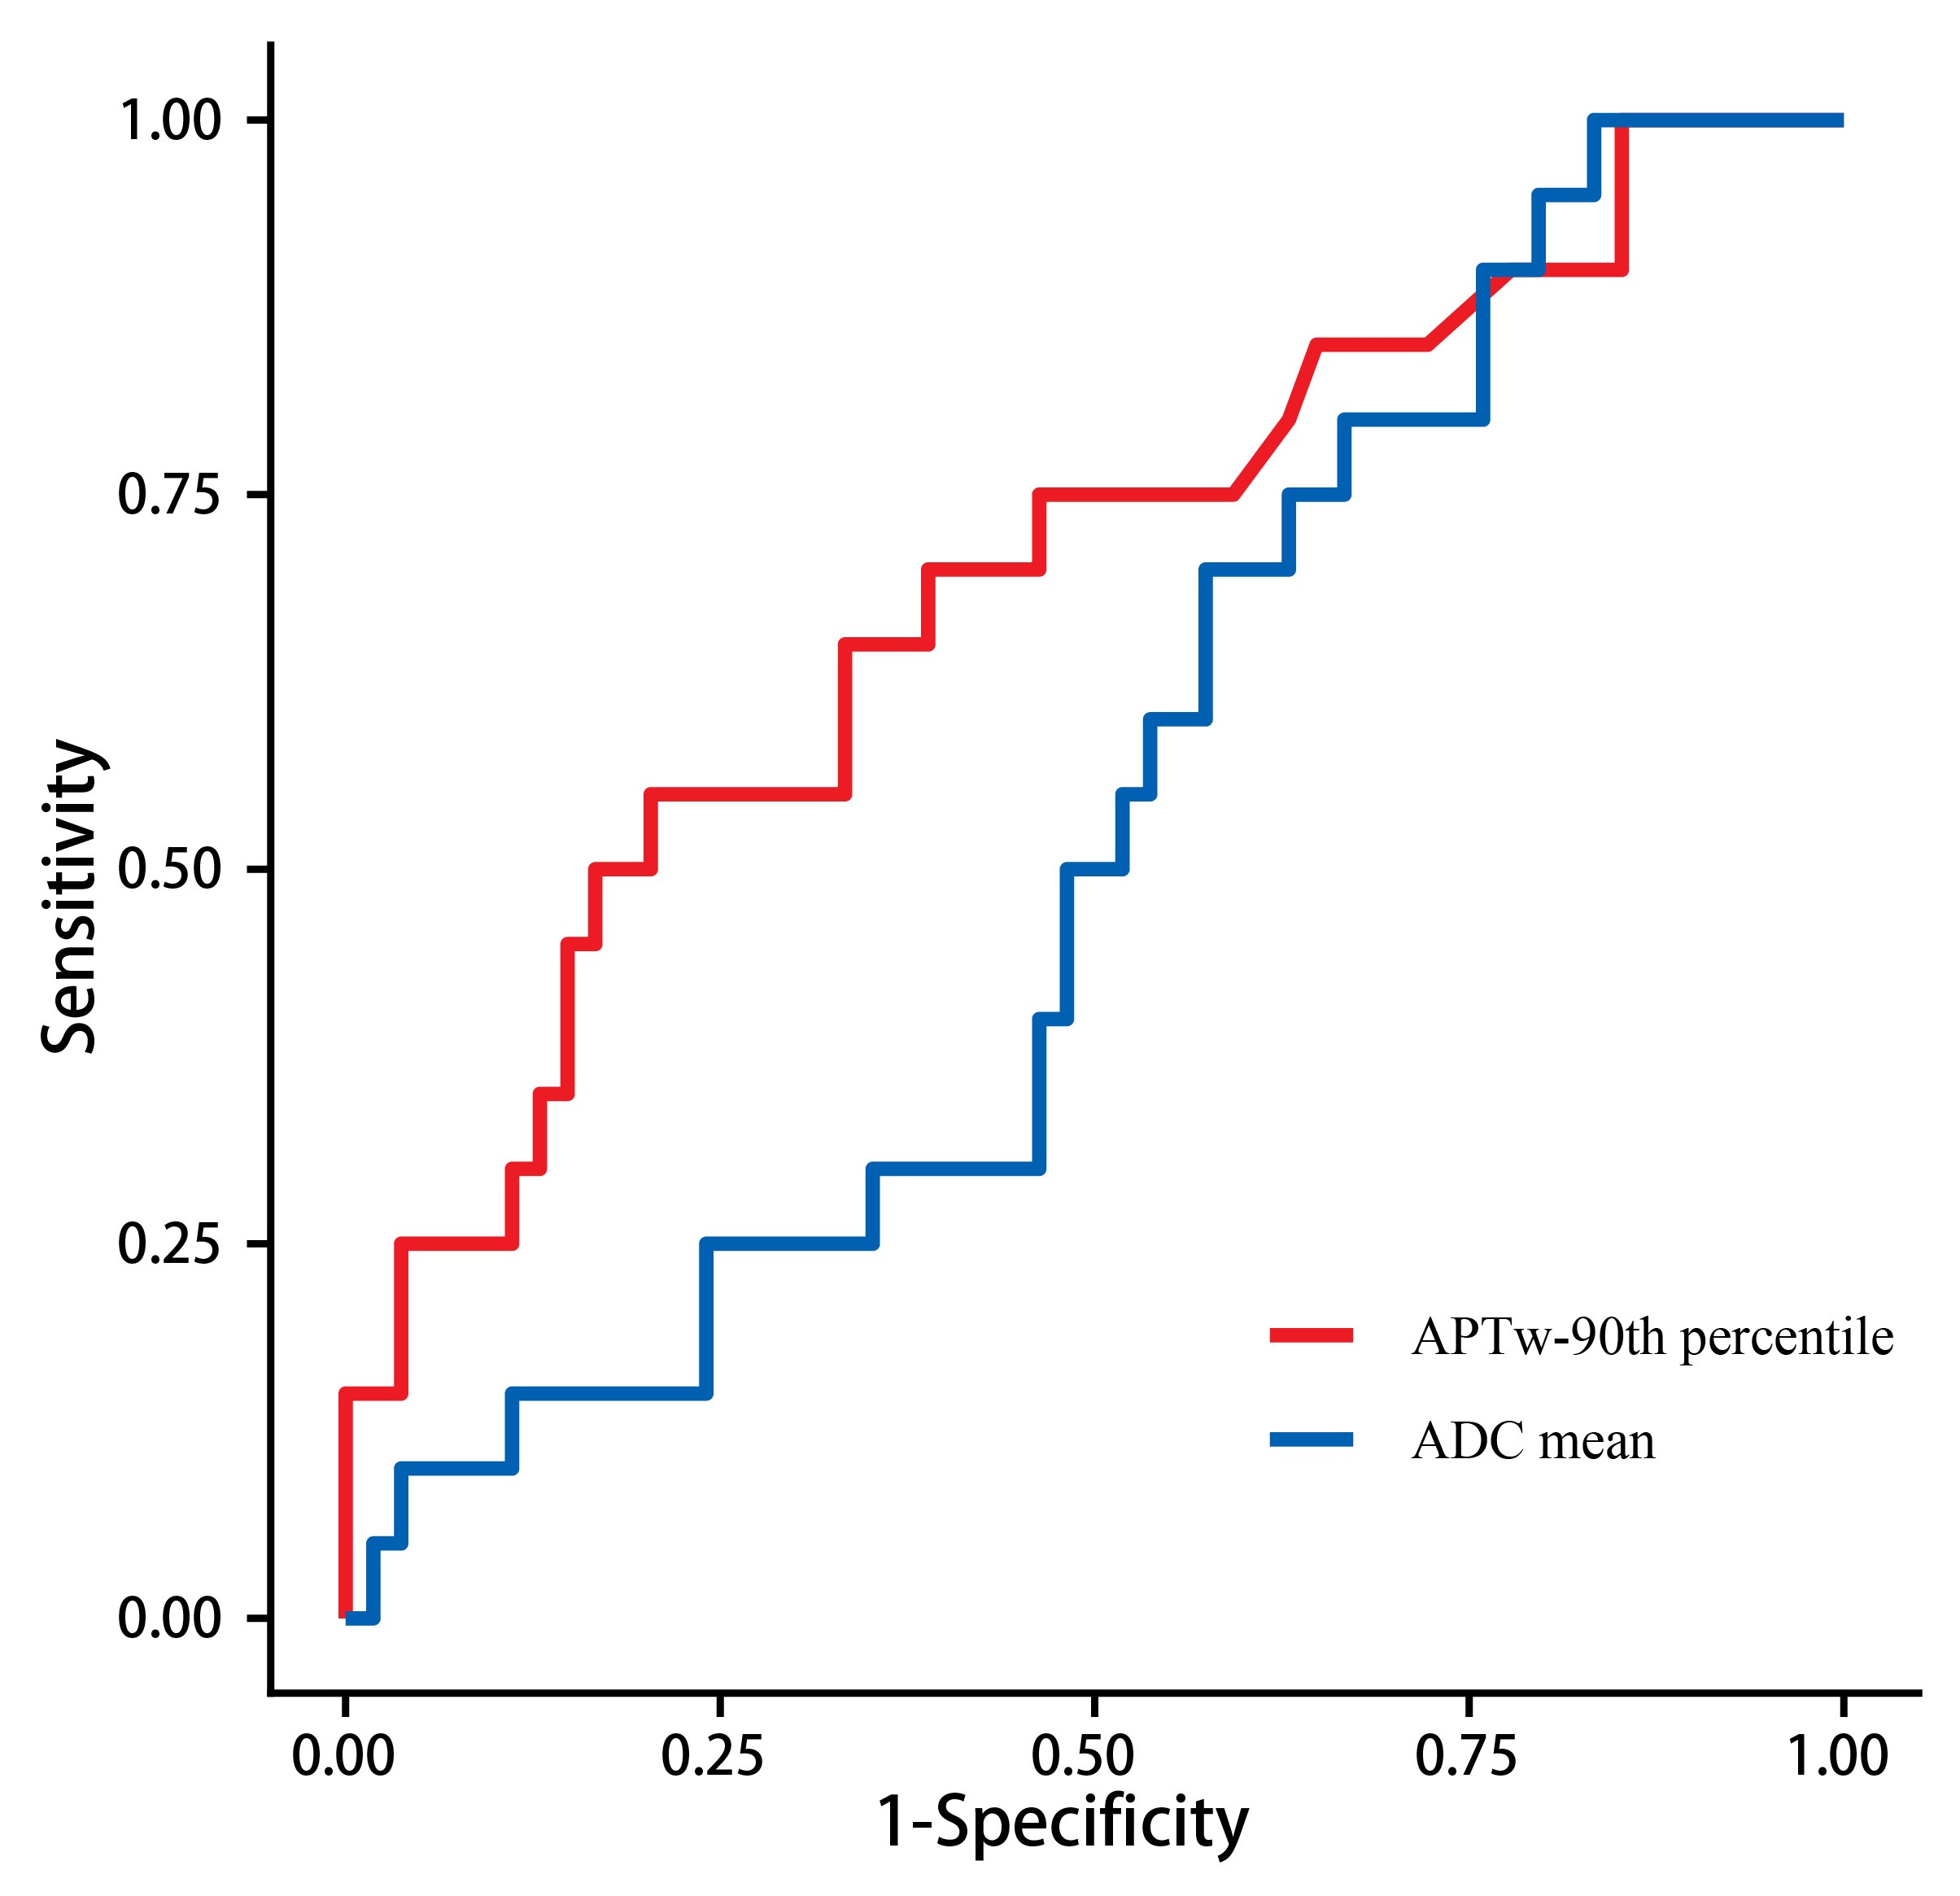
Seventy-four patients with RC, 49 men (66%) and 25 women (34%), with a mean age of 58 years ± 8 years [SD], were analyzed. All participants underwent surgery within 2 weeks (days 1-14) after their MRI examination. The intraclass correlation coefficients of the APTw-90th percentile and ADC values measured by the two radiologists were 0.87 (95% CI: 0.80, 0.92) and 0.90 (95% CI: 0.85, 0.94), respectively. There was a statistical difference in APTw-90th percentile between Bd group 1, 2, and 3 (p=0.011); also, no statistical difference was observed in ADC mean values between Bd groups (p=0.810). Yet, the APTw-90th percentile of the Bd3 group was significantly higher than that of the Bd1+2 group (3.49%±0.66 vs. 4.0%±0.90; P=0.004), while there was no statistical difference in the average ADC between the Bd3 group and the Bd1+2 group (p=0.761)(Table 1 and Figure 1). The AUCs of APTw-90th percentile and ADC mean in diagnosing Bd3 were 0.69 (95% CI: 0.55, 0.83) and 0.52 (95% CI: 0.38, 0.66), respectively (p=0.081) (Figure 4). Figures 2 and 3 show MRI scans of two RC patients in the TB low-grade and high-grade groups, respectively.Discussion
Our results showed that the APTw-90th percentile of the Bd3 group was significantly higher than that of the Bd1+2 group. This is indicative of high-grade tumors, which are more aggressive and more likely to metastasize to lymph nodes and distant sites. The cell metabolism of high-grade tumors is more active with more new blood vessels, which leads to increased APT signal. Yet, this study did not find a correlation between TB grade and ADC value. High-grade TB has higher cell density and less stroma at the invasive front. However, the impact of tumor stromal content on tumor ADC values is still inconclusive. Multiple complex mechanisms may jointly affect the effect of TB on ADC, which needs to be further explored.Conclusion
APTw MRI is beneficial to evaluate the TB grade of RC, and its diagnostic performance is better than that of ADC value.Acknowledgements
No acknowledgement found.References
1. Lugli A, Kirsch R, Ajioka Y, Bosman F, Cathomas G, Dawson H, El Zimaity H, Fléjou J-F, Hansen TP, Hartmann A et al. Recommendations for reporting tumor budding in colorectal cancer based on the International Tumor Budding Consensus Conference (ITBCC) 2016. Mod Pathol 2017, 30(9):1299-1311.
2. De Smedt L, Palmans S, Andel D, Govaere O, Boeckx B, Smeets D, Galle E, Wouters J, Barras D, Suffiotti M et al. Expression profiling of budding cells in colorectal cancer reveals an EMT-like phenotype and molecular subtype switching. Br J Cancer 2017, 116(1):58-65.
3. Sert Bektaş S, Inan Mamak G, Cırış IM, Bozkurt KK, Kapucuoğlu N. Tumor budding in colorectal carcinomas. Turk Patoloji Derg 2012, 28(1):61-66.
4. Gao T, Zou C, Li Y, Jiang Z, Tang X, Song X. A Brief History and Future Prospects of CEST MRI in Clinical Non-Brain Tumor Imaging. Int J Mol Sci 2021, 22(21).
Figures