3976
Metabolic Imaging Biomarkers of Response to Signaling Inhibition Therapy in Melanoma1University of Pennsylvania, Philadelphia, PA, United States, 2Advanced Imaging Research, Inc., Cleveland, OH, United States
Synopsis
Keywords: Biomarkers, Molecular Imaging, Melanoma, BRAF
Motivation: We use 1H/31P MRS to monitor the metabolic effects of dabrafenib therapy in four human melanoma models, an FDA-approved treatment for late-stage melanoma.
Goal(s): Differences in relative levels of metabolites and bioenergetics between four melanoma models may produce differential therapeutic responses to BRAF inhibitors.
Approach: Intratumor variations of lactate, alanine, and bioenergetics (β-NTP/Pi) measured by in-vivo and in-vitro 1H/31P MRS have the potential to become early and sensitive biomarkers of dabrafenib inhibition therapy in melanoma.
Results: Changes in lactate, alanine, and bioenergetics response to targeted dabrafenib inhibitor therapy occur rapidly and are connected to the following tumor response.
Impact: Dabrafenib blocks cell division by inhibiting the hyperactive BRAF protein. Differences in the predominance of metabolites (Lactate and Alanine) and bioenergetics may explain dabrafenib therapeutic responses in DB-1/WM983B (Sensitive mutant type), WM983BR (Resistant mutant type), and WM3918 (Wild type).
INTRODUCTION:
Melanoma is a skin malignancy of the melanocytes, highly treatable when limited to the primary site.1 However, metastatic melanoma is the most lethal form of human skin cancer with a median survival of six months.1 Dabrafenib therapy for metastatic melanoma focuses on blocking growth-promoting signals activated by a hyperactive BRAF protein. Therefore, due to the hyperactive BRAF protein, the MAPK/ERKs signaling pathway is altered in melanoma producing increased cell proliferation and cell survival and decreasing apoptosis. This report focuses on the study of four human melanoma models with different responses to the BRAF signal inhibition of dabrafenib therapy.2 Our goal is to determine if the altered signaling pathway due to BRAF mutations in melanoma produces metabolic differences in these models during dabrafenib therapy and whether these differences correlate with response to treatment.METHODS:
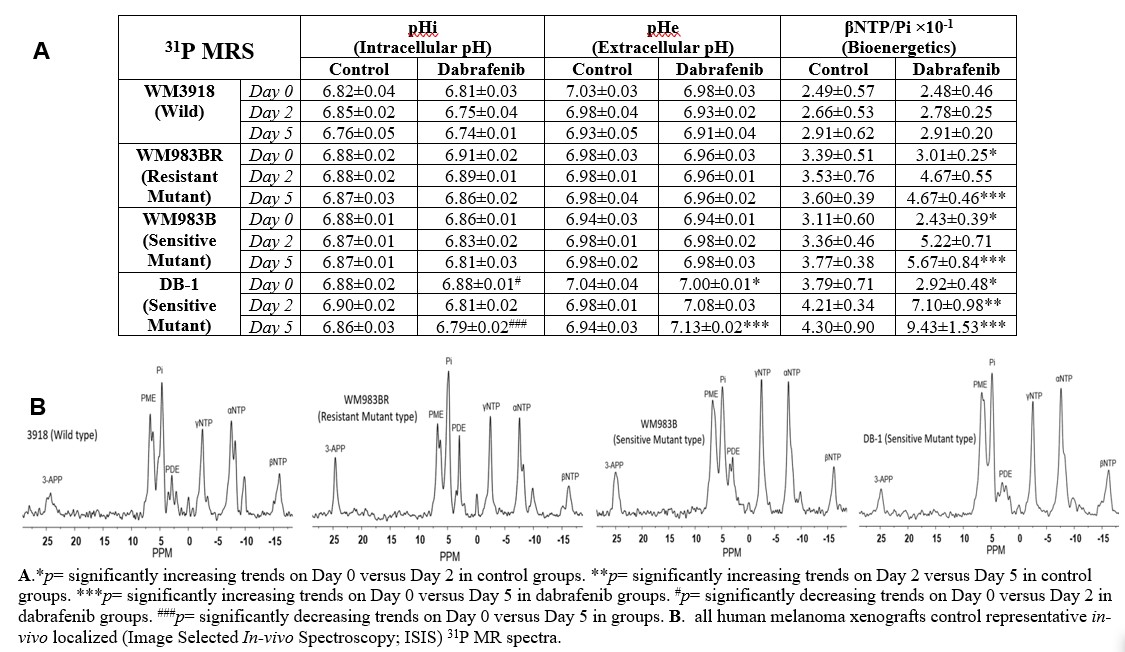
We assessed metabolic changes due to dabrafenib therapy in four human melanoma models in-vitro using isolated cells and in-vivo using the cells xenografted in mice. For the in-vitro studies, we measured intracellular lactate and alanine by 1H magnetic resonance spectroscopy (1H MRS) and glucose and lactate using the YSI analyzer. We studied two sensitive mutant melanoma phenotypes, the DB-1, and WM983B cell lines, one resistant mutant phenotype, the WM983BR cell line, and the BRAF wild phenotype WM3918. We studied 48 tumor-bearing mice, 14 each with the DB-1 and WM983B phenotypes [control (N=6) and dabrafenib (N=8)], and 10 each with the WM983BR, and WM3918 phenotypes [(control (N=5) and dabrafenib (N=5)]. DB-1 and WM983B cells were grown as described earlier.3 WM983BR and WM3918 cells were grown in a mixture of MCDB153 and L-15 media (4:1 ratio) supplemented with 100 Units/mL penicillin, 100 µg/mL streptomycin, 2mM calcium chloride, and 2% FBS. Each mouse was inoculated subcutaneously with 10x106 cells/ml in a 0.1mL suspension. In-vivo, 1H/31P MRS experiments were performed on a 9.4T Bruker magnet using a homemade 1H/31P dual-tuned coil. The MRS experiment procedure was described earlier.3 For 1H MRS, a slice-selective, double-frequency, Hadamard-selective, multiple quantum coherence (Had-Sel-MQC) transfer pulse sequence was used to detect lactate and alanine, filtering out overlapping lipid signals.4 Intracellular pH (pHi), pHe, and the bioenergetics index βNTP/Pi were measured using 31P MRS. 1H/31P MRS exams were acquired on Day 0, Day 2, and Day 5 of treatment. Dabrafenib (30 mg/kg; oral) was given using methods described elsewhere.5 Tumor volumes were measured using calipers. Independent paired/sample t-tests were performed for statistical analysis using SPSS 20. A p‑value ≤ 0.05 was considered significant.RESULTS:
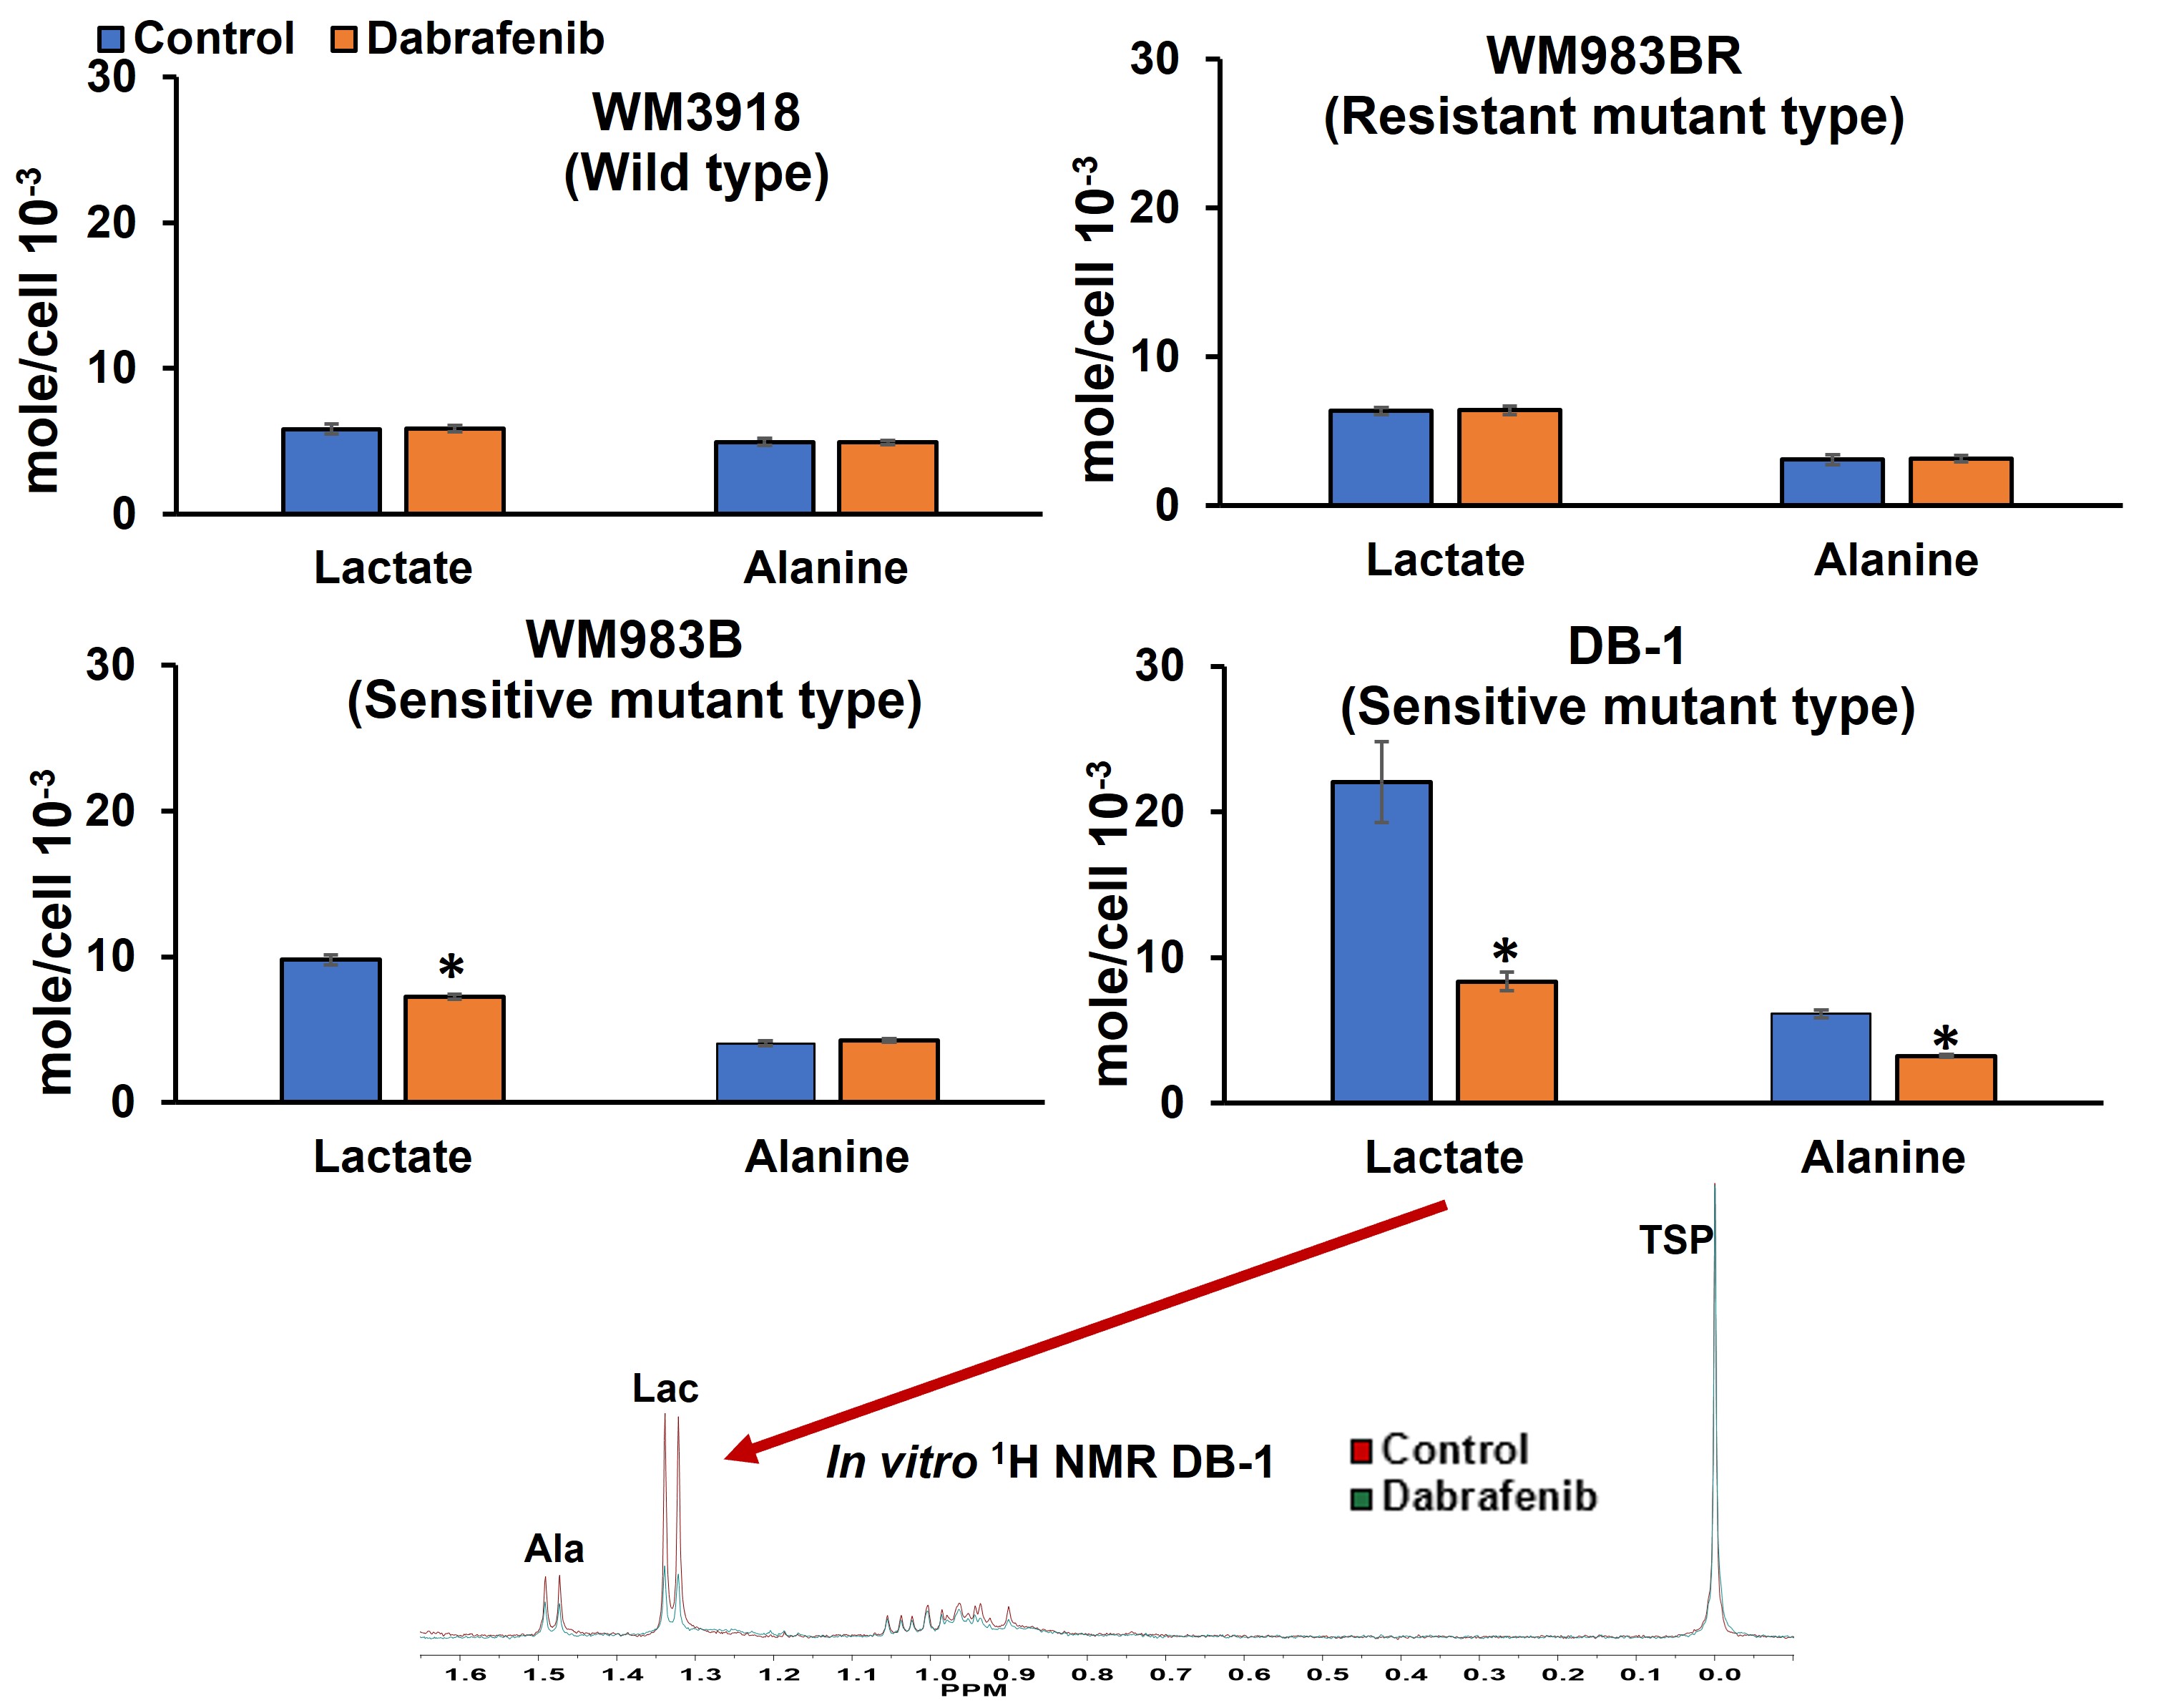
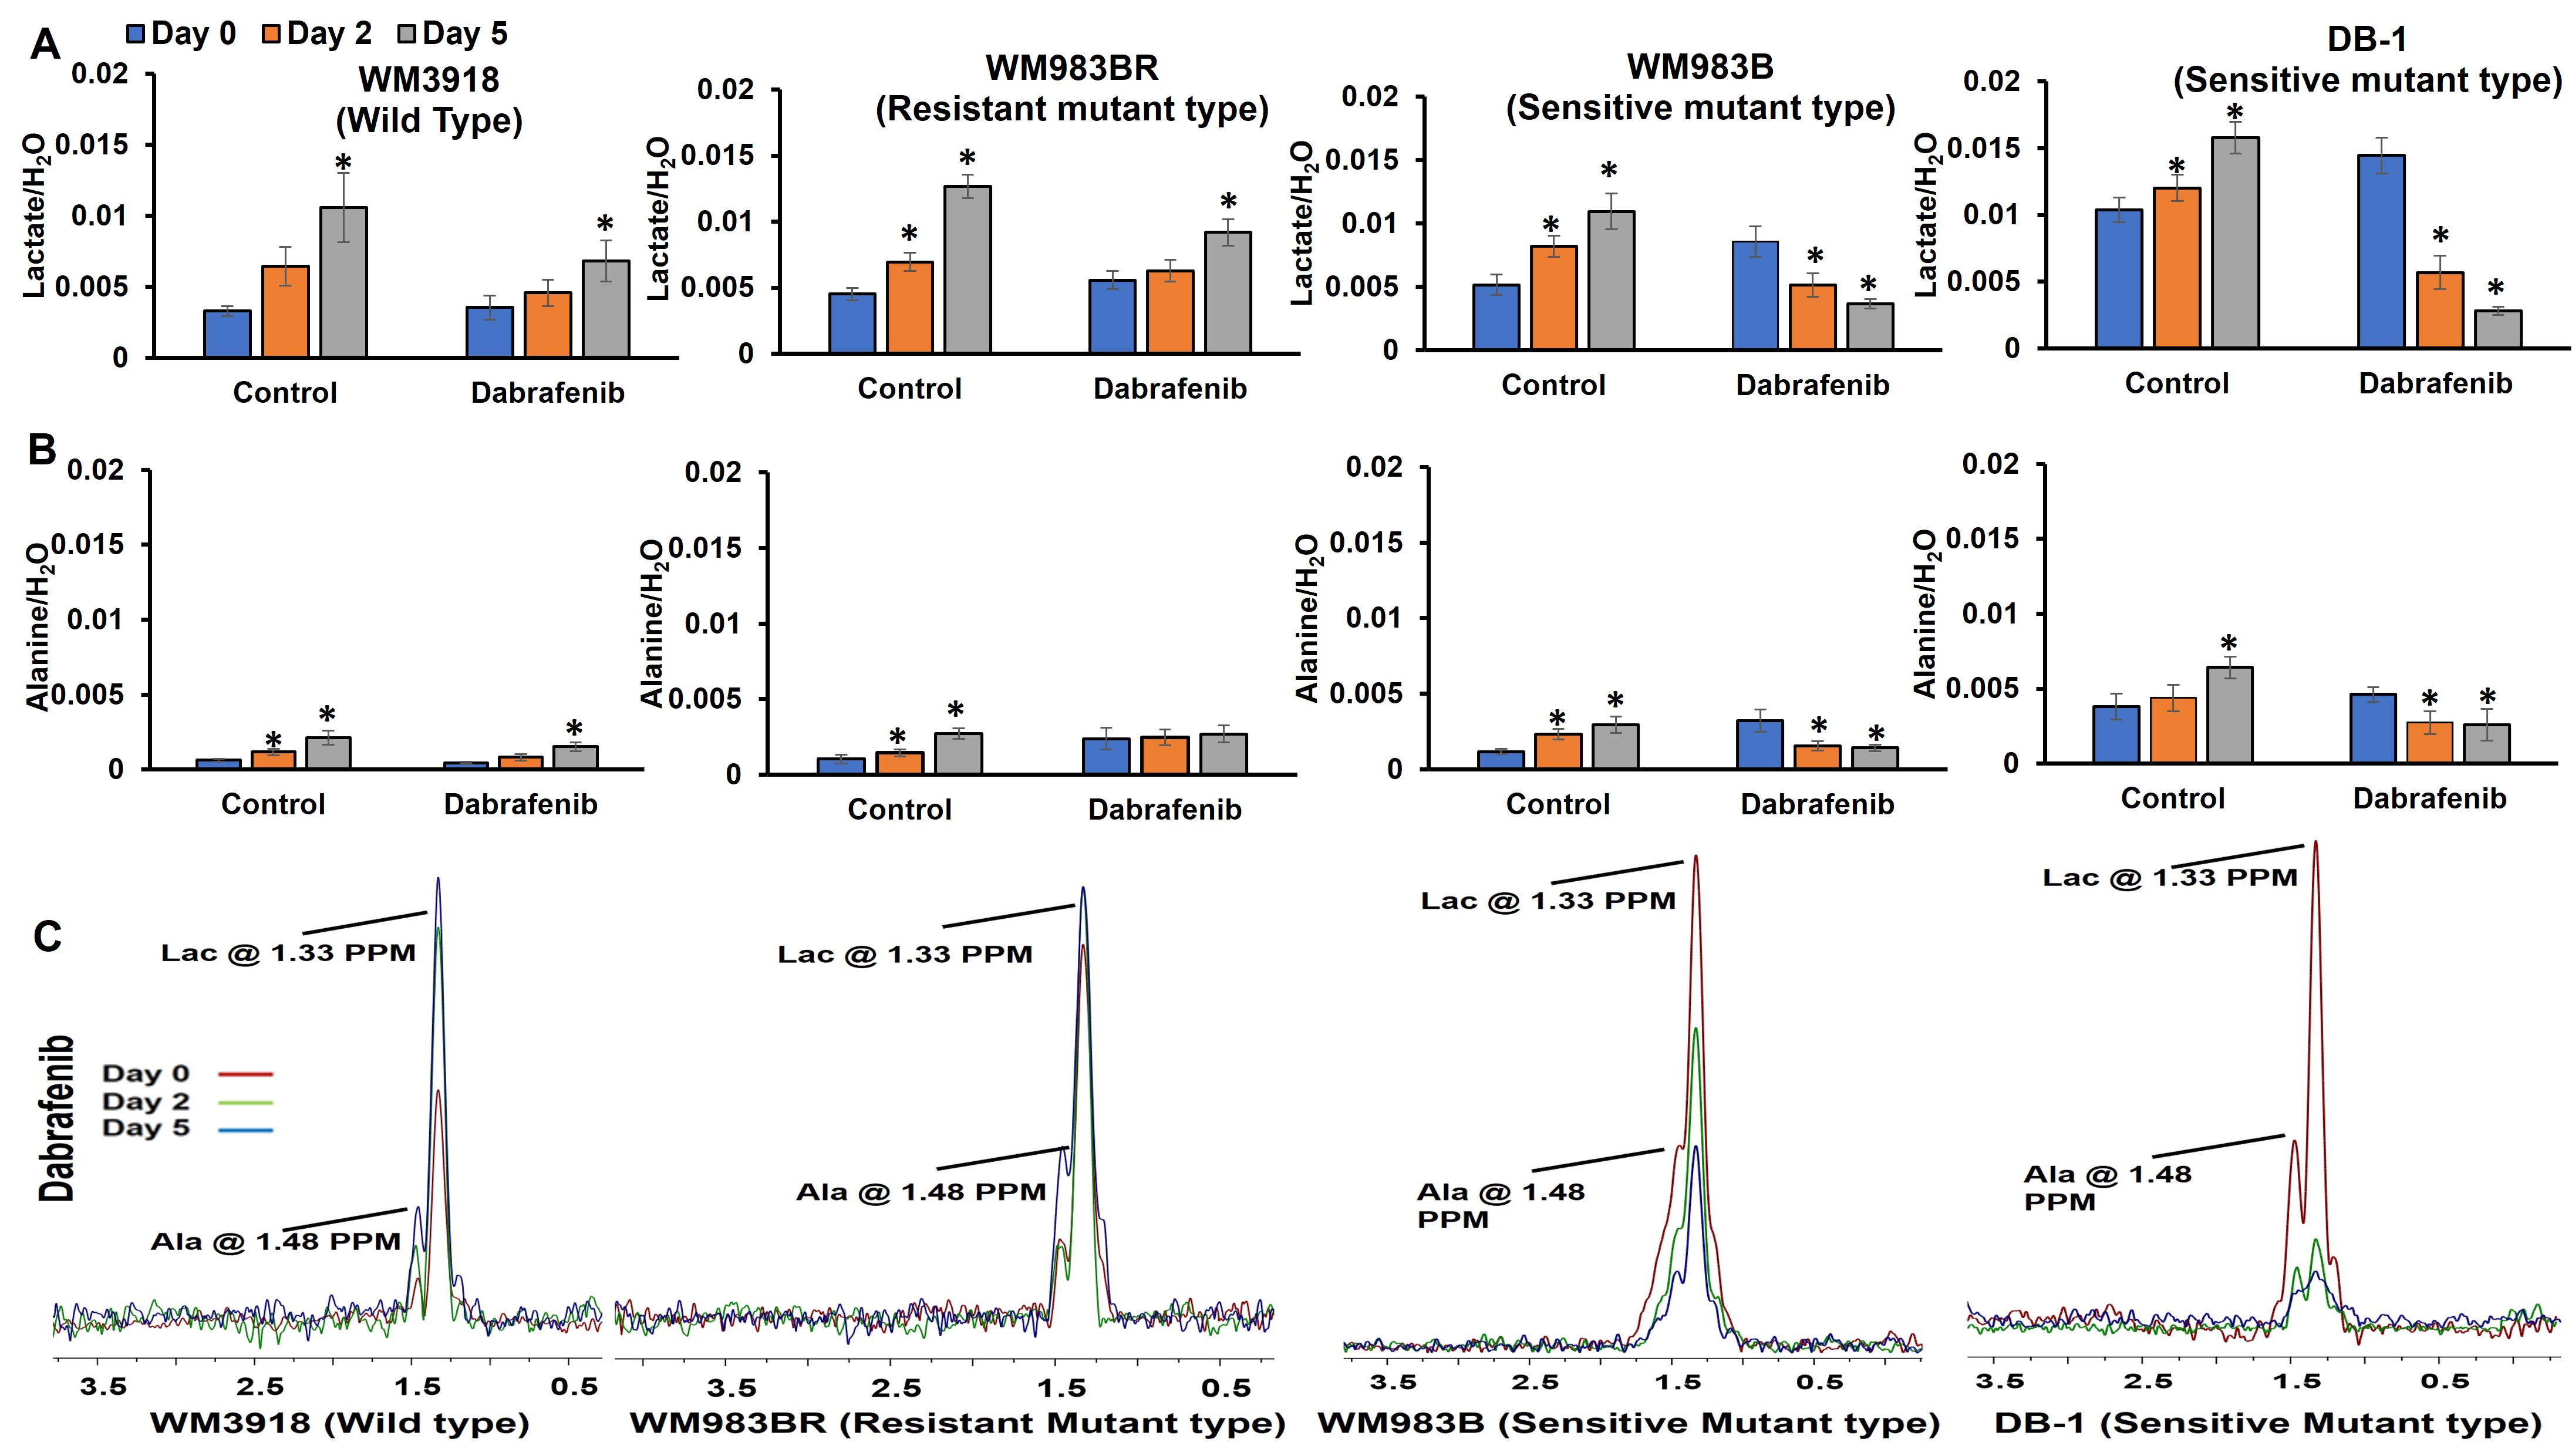
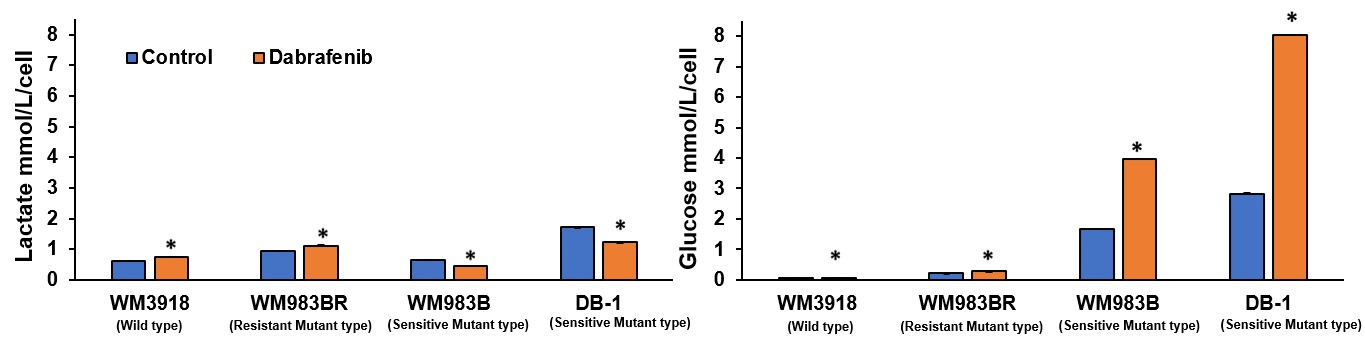
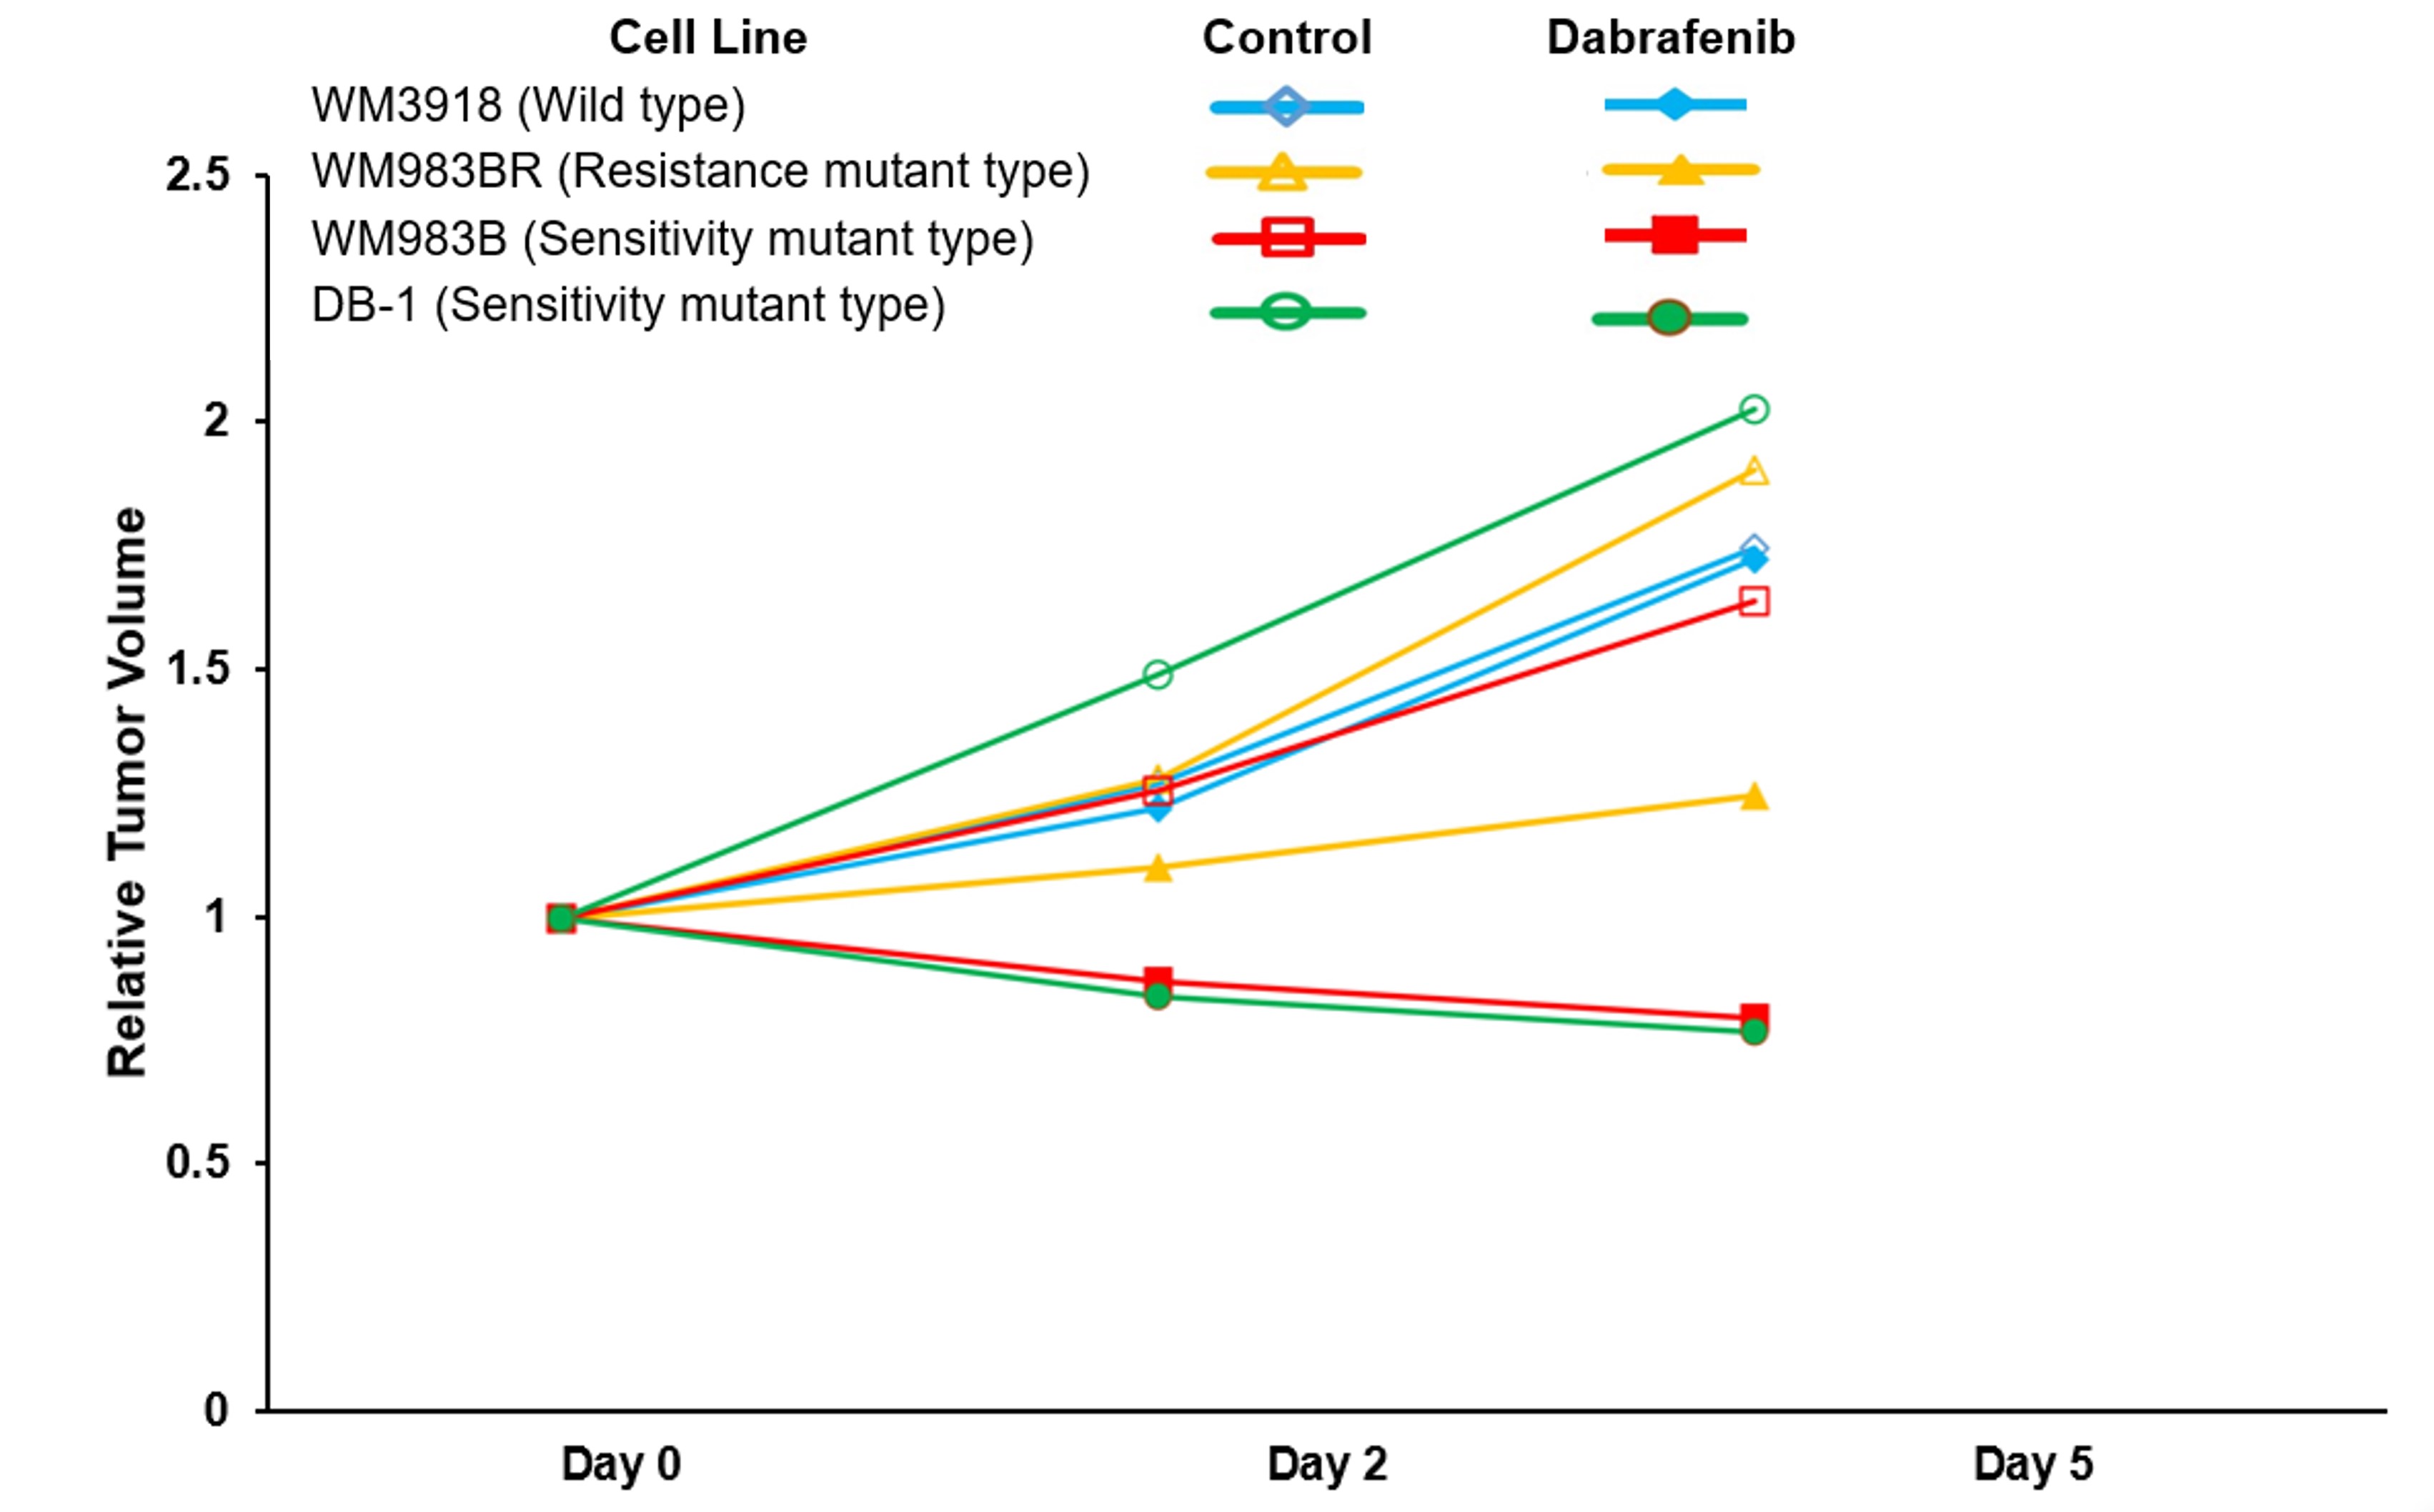
Intracellular lactate and alanine determined by high-resolution 1H MRS at 48 hours in cells treated with and without dabrafenib (Fig.1). The Had-Sel-MQC sequence was used to determine in vivo lactate and alanine levels in xenograft tumors with and without treatment on Day 0, 2, and 5: DB-1 and WM983B (Sensitive mutant type), WM983BR (Resistant mutant type), and WM3918 (Wild type) (Fig.2). Extracellular flux lactate and glucose measurement by YSI 2300 additionally showed differences in dabrafenib response between control cells and cells treated with 25nM dabrafenib for 48 hours in all four melanomas cells (Fig.3). The 31P MRS of the tumor models consists of well-resolved low-field resonances of β-NTP and Pi. Thus, all four melanoma models' bioenergetics (β-NTP/Pi) could be quantitated (Fig.4). Measuring pHe, and pHi are summarised in figure 4. Regarding therapy response, we observed a decrease in tumor volume after treatment with dabrafenib, WM983B, and DB-1 melanoma models, however, as expected, resistant, wild type, and untreated control melanoma mice exhibited a monotonic increase in tumor volume and showed little to no treatment effect (Fig.5).DISCUSSION:
We found that inhibiting BRAF, a constitutive part of the MAPK pathway, profoundly changes tumor metabolomics in melanoma phenotypes with high BRAF dependence.6 Moreover, we verify that the relation between tumor metabolism and BRAF inhibition has the potential for significant clinical translational implications. Using in-vitro/in-vivo 1H NMR/MRS derives objective imaging metabolic biomarkers that indicate early and thus predict melanoma response or resistance to BRAF inhibition (Fig.1,2). Using in-vivo 31P MRS, we also noted that higher bioenergetics levels (i.e.,βNTP/Pi) correlated with increased response to dabrafenib (Fig.4). Our findings strongly suggest that modifications of tumor metabolomics are essential mechanisms responsible for the efficacy of dabrafenib inhibitors as therapeutic agents in melanoma. It is realistic to think that evidence about metabolism could also be highly valuable in monitoring and predicting responses to other cancers and treatment modalities, such as BRAF and MEK inhibitors and immunotherapy.CONCLUSION:
Studying human melanoma models like DB-1, WM983B, WM983BR, and WM3918 using in-vivo and in-vitro 1H/31P MRS demonstrates differential therapeutic responses based on glycolytic and bioenergetics therapy-related changes.Acknowledgements
This work was supported in part by NIH grants from National Cancer Institute 1R01CA268601, 1R01CA250102, 1R01CA228457.References
1. Davis LE, Shalin SC, Tackett AJ. Current state of melanoma diagnosis and treatment. Cancer Biol Ther. 2019;20(11):1366-79.
2. Vashisht Gopal YN, Gammon S, Prasad R, et al. A Novel Mitochondrial Inhibitor Blocks MAPK Pathway and Overcomes MAPK Inhibitor Resistance in Melanoma. Clin Cancer Res. 2019;25(21):6429-42.
3. Gupta PK, Orlovskiy S, Nelson DS, et al. Detection of Metabolic Biomarkers of Response to BRAF and MEK Inhibitor Therapy of Melanoma. ISMRM; 2022; LONDON.
4. Pickup S, Lee SC, Mancuso A, et al. Lactate imaging with Hadamard-encoded slice-selective multiple quantum coherence chemical-shift imaging. Magnetic Resonance in Medicine. 2008;60(2):299-305.
5. Nath K, Nelson DS, Ho AM, et al. 31P and 1H MRS of DB-1 melanoma xenografts: lonidamine selectively decreases tumor intracellular pH and energy status and sensitizes tumors to melphalan. NMR Biomed. 2013;26(1):98-105.
6. Zhang P, Guan H, Yuan S, et al. Targeting myeloid derived suppressor cells reverts immune suppression and sensitizes BRAF-mutant papillary thyroid cancer to MAPK inhibitors. Nature Communications. 2022;13(1):1588.
Figures