3970
MALDI-MRS-SHY: Statistical Heterospectroscopy of MALDI Imaging and Magnetic Resonance Spectroscopy1Radiology, Johns Hopkins School of Medicine, Baltimore, MD, United States
Synopsis
Keywords: Biology, Models, Methods, Spectroscopy, MALDI imaging, heterospectroscopy
Motivation: Combining high-resolution (HR) magnetic resonance spectroscopy (MRS) and matrix-assisted laser desorption/ionization (MALDI) imaging of tissues and cells using new workflows and data analysis approaches will further advance metabolomic and lipidomic studies.
Goal(s): The goal is to develop Statistical Heterospectroscopy (SHY) of 1H-HR-MRS and MALDI imaging data of tissues and cells.
Approach: Phantoms, cell lines, and tumors were measured by 1H-HR-MRS and MALDI imaging, followed by analysis with newly developed MATLAB-based software for statistical correlation of both datasets.
Results: The new MALDI-MRS-SHY software correctly generated two-dimensional spectra with cross-peaks from phantoms of pure compounds and mixtures, as well as cell lines and tumor tissues.
Impact: The newly developed MALDI-MRS-SHY software will allow for a deeper analysis of complex metabolomic and lipidomic data obtained by combined HR-MRS and MALDI imaging of cells and tissues.
Introduction
We recently developed new workflows for combining high-resolution 1H magnetic resonance spectroscopy (HR-MRS) and matrix-assisted laser desorption/ionization (MALDI) imaging from the same sample [1]. Both technologies are frequently used to detect large numbers of metabolites and lipids in metabolomic and lipidomic studies [1]. We have employed this new combined pipeline of HR-MRS-MALDI imaging to obtain metabolomic and lipidomic measurements from triple-negative human breast cancer cells and tumor xenograft models [1]. While HR-MRS quantitatively detects metabolites and lipids, MALDI imaging provides sensitive measures of spatially resolved relative metabolite and lipid concentrations. Combining these two complementary modalities enhances analyte identification, quantitation, and localization, and can reveal pathways which are not easily detected in either modality alone. To further develop HR-MRS-MALDI imaging, here we have developed for the first time MATLAB-based software for statistical heterospectroscopy (SHY) of HR-MRS and MALDI imaging data from the same sample.Methods
Phantoms as detailed in the results were prepared in 50% acetonitrile (ACN) with 0.1% trifluoroacetic acid (TFA) and spotted on a Bruker MTP 384 target plate. Spectra were collected on a Bruker RapifleX MALDI TOF/TOF instrument in reflectron positive ion mode with 300 shots per pixel and a 20 µm laser for m/z 40-1,000 Da. Similar solutions were prepared in deuterated water for HR-MRS experiments. Proton spectra were collected with a 5-mm TXI probe on a Bruker Avance-III 750 MHz NMR spectrometer with 8 scans. Triple-negative human MDA-MB-231 and SUM159 breast cancer cells were grown under control conditions and prepared using dual-phase extraction for HR-MRS or spun down to form a cell pellet, frozen with M-1 embedding media, and cryosectioned at 10-micron thickness onto indium-tin-oxide (ITO) slides for MALDI imaging [1]. MDA-MB-231 and SUM159 breast tumor xenografts were orthotopically grown in athymic nude mice and cryosectioned at 10-micron thickness at 50-micron intervals. Tumor tissue trimmed away from 50-micron intervals was collected for dual-phase extraction [1]. For HR-MRS, we measured both the aqueous phase containing water-soluble metabolites and the organic phase containing phospholipids [1]. For MALDI imaging, 1,5-diaminonaphthalene (1,5-DAN, 10 mg/mL) in 50% ACN with 0.2% TFA was sprayed using an HTX M5 sprayer for a final matrix density of 2.13 × 10⁻⁶ mg/mm2 [1]. MALDI imaging was performed on a Bruker RapifleX MALDI TOF/TOF instrument in reflectron positive or negative mode with raster width of 100 μm and a 50 μm laser spot size with 200 laser shots per pixel. For cell imaging, a raster width of 5 μm and 5 μm single laser spot size with 200 laser shots per pixel was used. We acquired negative ion mode from m/z 0-500 Da to detect metabolites, and positive ion mode from m/z 400-1000 Da to measure phospholipids.Results and Discussion
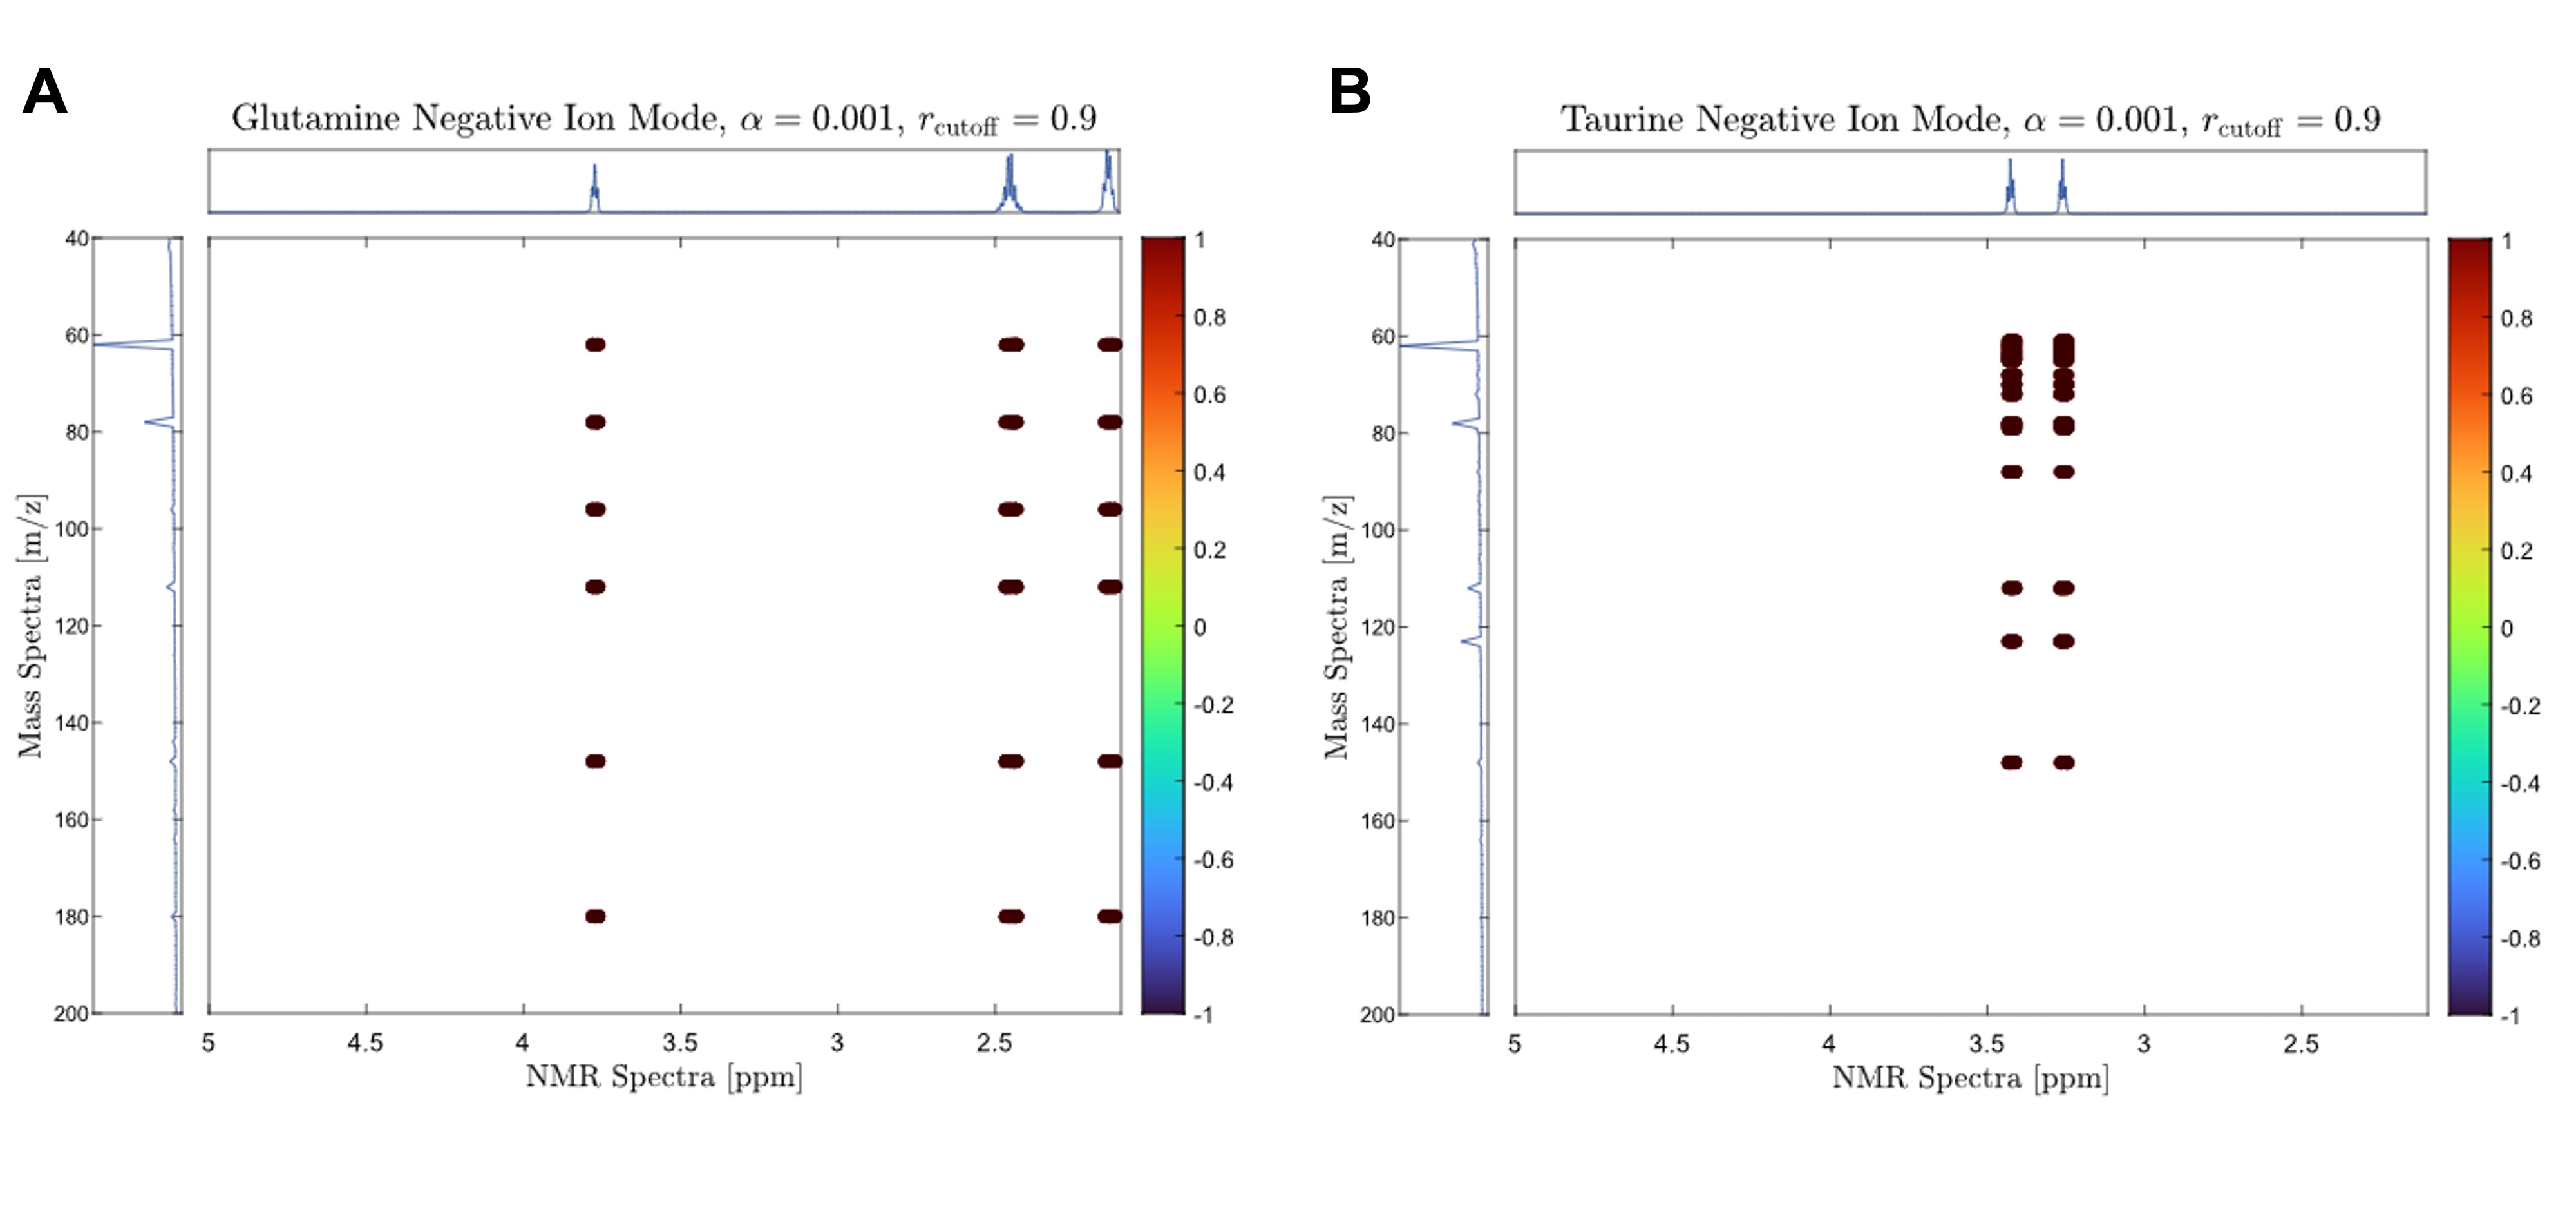
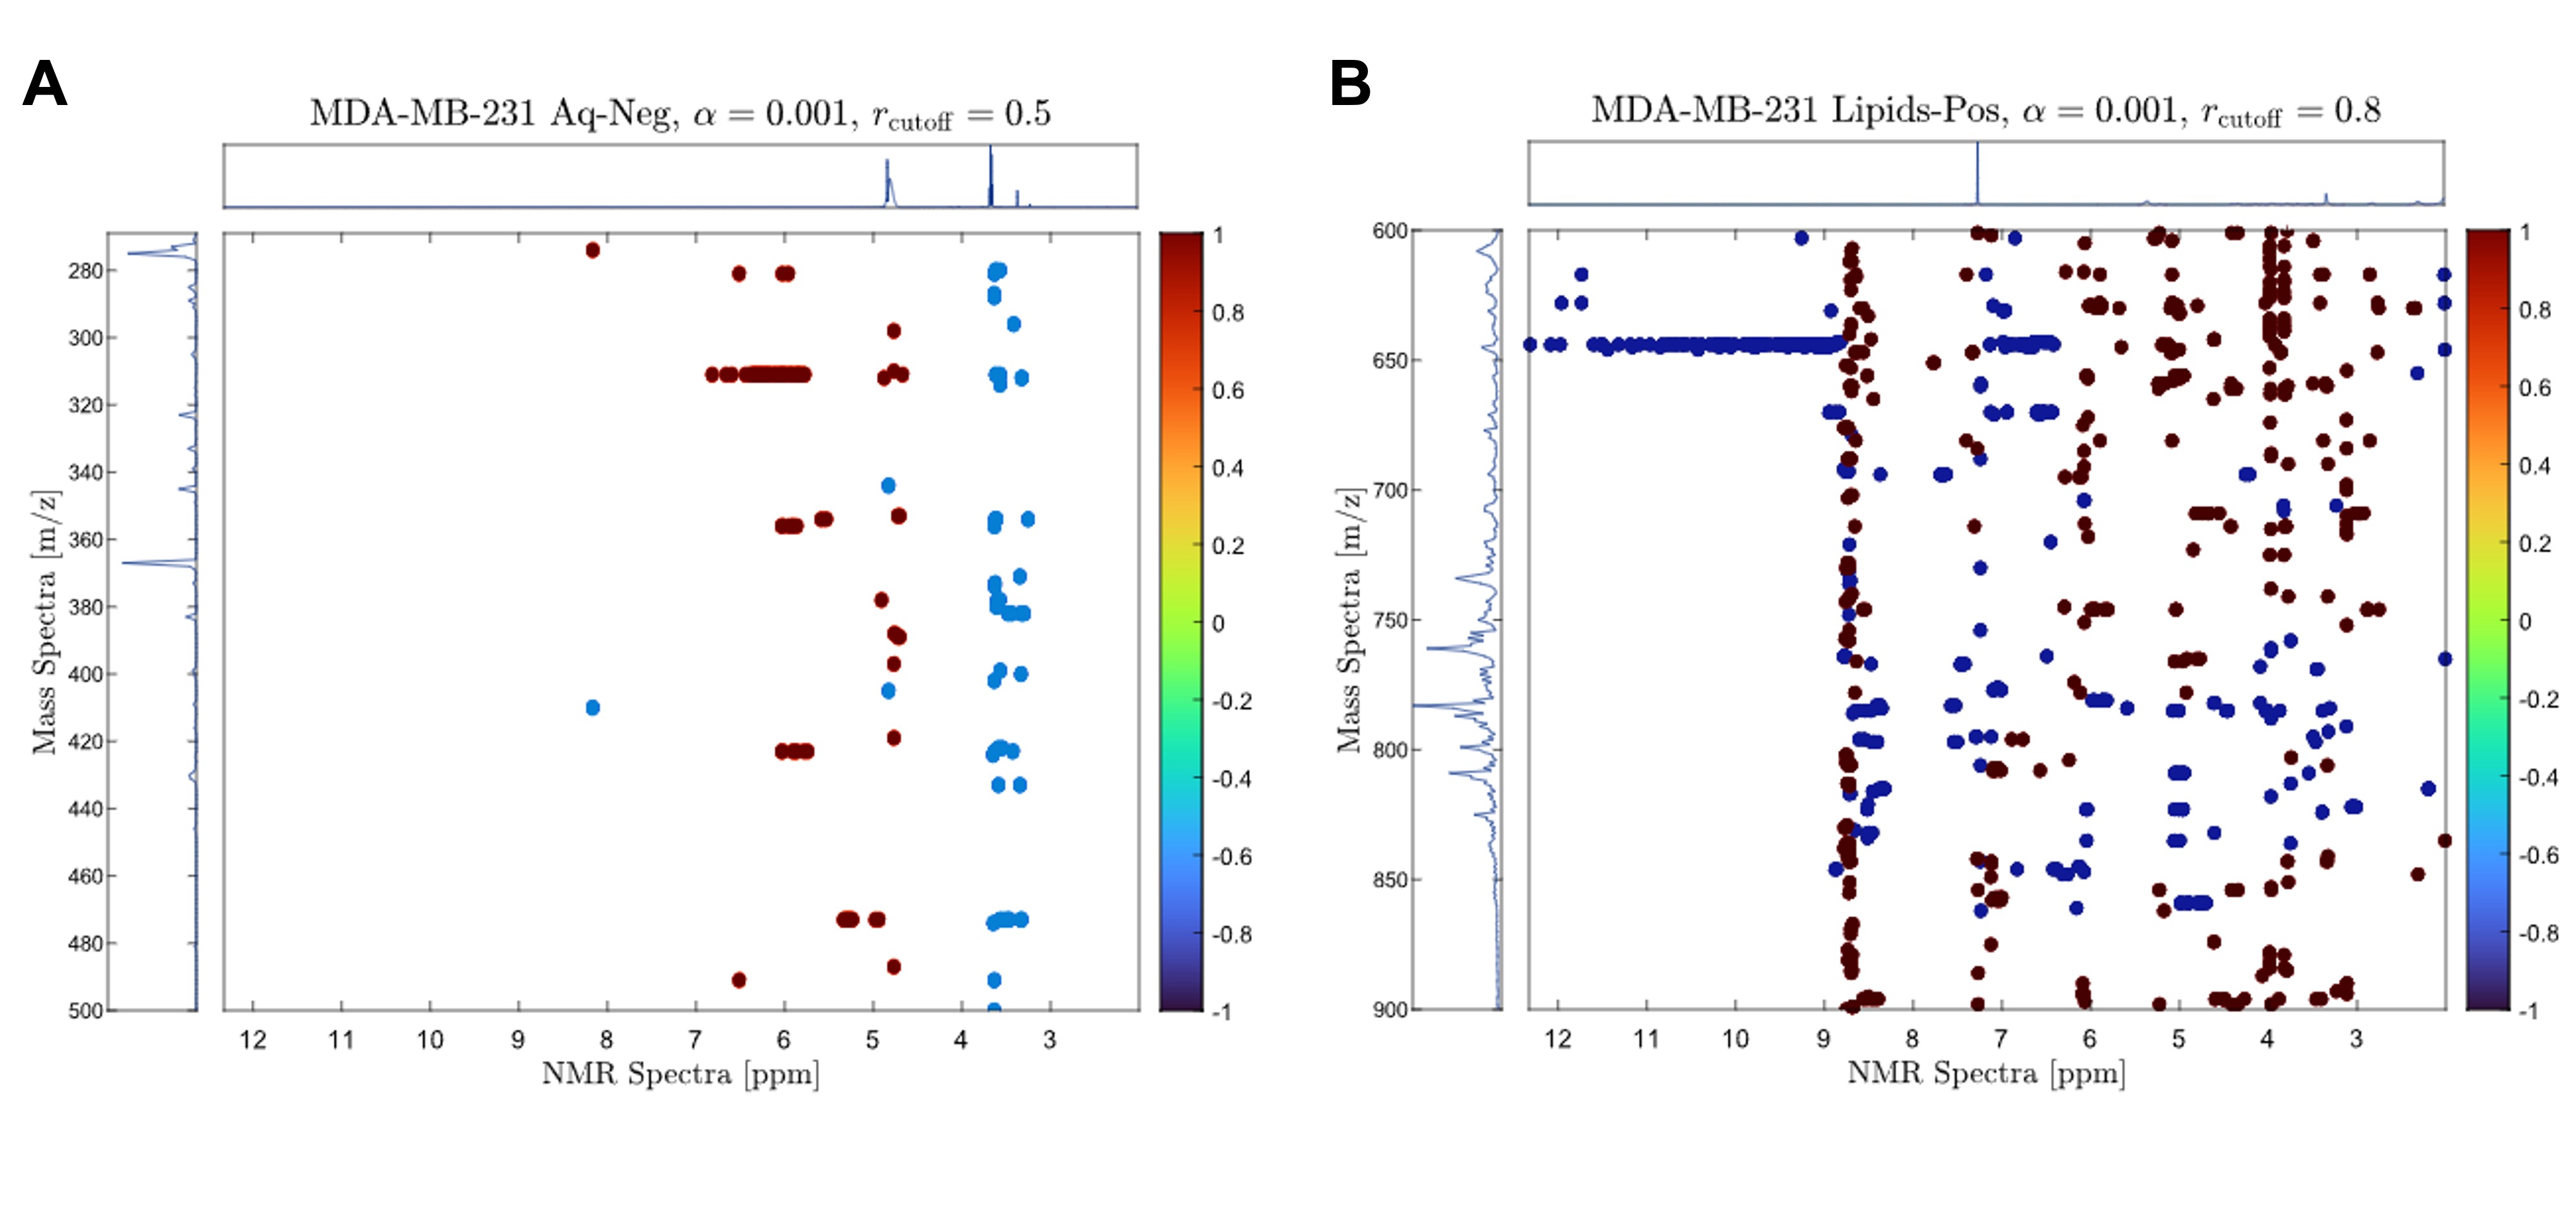
To load the data into the new MALDI-MRS-SHY software, MALDI-MS data was exported from FlexImaging and background subtracted. The data was truncated to fit the desired range for metabolites or lipids. HR-MRS data was exported from TopSpin and binned to 32,768 data points. HR-MRS data was set to a cubic spline with a resolution of 0.001 ppm, while MALDI-MS data was binned in histograms with a width of 1 Da. MALDI-MS spectra were re-binned to 32,768 data points and both datasets were imported into the newly developed MATLAB software, which set negative values to zero, normalized datasets to unit sum, and calculated the Pearson correlation coefficient for each paired m/z and ppm, which was filtered to generate a contour plot for visualization. To test the new MALDI-MRS-SHY software, we acquired and analyzed HR-MRS and MALDI target plate data from a set of phantoms, including pure glutamine, glutamate, phenylalanine, and taurine, as well as a 1:1:1:1 mixture of all four compounds. As shown in Figure 1A, the correlation plot for pure glutamine shows the expected cross-correlation peaks for negative ion MALDI-MS at m/z 145.023 for [M-H]- and HR-MRS at 2.12, 2.45, and 3.77 ppm. For pure taurine, we observed the correct cross-correlation peaks of m/z 124.958 for [M-H]- in MALDI-MS with 3.25 and 3.42 ppm in HR-MRS. We also measured combined HR-MRS-MALDI imaging from SUM159 and MDA-MB-231 cells and tumor xenografts. As shown in Figure 2 for MDA-MB-231 cells, we correlated negative ion MALDI imaging of 40-400 Da with water-soluble phase HR-MRS for metabolites, and positive ion MALDI imaging of 600-900 Da with lipid phase HR-MRS for lipids, showing positive correlations in red and negative correlations in blue. In depth data analyses to verify correct cross-correlation peaks are currently ongoing.Conclusions
We have built a MATLAB based software which allows for correlating the spectral domain of MALDI imaging data with HR-MRS data.Acknowledgements
All MALDI imaging was done in the Johns Hopkins Applied Imaging Mass Spectrometry (AIMS) Core.References
[1] Tressler CM, Ayyappan V, Nakuchima S, Yang E, Sonkar K, Tan Z, Glunde K*. A multimodal pipeline using NMR spectroscopy and MALDI-TOF mass spectrometry imaging from the same tissue sample. NMR Biomed. 2022; e4770. doi: 10.1002/nbm.4770.Figures