3963
Superparamagnetic iron oxide nanoparticles (SPIONs) as a calibration and validation tool for QSM MRI sequences1Clinical Research and Imaging Centre, South Australian Health and Medical Research Institute, Adelaide, Australia, 2Siemens Healthcare Pty Ltd., Adelaide, Australia, 3Future Industries Institute, University of South Australia, Adelaide, Australia, 4Ferronova Pty Ltd., Adelaide, Australia
Synopsis
Keywords: Preclinical Image Analysis, Quantitative Susceptibility mapping, QSM , SPION, Iron concentration
Motivation: Progressing the clinical translation of QSM is important for imaging of biometal dysregulation in neurodegenerative disease but available methods for calibrating QSM sequences between systems are limited.
Goal(s): To develop and validate a superparamagnetic iron oxide nanoparticle (SPION) phantom replicating human brain iron concentration.
Approach: Dilutions of Ferrotrace SPION (0.1-25 $$$\mu$$$g/mL) were scanned with research application QSM gradient echo sequence using two different 3T systems and multiple analysis methods.
Results: A good linear fit was demonstrated between QSM values and SPION concentration across a clinically relevant interval and different QSM analysis methods. Values differed between two scanners but there was high within-scanner concordance.
Impact: A SPION based phantom replicating in vivo iron of healthy and diseased brain could be an invaluable calibration and QA tool for QSM clinical translation, normative datasets and emerging SPION-based theranostics for brain cancer.
Introduction
Quantitative Susceptibility Mapping (QSM) is increasing being translated into clinical practice1 across a range of vendors, field and gradient strengths. Dysregulation of biometals is manifested in a variety of pathologic processes and increasingly implicated in neurodegenerative disease where brain iron content can increase up 5 times compared to healthy controls2. QSM requires attention to several methodologic issues but limited resources are available for clinical sites to reference human brain iron across different systems3. Superparamagnetic iron oxide nanoparticles (SPIONs) are stable and dilutable indicating the potential to be established as an iron brain phantom4. Several SPION-based tracers are also emerging candidates for brain cancer theranostics and reliable in vivo quantification will be an important step in new biomarkers for tumour imaging. This study investigates the quantification of SPIONs mimicking iron concentration in the human brain for QSM MRI sequence validation in two scanners.Material and Methods
A QSM phantom was made using SPION (FerroTrace; Ferronova Pty Ltd, Adelaide, SA, Australia). The FerroTrace was diluted with phosphate-buffered saline (PBS) solution into 0.1, 0.25, 0.5, 0.75, 1.0, 2.5, 5, 10, 25 $$$\mu$$$g/mL concentrations and a PBS solution as a control. The phantom was scanned on a MAGNETOM Skyra 3T (software version VE11C; Siemens Healthcare; Erlangen, Germany) and MAGNETOM Cima.X 3T (software version XA61A; Siemens Healthcare; Erlangen, Germany) using a 64-channel head/neck coil. Repeatability test-retest scans were also acquired one week after the original scan. Research application QSM gradient echo sequence parameters were TEs = 6.32, 10.63, 5.42, 20.21, 25 ms; TR = 29 ms; bandwidth = 310 Hz/Px; flip angle = 12º; matrix size = 224 × 180; number of slices = 120; voxel size = 1×1×1 mm; and scan time = 290s. The SEPIA5 pipeline control tool, MATLAB (R2021a, The MathWorks, USA), was used to post-process the QSM data. QSM phase images used Projection onto Dipole Field (PDF)6 as background field removal and Laplacian (MEDI)7 phase unwrapping, Morphology Enabled Dipole Inversion (MEDI)8 and Thresholded k-space Division (TKD)9. QSM maps were quantified by manually drawing the ROIs using ImageJ (1.46r software, NIH) and the data were averaged across three adjacent slices. Statistical analysis was performed using a non-parametric Mann-Whitney test.Results
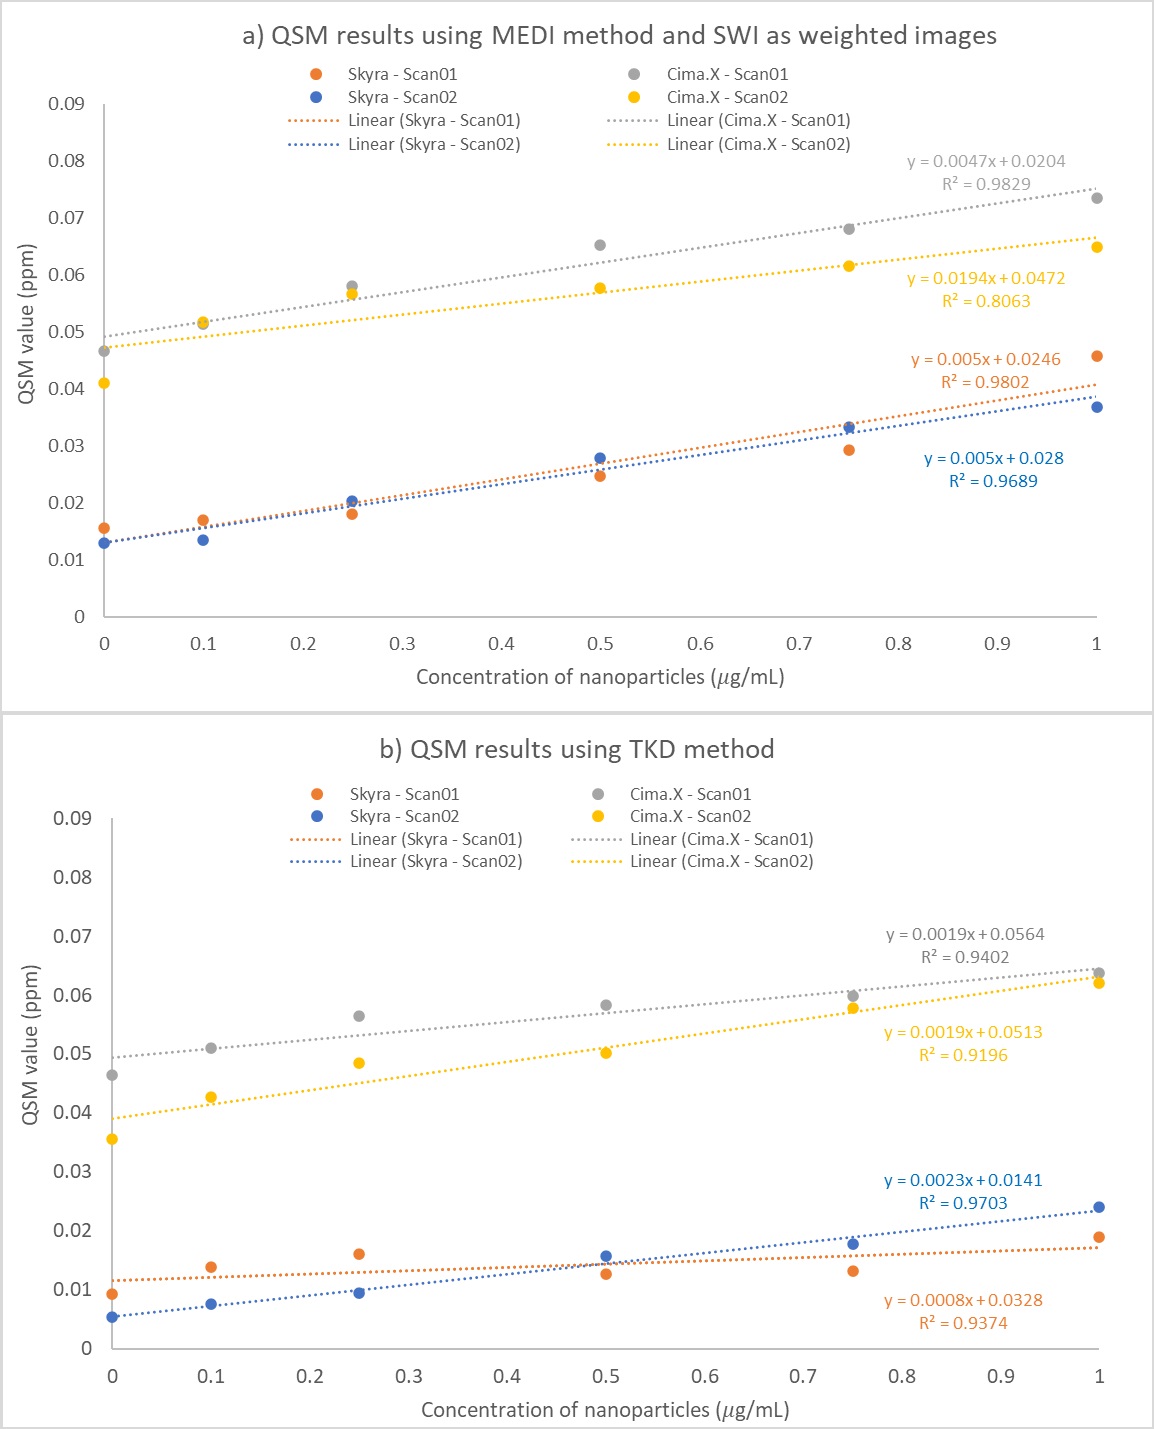
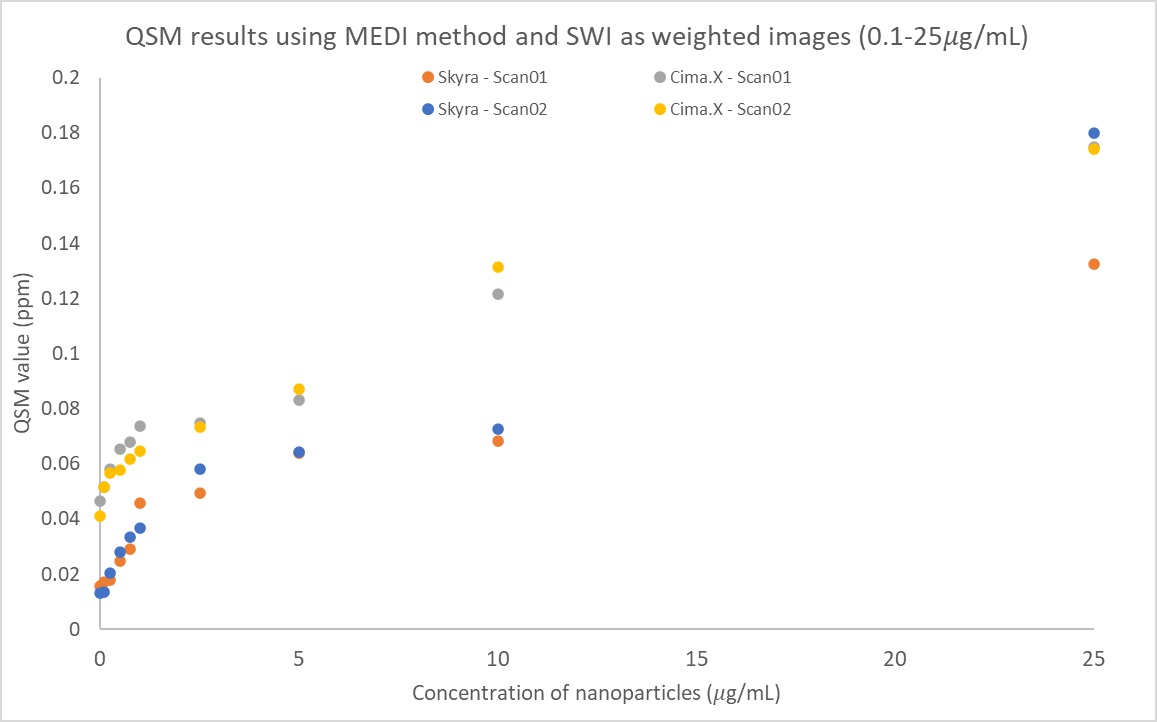
Within the range of 0.1 to 1.0 $$$\mu$$$g/mL of FerroTrace there was a good linear correlation between QSM signal and particle concentration. This interval encompasses QSM values seen in health and early neurodegenerative disease. Higher particle concentrations tested up to 25 $$$\mu$$$ g/mL showed a mild saturation effect causing a non-linear component. QSM values up to 1.0 $$$\mu$$$ g/mL from each scanner are shown in Figure 1. The MEDI method (Figure 1a) and TKD method (Figure 1b) show good concordance. There was no significant within-scanner difference on repeated measurement (p < 0.005). Full range data using the MEDI method is shown in Figure 2.Discussion
The concordance of QSM result across analysis methods and repeated measurement with a good linear relationship to SPION concentration within a clinically relevant interval indicates a SPION based phantom mimicking iron concentration of the healthy and diseased brain is feasible. QSM is impacted by many imaging factors including field strength, gradients, geometry, homogeneity and sequencing evident in difference obtained with the two scanners tested. A phantom-based validation curve may calibrate QSM results between scanners, particularly where data is referenced to normative ranges, or where research is conducted across multisite studies or longitudinal timepoints. The relationship between QSM and true concentration of iron species in the human brain is complex and susceptibility of SPIONs is higher than iron states in vivo1,10. As a result, dilute SPIONs concentrations correlate to QSM values likely to be encountered in practice. This study focuses on commonly used phase and QSM calculation methods. Further investigation is necessary to evaluate different vendors, field strengths and long-term reproducibility metrics before suitable to guide human brain studies.Conclusion
A SPION based phantom demonstrated good linear fit in a clinically relevant interval with concordant results across analysis method and within-scanner repeated measurement. Differences between scanners can be calibrated. By mimicking the susceptibility of human brain iron, a SPION phantom could function as an invaluable quality assurance tool, improving the accuracy and reliability of QSM for neurodegenerative applications and emerging SPION-based theranostics.Acknowledgements
No acknowledgement found.References
- Wang Y, Spincemaille P, Liu Z, et al. Clinical quantitative susceptibility mapping (QSM): Biometal imaging and its emerging roles in patient care. J Magn Reson Imaging. 2017;46(4):951-971.
- Kumar, P , Bulk M, Webb A, et al. A novel approach to quantify different iron forms in ex-vivo human brain tissue. Sci. Rep. 2016;6(1):38916.
- De Barros A, Arribarat G, Combis J, et al. Matching ex vivo MRI With Iron Histology: Pearls and Pitfalls. Front Neuroanat. 2019;13:68.
- Deh K, Zaman M, Vedvyas Y, et al. Validation of MRI quantitative susceptibility mapping of superparamagnetic iron oxide nanoparticles for hyperthermia applications in live subjects. Sci Rep. 2020;10(1):1171.
- Chan K, Marques J. SEPIA - Susceptibility mapping pipeline tool for phase images. NeuroImage. 2021;227(February 2021):117611.
- Liu T, Khalidov I, de Rochefort L, et al. A novel background field removal method for MRI using projection onto dipole fields (PDF). NMR Biomed.2011;24(9):1129-1136.
- Li W, Wu B, and Liu C, Quantitative susceptibility mapping of human brain reflects spatial variation in tissue composition, NeuroImage. 2011;55(4):1645-1656.
- Liu J, Liu T, Rochefort L, et al. Morphology enabled dipole inversion for quantitative susceptibility mapping using structural consistency between the magnitude image and the susceptibility map. NeuroImage. 2012;59(3):2560-2568.
- Wharton S, Schäfer A, and Bowtell R. Susceptibility mapping in the human brain using threshold-based k-space division. Magn. Reson. Med. 2010;63(5):1292-1304.
- Lide D R. Handbook of Chemistry and Physics. 81st edition, 2004. Boca Raton, FL: CRC Press; 2004.
Figures