3959
Physiological and macropathological results in swine model at 123 MHz in experimental setup for investigating thresholds of tissue damage1Institute for diagnostic and interventional Radiology, University Clinic Jena, Jena, Germany, 2Department of Radiotherapy, Charite Universitätsmedizin Berlin, Berlin, Germany, 3Department of Radiotherapy, Medical Physics Section, University Hospital Essen, Essen, Germany
Synopsis
Keywords: Large Animals, Nonhuman Primates, Safety, Swine, thermoregulation, temperature curves
Motivation:
Radiofrequency used during MRI exams heat tissue. The temperature increase is unknown and the thermoregulatory responses still need to be analyzed.
Goal(s): To analyse the temperatures within the thresholds. Are any changes seen. Is the biological simulation replicable in living swine.
Approach: SAR levels in the 2.mode were planned in the swine as an animal model.
Results: The thermoregulatory model (temperature going into a plateau) is only one pattern next to 3 other patterns (linear, parabolic, and sinusoidal). So these will change the calculations of simulations for temperatures in humans receiving MRI exams.
Impact: Radiofrequency induced temperature changes in MRI exams need to be reevaluated as new thermoregulatory patterns are observed. Increased internal temperatures are subconsciously discerned causing thermoregulation to avoid tissue damage.
Introduction
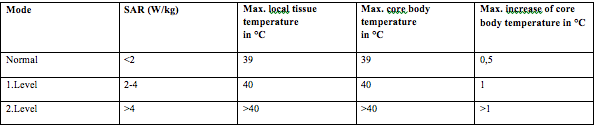
Introduction Voxel models of human torsos simulating the distribution of energy deposition of radiofrequency (RF), which is applied in a clinical magnetic resonance (MR) Scanner are used to predict the local specific absorption rate (SAR). These can exceed the global SAR (SARwb) up to a factor of 10-20 resulting in hotspots.1,2 According to the IEC 60601 2-33 standard3 different levels of SAR are allowed as long as body core temperatures are not exceeded, Tab 1. Mode SAR (W/kg) Max. local tissue temperature in °C Max. core body temperature in °C Max. increase of core body temperature in °C Normal <2 39 39 0,5 1.Level 2-4 40 40 1 2.Level >4 >40 >40 >1 Tab 1 IEC 60601 2-33 standard different levels of SAR. Normal mode is applied in regular MRI exams, 1. Level Mode is applied when bigger volumes (i.e. Whole body MRI, obese patients) are examined, 2. Level Mode is applied in research terms, needing ethical approval Following questions arise: a) as long as body core temperatures are within the limits, do the temperatures stay within the same limits; b) can changes be seen visually without further instruments; and c) are the predictions based on the assumption that all biological models react to temperature in the same way applicable.Methods
26 swine were positioned in a whole-body resonator (16 ring bird cage type) of a conventionale 3T MR system operating at 123 MHz in a quadrature mode via a 90° hybrid to a 35 KW RF power amplifier, for more detailed information on the set up see Brinker et al.4. A Swine data set was acquired via computertomography (CT), which was used as a model exposed to RF. The simulation showed two major hotspot locations (HS). The temperatures in the HS were measured invasively with fiber optic probes and the core temperature was measured in the rectum. The swine were anesthetized with propofol (2%) and 0.05mg/ml fentanyl, intubated for securing the airway and breathing freely. They were assigned 5 energy groups: a) sham SARwb=0 W/kg; b) low energy mean SARwb=2.7 W/kg, duration of exposure (EXPO) 56.3 min; c) moderate energy mean SARwb=4.8 W/kg, mean EXPO 31.2 min; d) high energy mean SARwb=4.4 W/kg, mean EXPO 60.9 min; and e) extreme energy SARwb 11.4W/kg EXPO 8 min. Temperatures were measured continuously, frequency of heart beat (HR), and frequencies of breathing (BR) were documented every minute.Results
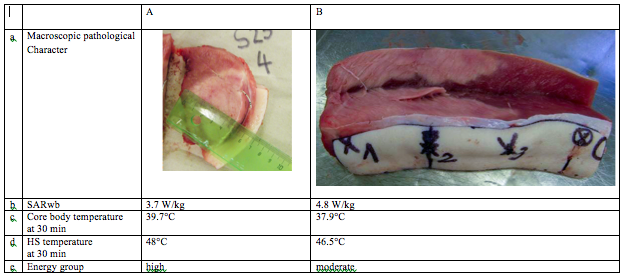
Results The temperatures of the HS probe 2 and the rectum prior, post and 20 min after RF exposure were published in Cho et al.5. The core body temperatures are within in the limits while HS temperatures exceed 42°C leading to denaturation of protein.A B a Macroscopic pathological Character b SARwb 3.7 W/kg 4.8 W/kg c Core body temperature at 30 min 39.7°C 37.9°C d HS temperature at 30 min 48°C 46.5°C e Energy group high moderate
Fig. 1 Column A shows the visual changes of the tissue in swine 23. Column B shows the visual changes of the Tissue in swine 21. As an example swine 23 was exposed to 1.Level mode, core body temperature within the limit, but macroscopically tissue damage can be seen (Fig 1). Although swine 21 exposed to 2.Level mode the core body temperature was within limits, the HS temperature was lower than swine 23 exposed to 1.Level mode, but still tissue damage can be seen (Fig 1). An answer to the different temperatures could be due to the cardiovascular response pattern5 that can be grouped into 4 main patterns: linear, plateau, parbolic, and sinusoidal. So the previous assumptions in living beings basing on one pattern only (plateau), described in multiple experimental setups, need new formulas for calculation and simulation of HS.
Conclusion
Conclusions The limits in MR safety need to be re-evaluated. More data from patients undergoing MR exams are needed, since humans have greater thermoregulatory response than for example swine. The simulation of SAR needs to encompass different patternsAcknowledgements
I am deeply indebted to Eckart Stetter (Siemens) and Gerhard Brinker (Siemens) for organizing the financial, technical, and logistic support. I am grateful for my meanwhile both deceased mentors Peter Wust (Charité) who introduced me to the field of hyperthermia and Christian Grosse-Siestrup (Charité) who was responsible for the official authorisation to carry out the animal experiments, for supervising this project in the field of veterinarymedicine, and for the mental support in evaluating and publishing this work. I thank Jacek Nadobny (Charité) for his experience in the calculations for Hyperthermia and the four veterinarians Katja Reiter, Sarah Ribereau, Friedericke Kobelt, and Markus Piaskowski for their assistance with the animals and execution of the invesitgation. I also thank Gisela Stoltenburg for her counseling in muscle histopathology.References
1.
Nadobny et al., IEEE Transactions of biomedical engineering, Vol.54, No 10,
October 2007
2. Collins et al. Proc. Intl. Soc. Magn. Reson. Med 14 (2006)
3 International Elecrotechnical Commission, IEC 60601-2-33:2002E
4. Brinker et al., Proc. Intl. Soc. Magn. Reson. Med. 18(2010)
5. Cho et al, Bioelectromagnetics. 42(2021)
Figures