3957
Preliminary clinical application of a fast abdomen T2 mapping technique based on single‑shot multiple overlapping‑echo acquisition1Radiology Department, ZhongShan Hospital (Xiamen), Fudan University, Xiamen, China, 2Department of Electronic Science, Fujian Provincial Key Laboratory of Plasma and Magnetic Resonance, Xiamen University, Xiamen, China, 3MSC Clinical & Technical Solutions, Philips Healthcare, Shenzhen, Shenzhen, China
Synopsis
Keywords: Preclinical Image Analysis, Quantitative Imaging
Motivation: The clinical value of newly ultrafast multiple overlapping-echo detachment T2 mapping (MOLED-T2 mapping) on common liver tumors has not yet been elucidated.
Goal(s): To test the reliability of MOLED-T2 mapping in common hepatic tumors during clinical applications.
Approach: Total of 23 healthy subjects and 59 patients were enrolled in our study. Free breath MOLED-T2 mapping, breath hold MOLED-T2 mapping and most used breath hold GraSE T2 mapping were compared.
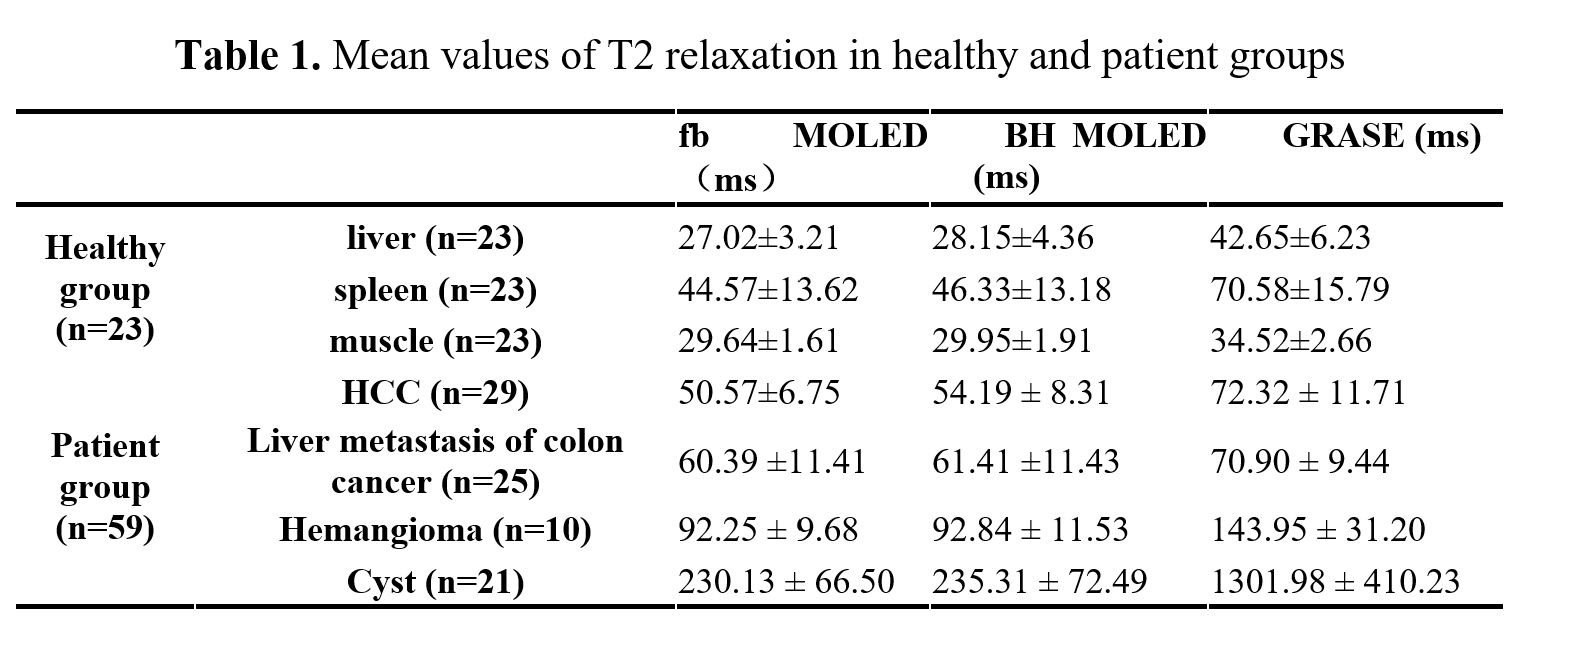
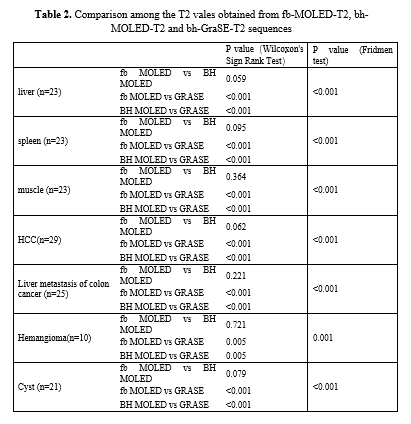
Results: There was no significant difference between free breath and breath hold MOLED-T2 mapping. T2 values obtained from two MOLED sequences were significantly lower than those obtained through fb-GraSE-T2 sequence.
Impact: This work will stand up the foundation for subsequent research about MOLED-T2 mapping on abdomen quantitative MR imaging.
Introduction
As one of the MR quantitative technologies, T2 mapping is objective, reproductive and stable. It has been applied to several diseases, including prostate tumors, breast tumors, osteoarthritis, and myocardial edema [1-4]. In the aspect of abdomen tumors or diseases, the most used T2 mapping method is based on breath-hold GraSE sequence. However, its application is limited due to its time-consuming and strict breath-holding. In recent years, a newly fast abdomen T2 mapping sequence based on single‑shot multiple overlapping‑echo acquisition and deep learning reconstruction (MOLED-T2 mapping) was reported [1]. This study aimed to validate the reliability of this newly fast T2 mapping sequence in common hepatic tumors during clinical applications.Methods
After getting institutional review board approval, a total of 23 healthy subjects and 59 patients were enrolled in our study. All healthy subjects underwent abdomen non-contrast MR scanning, while patients underwent abdomen contrast MR examination. All subjects were scanned with additional sequences of free breath MOLED-T2 mapping (fb-MOLED-T2, voxel=1.9×1.9×4.0 mm3, TR = 6000 ms, TE=19.4, 44.6, 69.6, 94.8 ms, thickness/spacing= 4mm / 1mm, 21 slices, scanning duration: 13s), breath hold MOLED-T2 mapping (bh-MOLED-T2, voice command + scanning duration: 4s + 13s, other parameters were the same as fb-MOLED-T2) and most used breath hold GraSE T2 mapping (bh-GraSE-T2, TR=1000ms, TE:9×7.4ms, Thickness/spacing= 4mm/1mm, 21 slices, scanning duration: 5.95 min) on a 3.0T MR scanner (Philips Ingenia CX). T2 relaxation value of fb-MOLED-T2 and bh-GraSE -T2 sequences was calculated by a homemade software named “OLEDRecon platform v0.1” based on deep learning reconstruction from the sequence developer team (Qinqin Yang and Congbo Cai). T2 relaxation value of fb-GraSE-T2 sequence was obtained simply from the T2 map generated from the scanner. For the image quality of fb-MOLED-T2 and bh-MOLED-T2 sequences, two experienced radiologists conducted a double-blind evaluation of image artifacts, lesion display clarity, and overall image quality based on the 4-point Likert scale. The scoring results of images under different sequences were compared. 29 regions of interest (ROIs) in 27 patients with hepatocellular carcinoma (HCC), 23 ROIs in 16 patients with liver metastasis of colon cancer, 10 ROIs in 8 patients with hemangioma and 21 ROIs in 8 patients with cysts were measured by two radiologists respectively. In the healthy group, the T2 values of liver, spleen and muscle on the hepatic hilum level were compared among these three methods. Also, in the patient group, T2 values were compared among these three methods in each group.Results
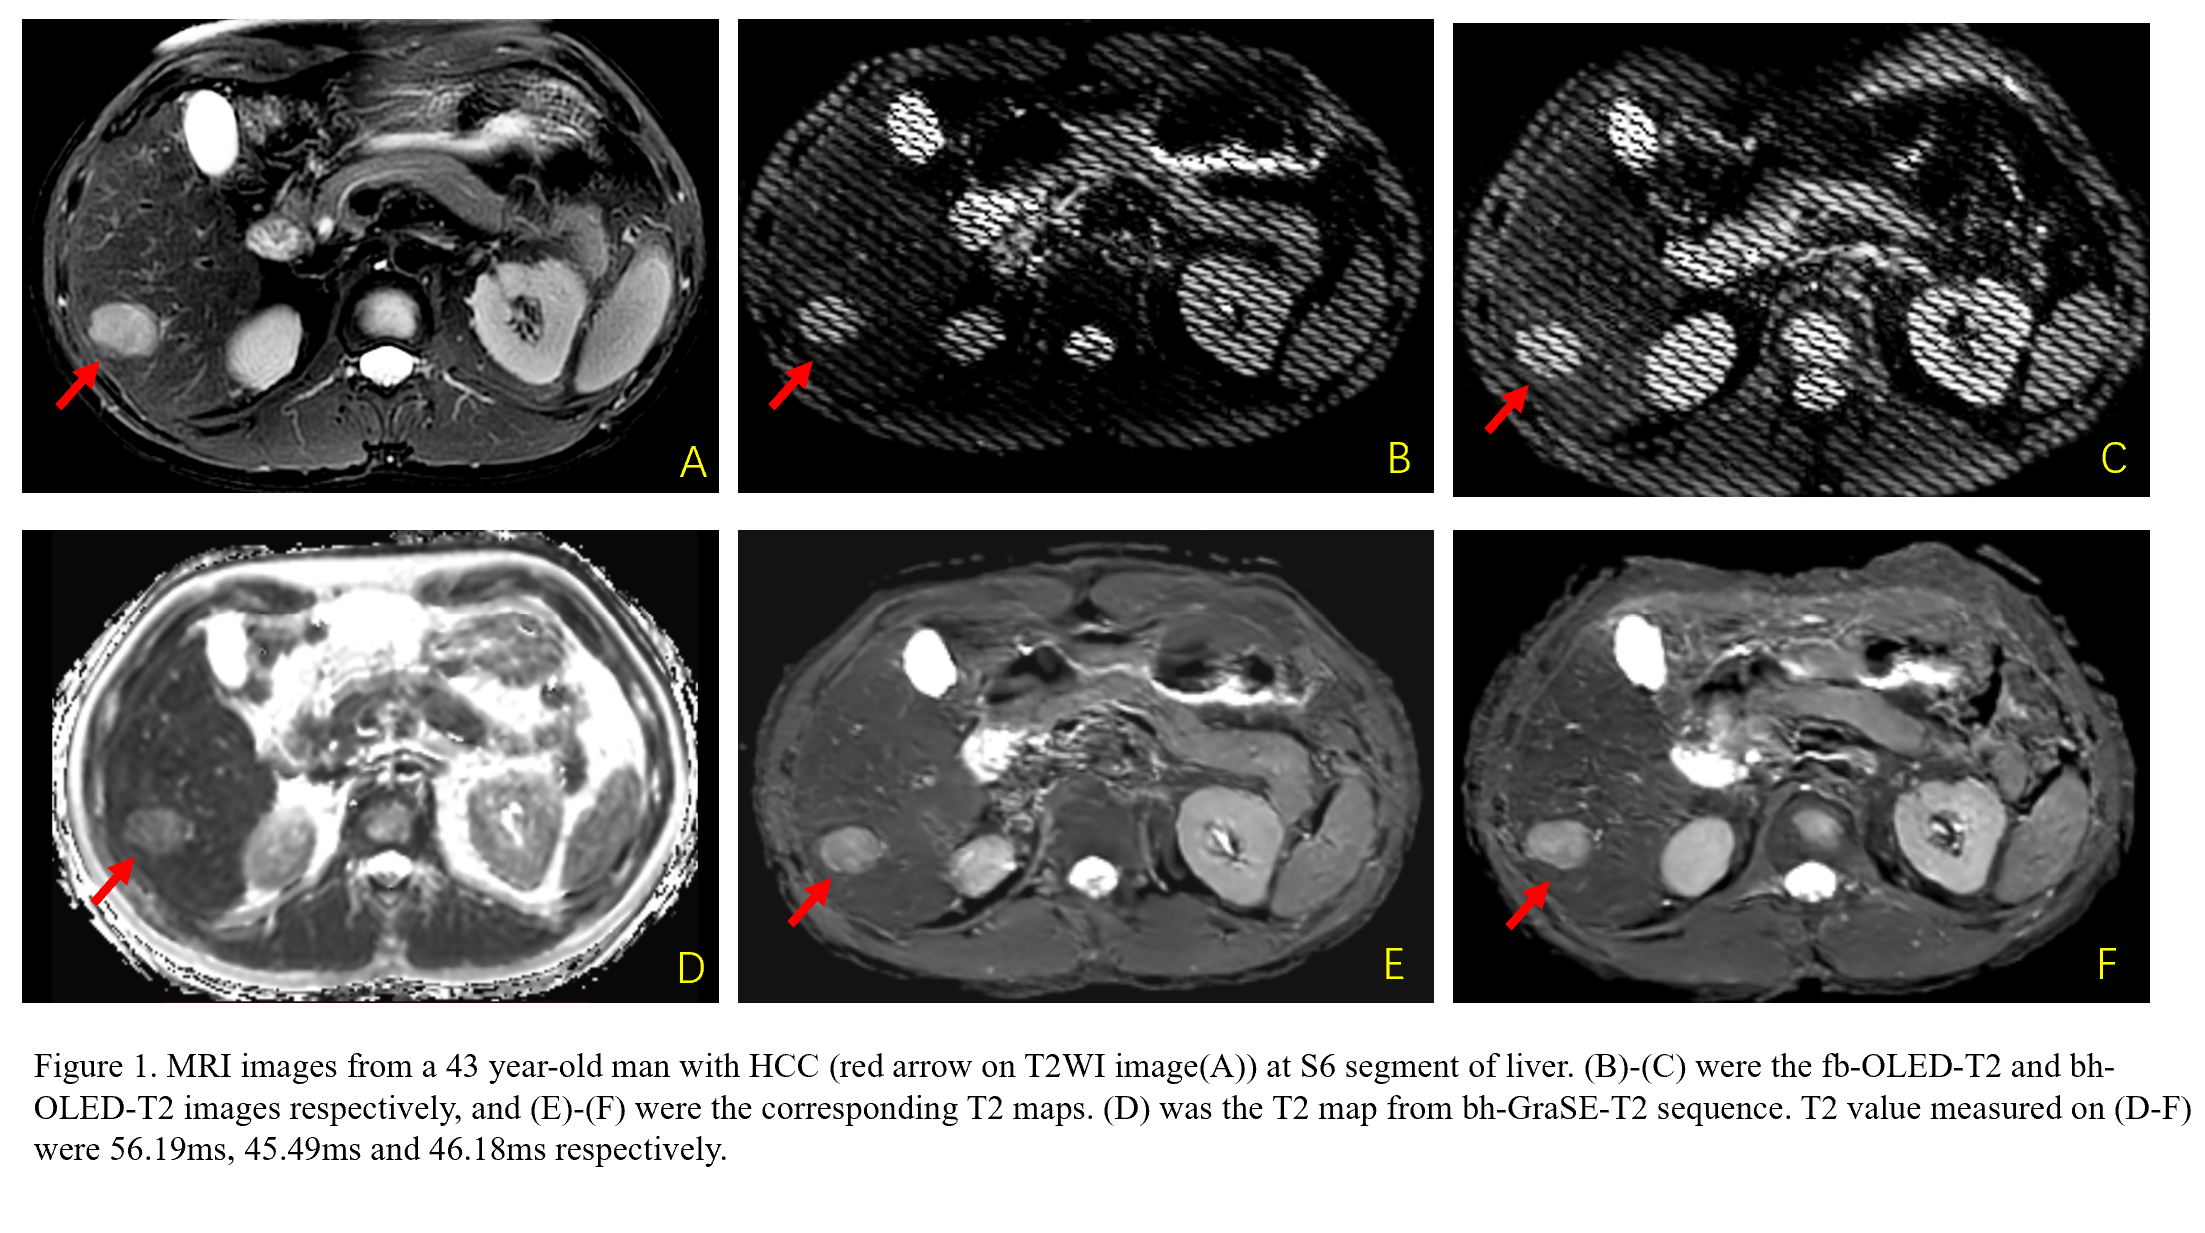
For the overall image quality, the bh-MOLED-T2 sequence (4 [3.75-4]) scored significantly better than fb-MOLED-T2 sequence (3.6 [3.25-3.80]) (p<0.01). T2 values of liver, spleen and muscle in the healthy group using fb-GraSE-T2 sequence were significantly higher than those obtained through the other two MOLED sequences (all p values < 0.05), while there was no significant difference between those values obtained by fb-MOLED-T2 and bh-MOLED-T2 (Table 1). For the patient group, T2 values of HCC, liver metastasis of colon cancer, hemangioma and cyst using fb-GraSE-T2 sequence were also significantly higher than those obtained through two MOLED sequences (all p values < 0.05), while there was no significant difference between those values obtained by fb-MOLED-T2 and bh-MOLED-T2 (Fig.1, Table 3-4).Discussion
Commonly used The reference method, GraSE, is a mixed sequence of TSE and EPI with a signal of susceptible to stimulated echoes, non-uniform B1 field, and imperfect refocusing pulses, resulting in overestimation of T2 values. So So far, there are few methods that can achieve accurate T2 quantification of the abdomen, This is also one of the great advantages and features of MOLED. Although the image The quality of the bh-MOLED-T2 sequence is higher than that of the FB-MOLED-T2 sequence There was no significant difference between their T2 values, either in the healthy group Also not in the patient population.Conclusion
Overall, the MOLED-T2 sequence can be used to obtain T2 values of common liver tumors in a very short scanning time consuming without breath-hold. This work will stand up the foundation for subsequent research about MOLED-T2 mapping.Acknowledgements
No acknowledgement found.References
[1]. Garcia-Reyes K, Passoni NM, Palmeri ML, et al. Detection of prostate cancer with multiparametric MRI(mpMRI): effect of dedicated reader education on accuracy and cofidence of index and anterior cancer diagnosis. Abdom Imaging 2015;40:134–142.
[2]. Van Houdt PJ, Agarwal HK, van Buuren LD, et al. Performance of a fast and high-resolution multi-echo spin-echo sequence for prostate T2 mapping across multiple systems. Magn Reson Med 2018;79:1586-1594.
[3]. Liu L, Yin B, Shek K, et al. Role of quantitative analysis of T2 relaxation time in differentiating benign from malignant breast lesions. Int Med Res, 2018, 46(5): 1928-1935.
[4]. Ghosh A, Singh T, Bagga R, et al. T2 relaxometry mapping in demonstrating layered uterine architecture: parameter optimisation and utility in endometrial carcinoma and adenomyosis: A feasibility study. Br J Radiol, 2017, 91(1081):20170377.
[5]. Lin X, Dai L, Yang Q, Yang Q, He H, Ma L, Liu J, Cheng J, Cai C, Bao J, Chen Z, Cai S, Zhong J. Free-breathing and instantaneous abdominal T2 mapping via single-shot multiple overlapping-echo acquisition and deep learning reconstruction. Eur Radiol. 2023 Jul;33(7):4938-4948.
Figures