3956
Distribution of MRI-derived T2 values as a biomarker for in vivo rapid screening of phenotype severity in MDX mice1Center for Advanced Molecular Imaging, Northwestern University, Evanston, IL, United States, 2Biomedical Engineering, Northwestern University, Evanston, IL, United States, 3Department of Radiology, Northwestern University Feinberg School of Medicine, Chicago, IL, United States, 4Center for Genetic Medicine, Northwestern University Feinberg School of Medicine, Chicago, IL, United States, 5Department of Pharmacology, Northwestern University Feinberg School of Medicine, Chicago, IL, United States
Synopsis
Keywords: Small Animals, MSK, muscular dystrophy
Motivation: The frequently-used mdx model of Duchenne muscular dystrophy exhibits wide variation in disease severity, confounding detection of treatment effects.
Goal(s): We sought to design a rapid, noninvasive imaging/analysis pipeline to prescreen animals and balance disease severity across treatment groups.
Approach: Axial MR images and T2 maps were obtained in the hindlimbs of mdx and wildtype mice. A neural network was trained to speed segmentation. The distribution of muscle T2 values was analyzed.
Results: Semiautomated segmentation reduced image processing time ~tenfold. Pearson Skew and interdecile range of muscle T2 distributions were repeatable indicators of muscle disease severity and correlated with Evans Blue dye uptake.
Impact: Use of this rapid, non-invasive, semi-automated MRI/analysis pipeline has the potential to improve the sensitivity of preclinical treatment studies by enabling screening of dystrophic mice prior to study enrollment to increase uniformity of muscle pathology across treatment groups.
Background
Duchenne muscular dystrophy (DMD) is an inherited muscle wasting disease caused by loss of dystrophin, a protein linking the cytoskeleton with the extracellular matrix. Without it, muscle membranes become easily disrupted, causing muscle degeneration, fibrosis, and immune infiltration. The dystrophin-deficient mdx mouse model on the C57Bl/10 background (mdxB10) is commonly used in preclinical therapeutic trials as it recapitulates many pathological features seen in humans with DMD.1 A more severe model referred to as mdxD2 recapitulates additional pathological features but is more challenging to work with.2 The mdx models display a wide range of intra- and inter-animal variability.3 This inherent variation contributes to poor assay sensitivity and necessitates large cohorts of animals to identify treatment effects.4 We hypothesize that the distribution of muscle T2 values reflects features of underlying disease, and propose a high-throughput screening method that combines MRI, semi-automated segmentation, and analysis with meaningful summary statistics to estimate disease severity in vivo, balance treatment groups, and a priori exclude animals with outlier disease burdens.Methods
Male wildtype (WT, n=9), mdxB10 (n=25) and mdxD2 (n=6) mice were purchased from Jackson Laboratory and imaged at 8 weeks old. 3 WT mice and 5 mdxB10 mice were reimaged 3 days later. Mice were anesthetized with isoflurane, positioned prone with legs folded under the body, and imaged in a Bruker 40mm quadrature volume coil on a 9.4T Bruker Biospec 9430 running Paravision 6.0.1. A T2 map was acquired using an axial multi slice spin echo sequence (MSME) centered at mid-calf. Parameters were: TR=4000 ms, TE=10-250 ms (25 echoes, 10ms echo spacing), MTX=256x256, FOV=35x35mm, 5 slices, 1mm slice thickness and 1 signal average. Acquisition time was ~18 minutes.5 WT mice (n=5), mdxB10 mice (n=4) and mdxD2 mice (n=3) were euthanized for measurements of Evans Blue dye uptake as described previously.6Images were imported into Amira 2020.2 (Thermo Fisher Scientific, USA). The first echo of the T2 map acquisition was used to segment muscle from bladder, bone, and fat. A segmentation model was trained using Amira’s “Deep Learning Training” module with 20 mdxB10 and 5 WT datasets as training data, datasets from reimaged mice as test data, and 5 mdxB10 and 3 WT datasets as validation data. Using the Amira Python console, the T2 map acquisition was masked to include only muscle voxels and fitted in JIM 7 (Xinapse Systems, UK) using the built-in monoexponential model. The top and bottom 1% of T2 values were excluded to reduce the effect of outliers on summary statistics. For each dataset, the interdecile range (IDR, 90th percentile value - 10th percentile value) was calculated as a measure of distribution spread. The mode (location of the peak) was computed by fitting a kernel density function to the measured T2 values and finding the T2 value corresponding to the distribution peak. The Pearson Mode Skewness $$\frac{\text{mean} - \text{mode}}{\text{standard deviation}}$$ was calculated as a measure of distribution symmetry.7
Results
Segmenting muscle from other tissues was manual, time-consuming, and subject to variability. Use of the deep learning model reduced the time for generating muscle ROIs to a few seconds and reduced total hands-on analyst time to approximately 10 minutes. In the validation dataset, the model-predicted label field matched the ground truth label field with Jaccard Index=0.97. 39 mice were imaged in 47 imaging sessions. Of the 47 T2 maps, one slice was excluded from each of 10 maps due to respiratory artifact, and two slices were excluded from one map. Bounded T2 values for each imaging session ranged from 19.3-81.4 seconds. Disease phenotypes ranging from mild to severe were observed in the T2 maps (Figure 1). The measured distributions of T2 values are asymmetric and poorly characterized by the Gaussian distribution corresponding to the data mean and standard deviation. Distribution shape changes with disease severity: wider, more asymmetric distributions correspond to more severe disease, and narrower distributions to milder disease. A plot of skew vs. IDR of the T2 value distribution was effective in stratifying disease severity (Figure 2). Measurements of skew and interdecile range were repeatable across imaging sessions (Figure 3) and correlated with Evans Blue Dye uptake (Figure 4).Discussion & Conclusion
We have outlined a non-invasive, quick, and reproducible imaging and analysis protocol based on the distribution of hindlimb T2 values that can stratify the severity of muscle damage before enrolling animals to aid in preclinical therapeutic study design. The proposed pipeline could improve studies of therapeutic efficacy in mouse models of muscular dystrophy by helping to balance study cohorts across the disease spectrum and a priori exclude animals with either extremely severe or extremely mild disease.Acknowledgements
This work was supported by National Institutes of Health AR052646, HL167813, NS047726, NS127383, Additional funding was through Lakeside Discovery. MRI was performed at the Northwestern University Center for Advanced Molecular Imaging (RRID:SCR_021192) generously supported by NCI CCSG P30 CA060553 awarded to the Robert H Lurie Comprehensive Cancer Center. EAW is supported by CZI grant DAF2021-225578 and grant DOI 10.37921/641514jmpbzq from the Chan Zuckerberg Initiative DAF, an advised fund of Silicon Valley Community Foundation (funder DOI 10.13039/100014989)References
1. McGreevy JW, Hakim CH, McIntosh MA, Duan D. Animal models of Duchenne muscular dystrophy: from basic mechanisms to gene therapy. Disease Models & Mechanisms. 2015;8(3):195-213.
2. Fukada S, Morikawa D, Yamamoto Y, Yoshida T, Sumie N, Yamaguchi M, et al. Genetic background affects properties of satellite cells and mdx phenotypes. Am J Pathol. 2010;176(5):2414-24.
3. Grounds MD, Radley HG, Lynch GS, Nagaraju K, De Luca A. Towards developing standard operating procedures for pre-clinical testing in the mdx mouse model of Duchenne muscular dystrophy. Neurobiol Dis. 2008;31(1):1-19.
4. Spurney CF, Gordish-Dressman H, Guerron AD, Sali A, Pandey GS, Rawat R, et al. Preclinical drug trials in the mdx mouse: assessment of reliable and sensitive outcome measures. Muscle Nerve. 2009;39(5):591-602.
5. Waters EA. MR imaging of the mouse hindlimb musculature (T2 weighted and T2 map): protocols.io; 2023 [Available from: https://protocols.io/view/mr-imaging-of-the-mouse-hindlimb-musculature-t2-we-cucjwsun
6. Demonbreun AR, Wyatt EJ, Fallon KS, Oosterbaan CC, Page PG, Hadhazy M, et al. A gene-edited mouse model of limb-girdle muscular dystrophy 2C for testing exon skipping. Dis Model Mech. 2019;13(2).
7. Weisstein EW. Pearson Mode Skewness MathWorld--A Wolfram Web Resource: Mathworld; [Available from: https://mathworld.wolfram.com/PearsonModeSkewness.html.
Figures
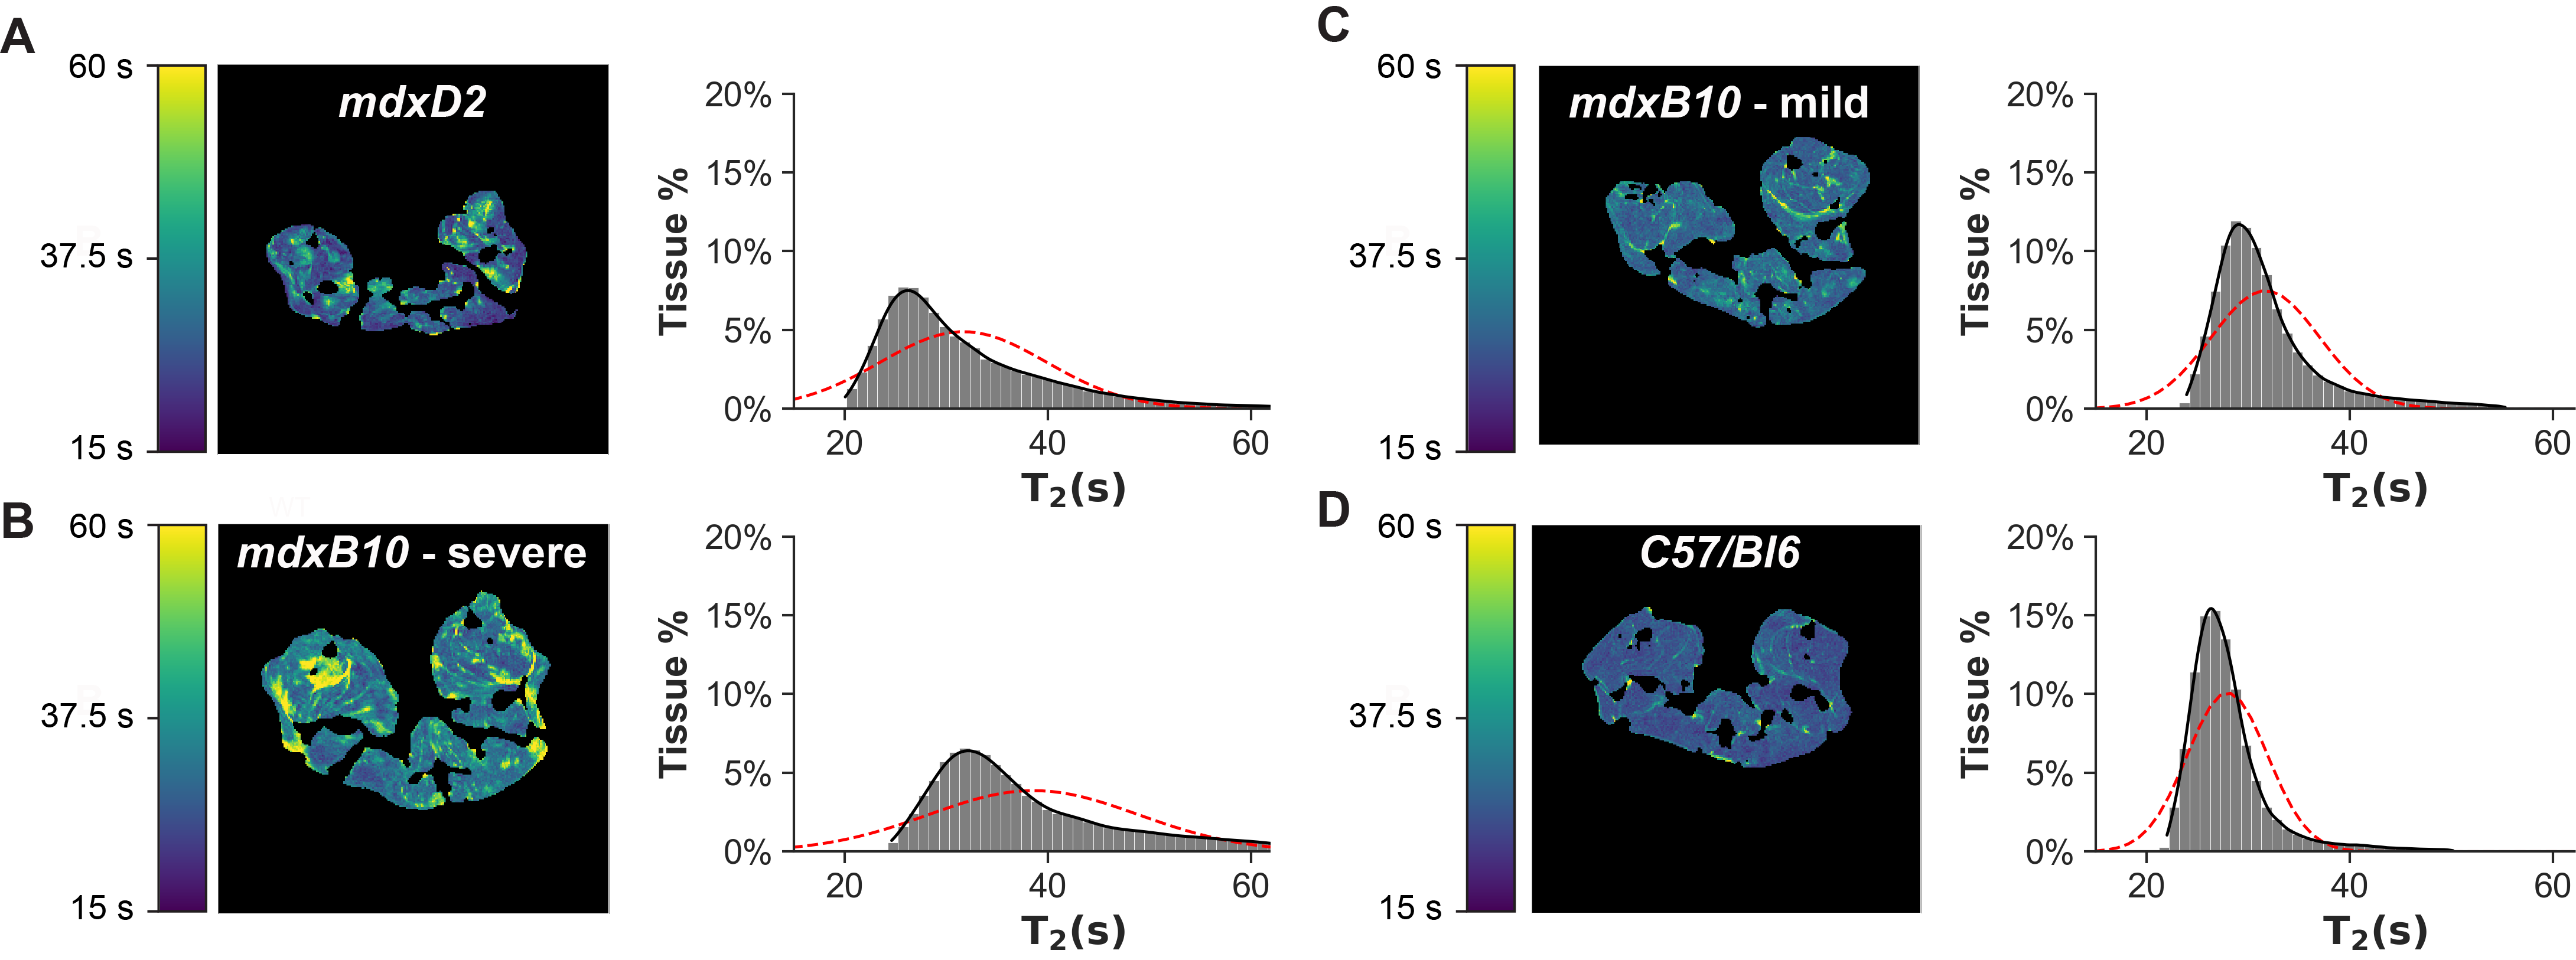
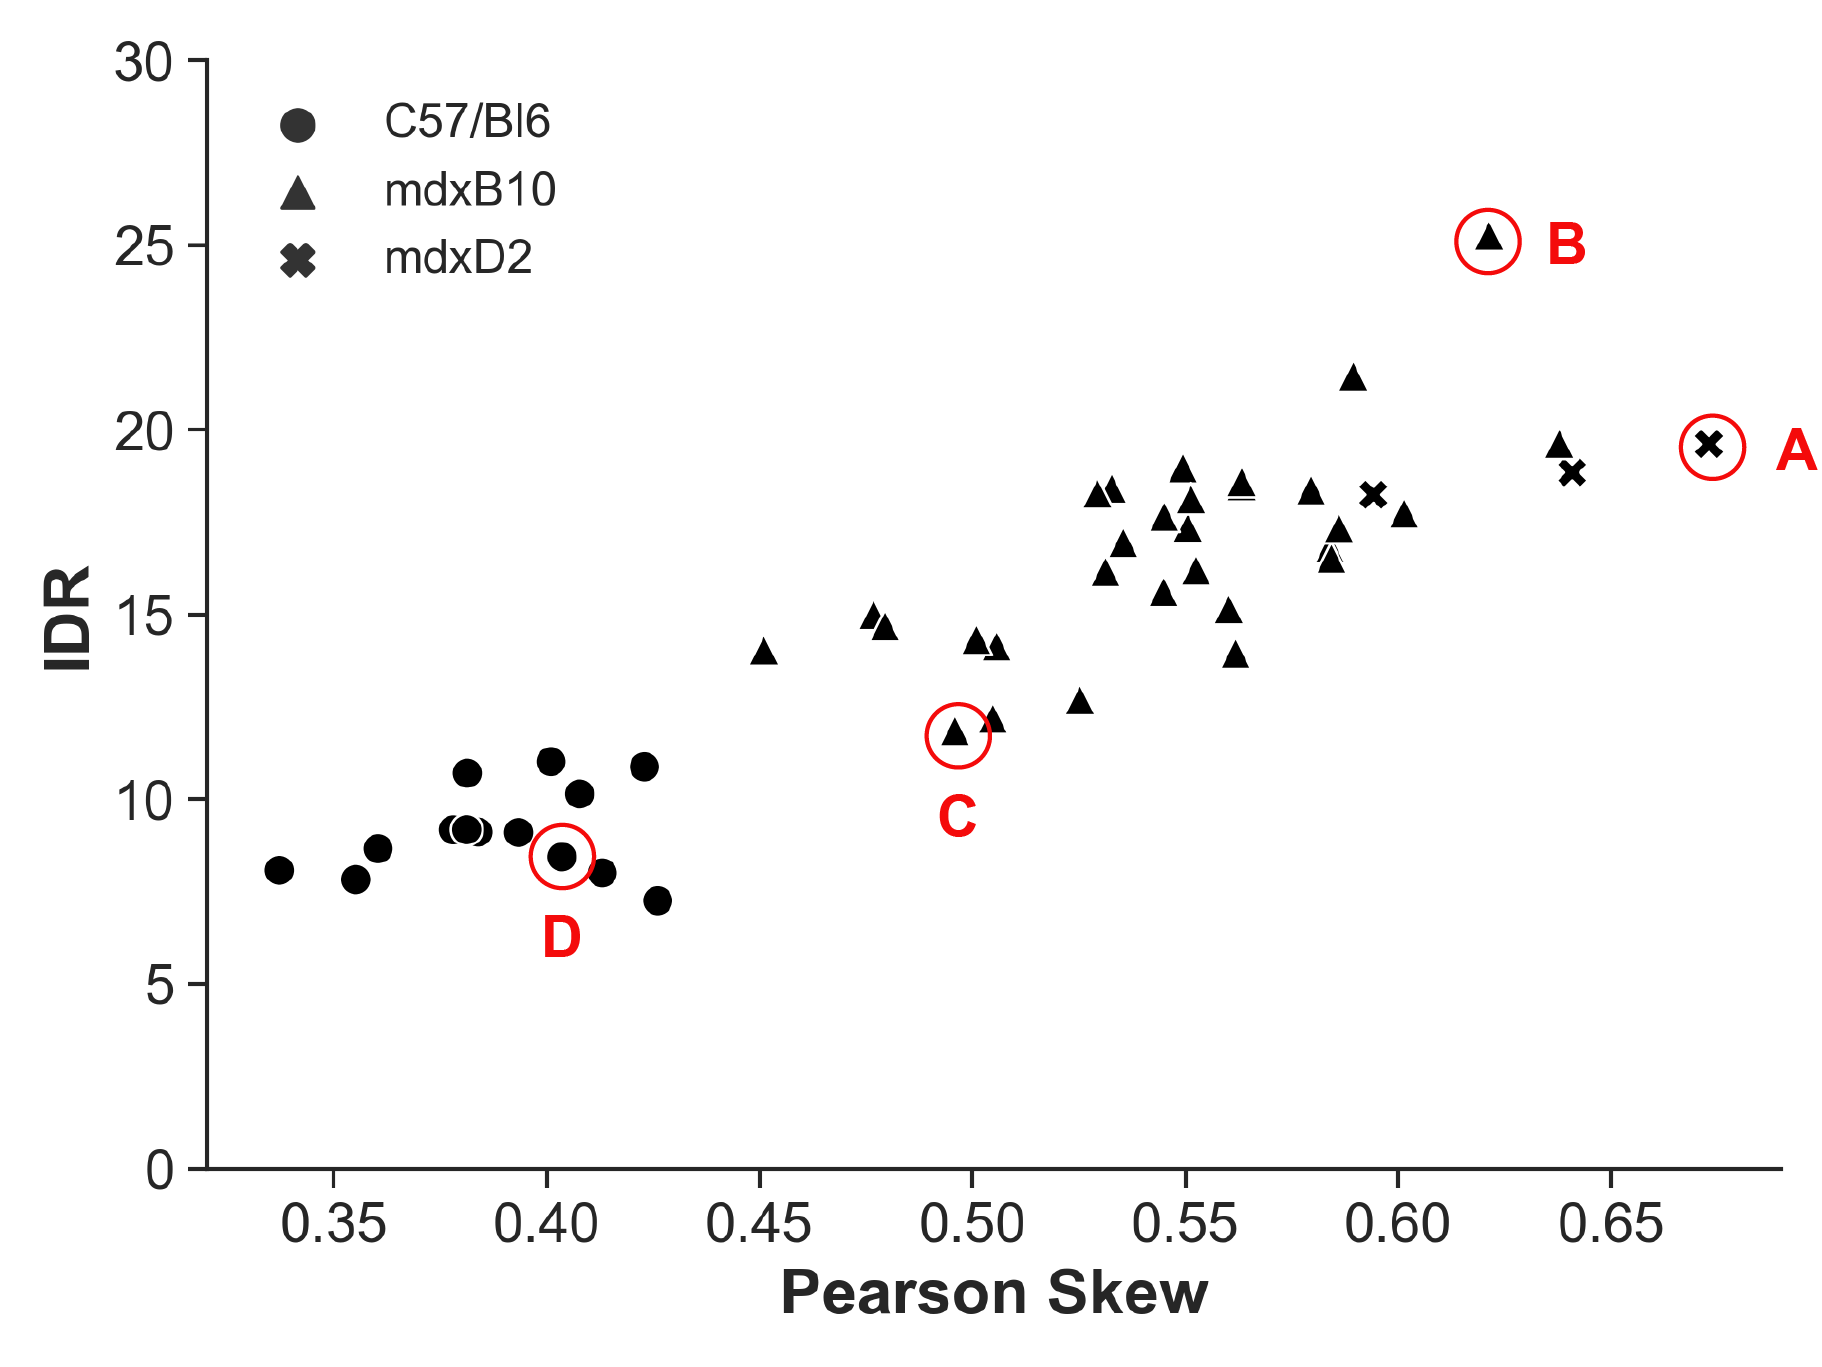
Figure 2: A plot of Pearson Skew vs interdecile range (IDR) for 20 mdxB10 animals and 5 healthy WT control animals, demonstrating that skew and IDR clearly separate the mdx and wildtype animals, identify a spectrum of disease in mdxB10 animals, and locate mdxD2 animals at the severe end of the disease spectrum. Data points marked A-D correspond to the images and distributions shown in Figure 1.
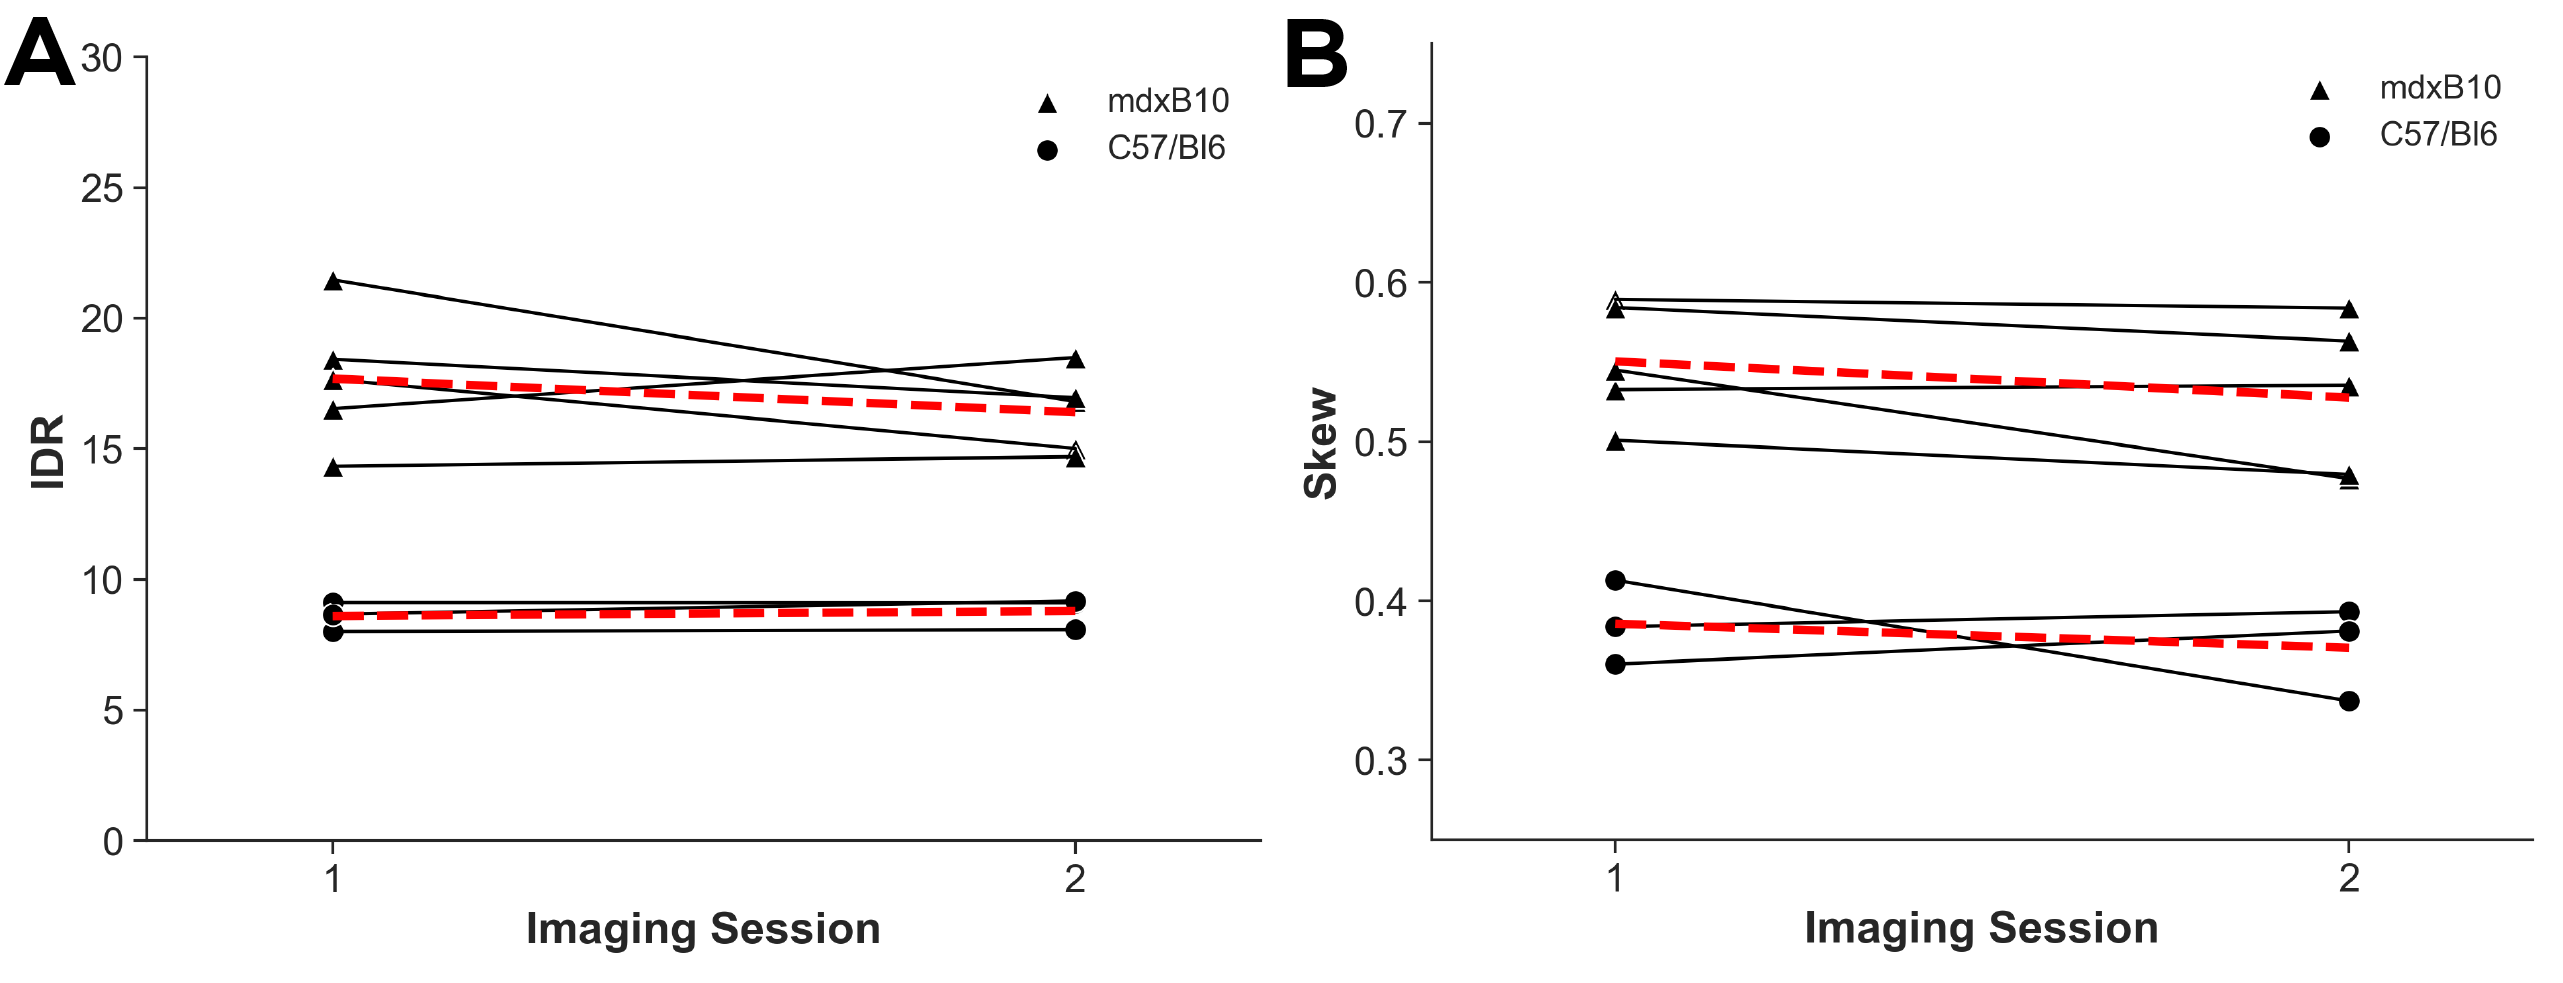
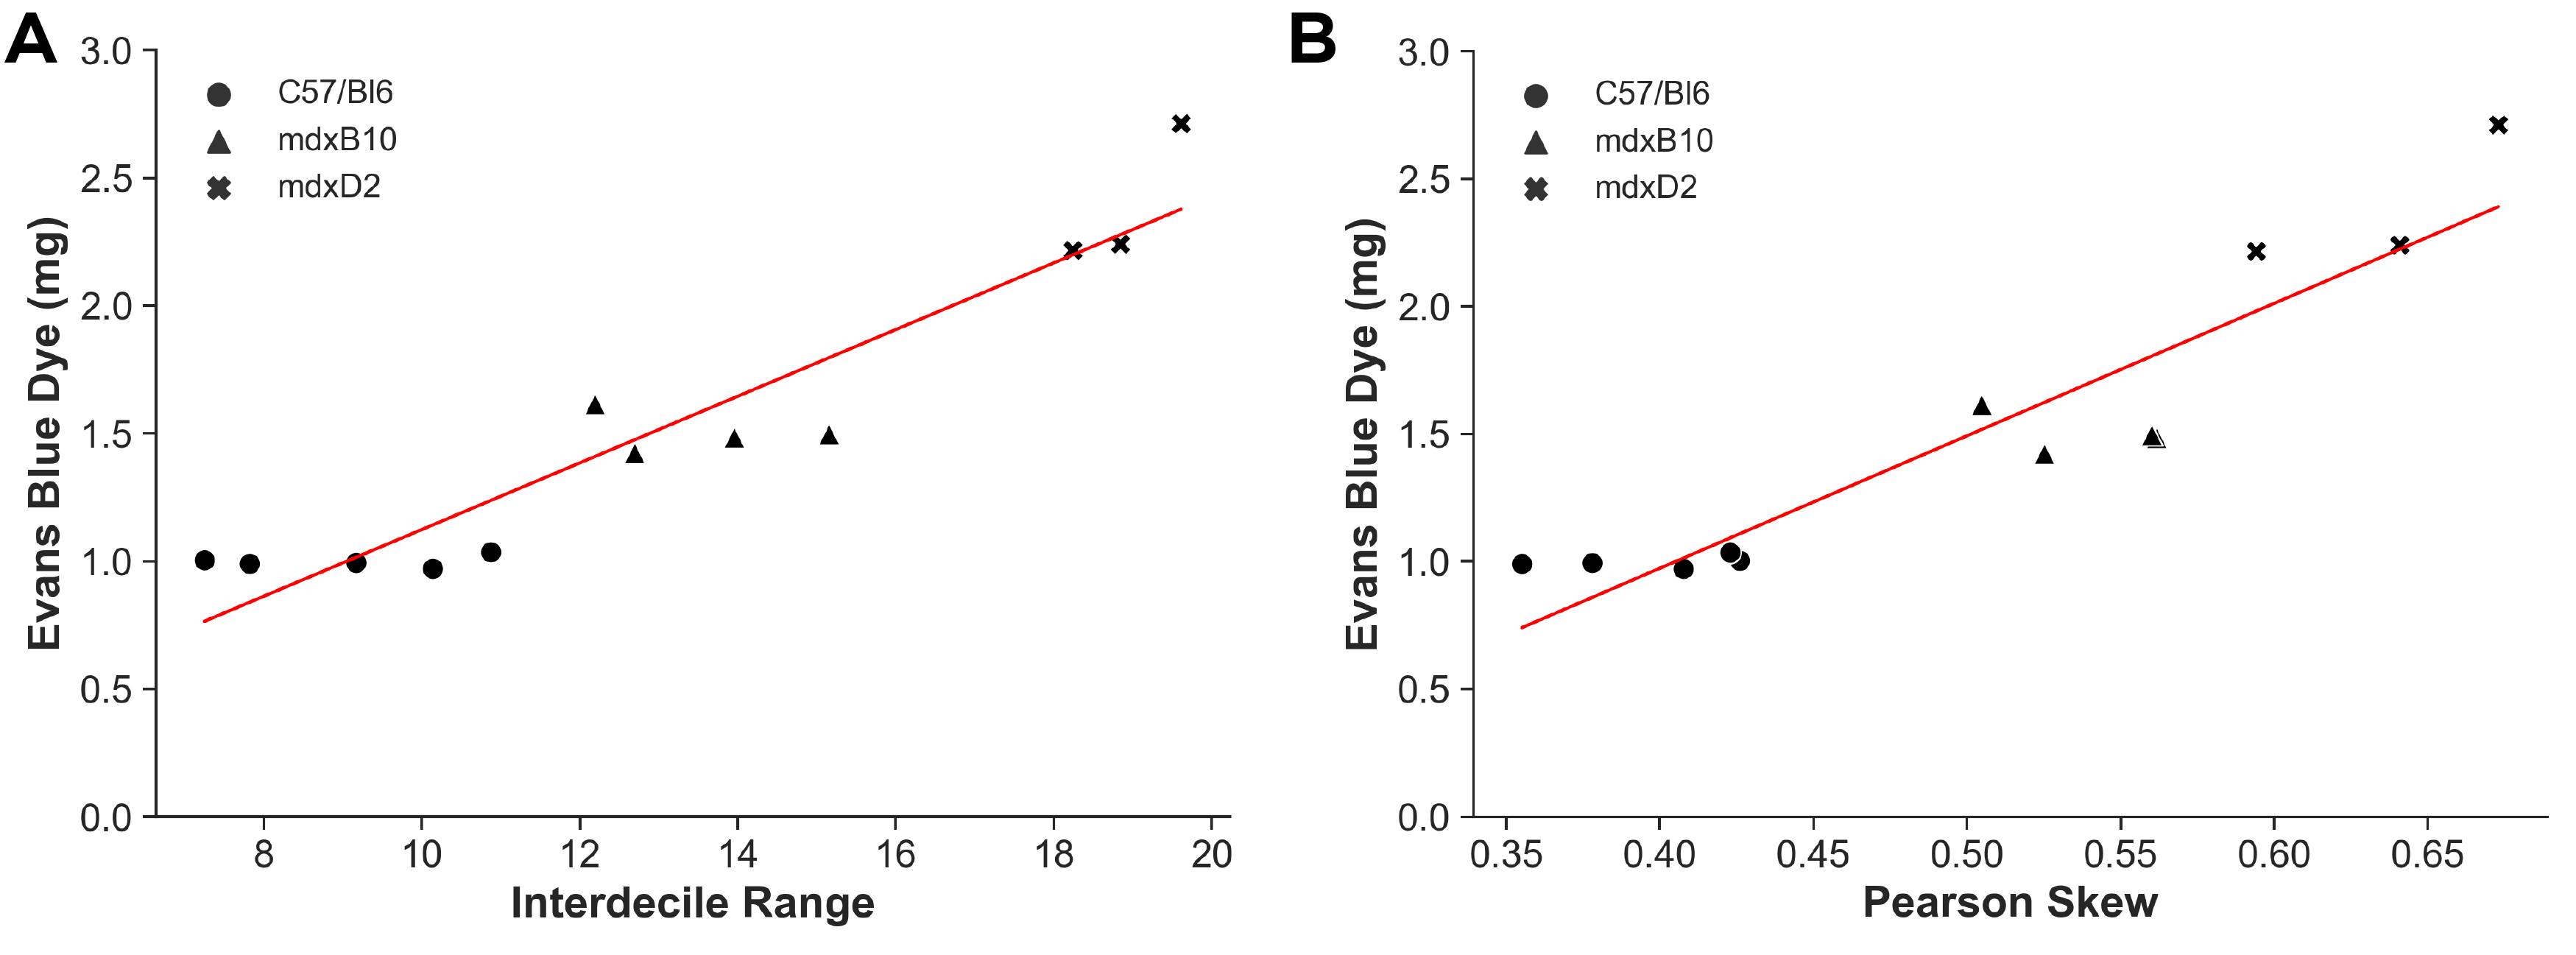
Figure 4: Strong correlation between dye uptake and MRI measures across muscle disease severity. Comparison of noninvasive in vivo image-based measurements of disease severity (skew and interdecile range) with ex vivo measurement of Evans Blue Dye, used to detect myocyte membrane damage. No muscle disease occurred in healthy WT controls (n=5), mild disease was present in mdxB10 mice (n=4), and severe disease was evident in mdxD2 mice (n=3). Both measures exhibited a strong linear correlation with the Evans Blue Dye (R2 vs IDR: 0.89; R2 vs skew: 0.86).