3952
Towards assessing the biomechanical properties of organoids/spheroids at 35 micron resolution with Magnetic Resonance Elastography1Departement of Biomedical Engineering, School of Biomedical Engineering & Imaging Sciences, King's College London, London, United Kingdom, 2INSERM UMRS1148 Laboratory for Vascular Translational Science, Paris, France, 3INSERM UMRS1148 Laboratory for Vascular Translational Science, University Paris, Paris, France
Synopsis
Keywords: Biology, Models, Methods, Elastography, organoids, high resolution
Motivation: MR-Elastography is technology that shows promises for gauging response to therapy.
Goal(s): It is hence of great interest to make this technology also available for the quantification of tissue organoids/spheroids. This enables the translation of the same imaging biomarkers to the pre-therapeutic regime.
Approach: We present a system that allows for contactless quantification of organoid biomechanics at 35micron resolution and show that gauged spheroids as small as 400mm in diameter are properly quantified in terms of shear wave speed.
Results: The concept allows to “real-word” organoid testing as they are embedded in a collagen dome with buffer solution around to enable drug exposure.
Impact: Using MRE sequence on patient derived materials to predict cancer cells response to chemotherapy, could be a lifetime saver not only for the patient but also for the clinician decision, by testing in vitro several therapies at the same time.
Introduction
MR-Elastography (MRE) has shown promises in quantifying non-invasively liver fibrosis [1] [2] [3] and recently also in gauging early response/resistance to chemotherapy for breast cancer (ISMRM 2022, #1591). It is hence of great interest to make this technology also available for the quantification of tissue organoids/spheroids. This enables the translation of the same imaging biomarkers to the pre-therapeutic regime, where patient-specific tumour samples can be exposed to different drugs for testing. Previous developments of m-MRE [5] did not address the required microenvironment for hosting spheroids/organoids that typically are embedded in small droplets of collagen, nor did they quantify the stiffness of spherical structures as small as 400 microns in diameter. Here we present such a system and show results from artificially made spheroids (agar) with known stiffness that are embedded in a droplet of collagen.METHODS
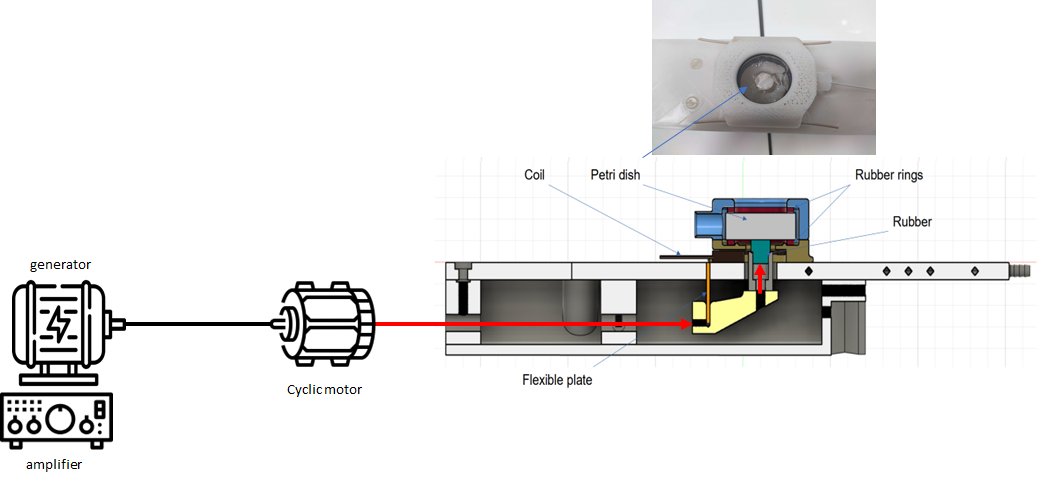
Data acquisitions was performed on a 7T MRI preclinical scanner (Bruker, Ettlingen, Germany, gradient strength 660 mT/m)., using a 20mm diameter surface coil for signal reception. Fig 1. shows the experimental setup: the longitudinal z-motion of a push-pull is translated via a cantilever system into an up-down motion which allows thereby to transmit waves into a petri-dish (Æ30mm) from its bottom using a rubber as coupling. This setup allowed for the generation of quasi-planar waves (Fig.2C) that start from the bottom of the petri dish and propagate upwards. Thereby, when performing high resolution scans with 35mm resolution in the readout-direction (i.e. the upwards direction), very small objects can properly be resolved and reconstruction of stiffness can be done in 1D using fitting of sinus-functions. The MRE sequence is a classical spin-echo sequence as described elsewhere [5], [7].For the stiffness quantification of the background medium (ultrasound gel, Anagel ®) and the artificially made organoid (3% w agar) the petri-dish was entirely filled with the corresponding medium and scanned with a normal low-resolution MRE scan in coronal orientation at 300Hz. The organoid experiments consisted of two different experimental setups: one where a ~Æ1mm agar-organoid was embedded in ultrasound gel, and a second where a ~Æ400mm agar-organoid as embedded in a droplet of collagen located at the bottom of the petri-dish which was the filled with PBS (Gibco).
RESULTS
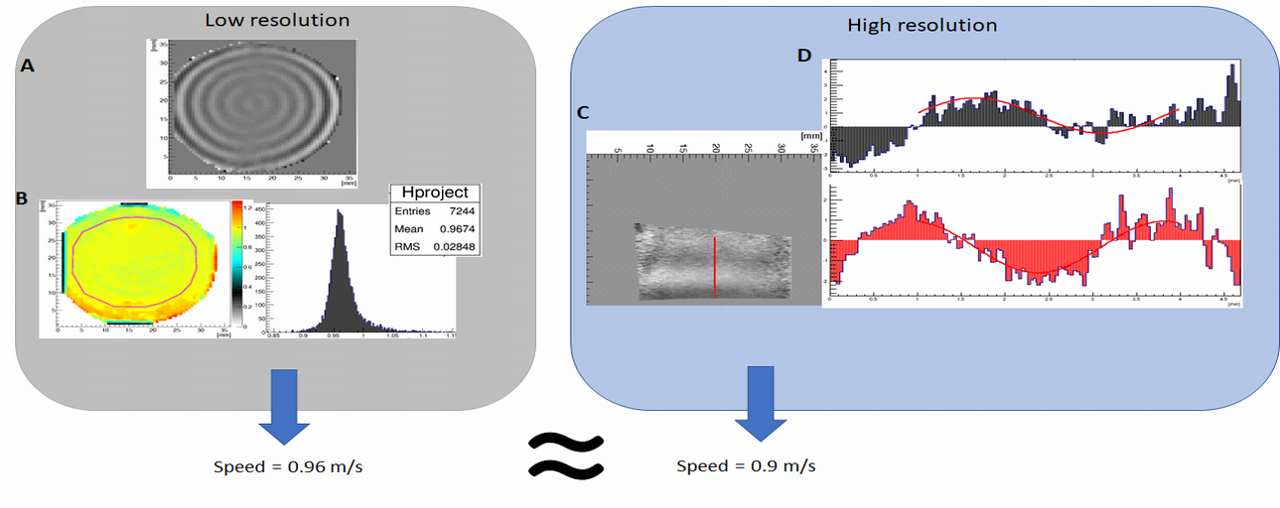
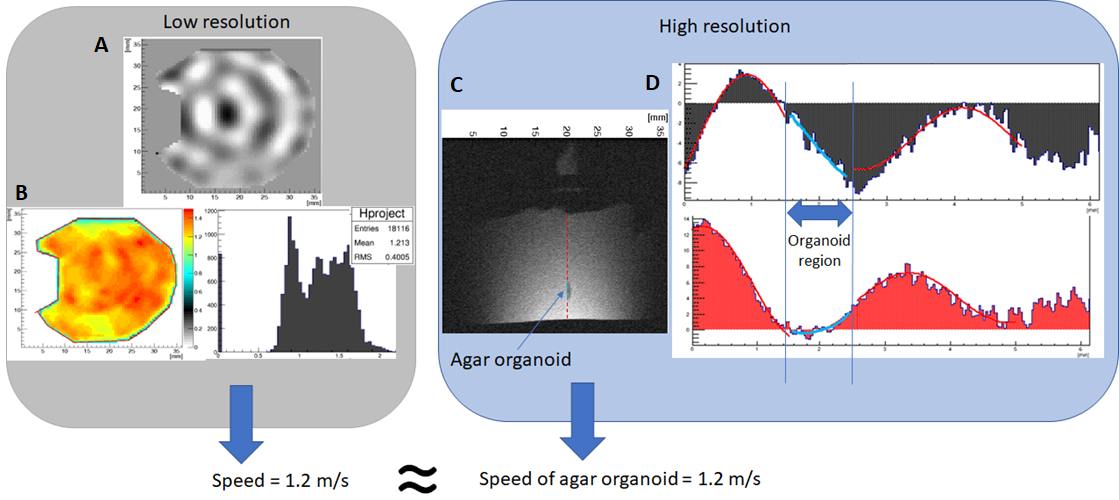
Fig.2A,B show the results of the low-resolution coronal scan for gauging the mechanical properties of the ultrasound gel: we find a shear speed of 0.96m/s. Using the high-resolution scan at 35mm in sagittal orientation and selecting the motion component that yields a plane-wave propagation upwards, we find from via a simultaneous sinus/cosinus-fit to the real/imaginary parts of that wave-component a speed of 0.9m/s, which matches very well within the RMS of 0.03.Fig.3A shows the results of the low-resolution coronal scan for gauging the mechanical properties of the agar gel: here, we find a shear speed of 1.23m/s. Fig.3B presents the agar-organoid experiment, where a spheroid made from agar was placed with the ultrasound gel. Mind that the up-down resolution of the scan is higher than the FH-resolution whereby the spheroid appears as an oval. When tracing the corresponding plane-wave upwards through the spheroid we obtain the following values: |0.92m/s | 1.36m/s | 0.9m/s | corresponding to the spatial intervals |before | within | and behind |the agar object. The values match very well within errors the expected speeds that we found in the previous gauging phase.
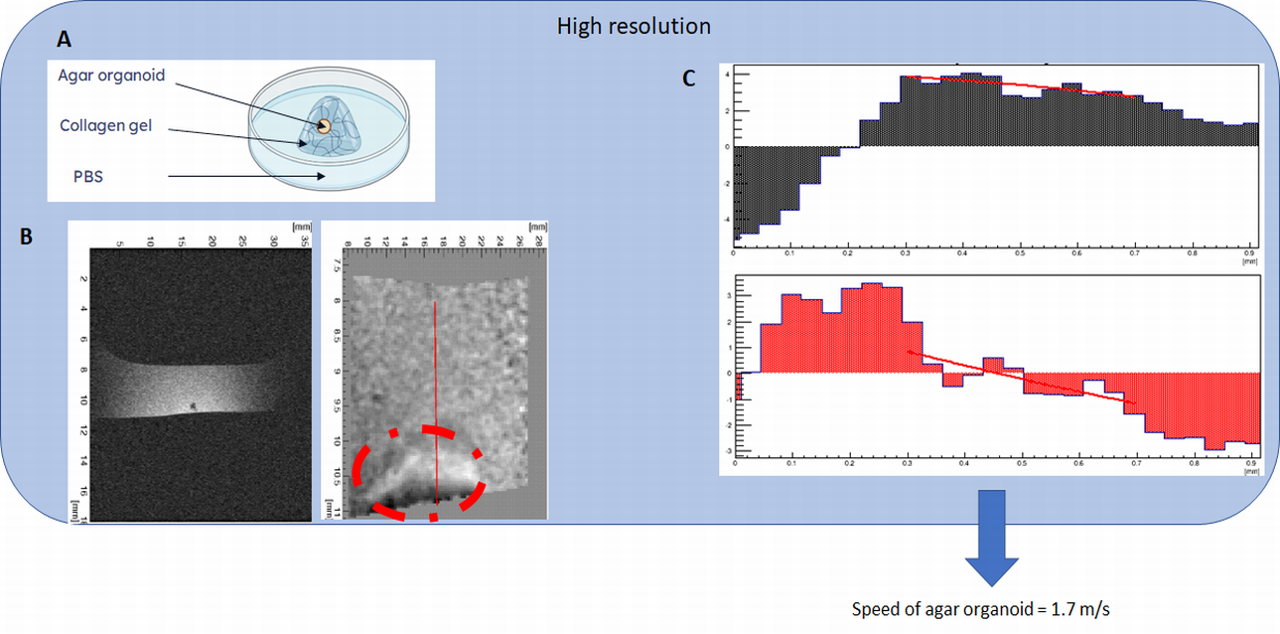
Figure 4A shows the design of the “near reality” organoid experiment: a 400mm agar-made sphere (low-resolution gauging experiments provided 1.3m/s for that agar-batch) embedded in a droplet of collagen which is surrounded by buffer solution. The corresponding high-resolution image (Fig.4B) of the upwards propagating wave shows how the shear wave vanished once hitting the liquid buffer solution, and how it is distorted due to the presence of the agar-made obstacle. The sinus/cosinus-fit yields for agar-spheroid a speed estimation of 1.7m/s, which is in good agreement with the expected value. Furthermore, we find 0.3m/s for the collagen, which matches literature values that range of 1kPa-5kPa [7] [8] [9] [10].
Conclusion
Patient-derived organoids will likely play a key role in personalized medicine, so translating promising biomarkers for drug response/resistance to this preclinical setting is crucial. We present a system for magnetic resonance elastography (MRE) on organoids embedded in collagen droplets in petri-dishes. Our approach can measure stiffness of objects as small as 400μm. The next step is to use cellular organoids to track their biomechanics under drug exposure. The ultimate goal is to observe similar stiffness changes at the organoid level as in humans, enabling the translation of imaging signatures across scales.Acknowledgements
Wellcome Leap Grant
Integrated multi-modal tissue state mapping of TNBC progression
References
[1] ‘Magnetic Resonance Elastography by Direct Visualization of Propagating Acoustic Strain Waves on JSTOR.pdf’. [2] A. Manduca et al., ‘MR elastography: Principles, guidelines, and terminology’, Magnetic Resonance in Med, vol. 85, no. 5, pp. 2377–2390, May 2021, doi: 10.1002/mrm.28627. [3] Y. K. Mariappan, K. J. Glaser, and R. L. Ehman, ‘Magnetic resonance elastography: A review’, Clin. Anat., vol. 23, no. 5, pp. 497–511, Jun. 2010, doi: 10.1002/ca.21006. [4] S. F. Othman, H. Xu, T. J. Royston, and R. L. Magin, ‘Microscopic magnetic resonance elastography (μMRE)’, Magnetic Resonance in Med, vol. 54, no. 3, pp. 605–615, Sep. 2005, doi: 10.1002/mrm.20584. [5] R. Sinkus, J. Lorenzen, D. Schrader, M. Lorenzen, M. Dargatz, and D. Holz, ‘High-resolution tensor MR elastography for breast tumour detection’, Phys. Med. Biol., vol. 45, no. 6, pp. 1649–1664, Jun. 2000, doi: 10.1088/0031-9155/45/6/317. [6] C. Guenthner, J. H. Runge, R. Sinkus, and S. Kozerke, ‘Analysis and improvement of motion encoding in magnetic resonance elastography’, NMR in Biomedicine, vol. 31, no. 5, p. e3908, May 2018, doi: 10.1002/nbm.3908. [7] R. Roy, A. L. Boskey, and L. J. Bonassar, ‘Non‐enzymatic glycation of chondrocyte‐seeded collagen gels for cartilage tissue engineering’, Journal Orthopaedic Research, vol. 26, no. 11, pp. 1434–1439, Nov. 2008, doi: 10.1002/jor.20662. [8] R. Roy, A. Boskey, and L. J. Bonassar, ‘Processing of type I collagen gels using nonenzymatic glycation’, J Biomedical Materials Res, vol. 93A, no. 3, pp. 843–851, Jun. 2010, doi: 10.1002/jbm.a.32231. [9] J. Joshi, G. Mahajan, and C. R. Kothapalli, ‘Three‐dimensional collagenous niche and azacytidine selectively promote time‐dependent cardiomyogenesis from human bone marrow‐derived MSC spheroids’, Biotech & Bioengineering, vol. 115, no. 8, pp. 2013–2026, Aug. 2018, doi: 10.1002/bit.26714. [10] B. N. Mason, A. Starchenko, R. M. Williams, L. J. Bonassar, and C. A. Reinhart-King, ‘Tuning three-dimensional collagen matrix stiffness independently of collagen concentration modulates endothelial cell behavior’, Acta Biomaterialia, vol. 9, no. 1, pp. 4635–4644, Jan. 2013, doi: 10.1016/j.actbio.2012.08.007.Figures