3951
Assessment of cardiac magnetic resonance strain parameters for early diagnosis of cirrhotic cardiomyopathy: an animal experiment1Department of Radiology, The Affiliated Hospital of Southwest Medical University, Luzhou, China, 2Clinical Science, Philips Healthcare, Chengdu, China
Synopsis
Keywords: Small Animals, Animals, cirrhosis,Cirrhotic cardiomyopathy
Motivation: As an important complication of cirrhosis, early diagnosis of cirrhotic cardiomyopathy (CCM) has a profound impact on prognosis of patients.
Goal(s): Find in myocardial strain parameters beyond global longitudinal strain (GLS) that are relevant for early diagnosis of CCM.
Approach: The heart and liver were scanned with magnetic resonance and multiple strain parameters were obtained from cardiac magnetic resonance to evaluate their potential diagnostic value for CCM and correlation with liver lesions.
Results: Compared with GLS and left ventricular ejection fraction , short-axis peak diastolic radial strain rate (PDRSR-S) has an earlier time to change, better diagnostic performance, and better correlation with liver lesions.
Impact: We discoveries a myocardial strain parameter , short-axis peak diastolic radial strain rate, who showed excellent potential in the early diagnosis of cirrhotic cardiomyopathy. The discovery laid the foundation for future research and clinical applications.
Introduction
Cirrhotic cardiomyopathy (CCM) is one of the most common complications of cirrhosis and the common causes of death in cirrhotic patients1,2 . Early diagnosis of CCM has a profound impact on the patient prognosis and treatment planning3,4. Cardiac magnetic resonance strain assessment is a promising method to monitor CCM5 . However, the rest of strain parameters other than global longitudinal strain (GLS) (e.g. PDRSR-S) have been less studied in CCM studies. Therefore, the aim of study is to explore the potential value of other myocardial strain parameters for the early assessment of CCM in the rabbit model, obtaining their diagnostic thresholds, analyzing their relationship with liver lesions.Methods
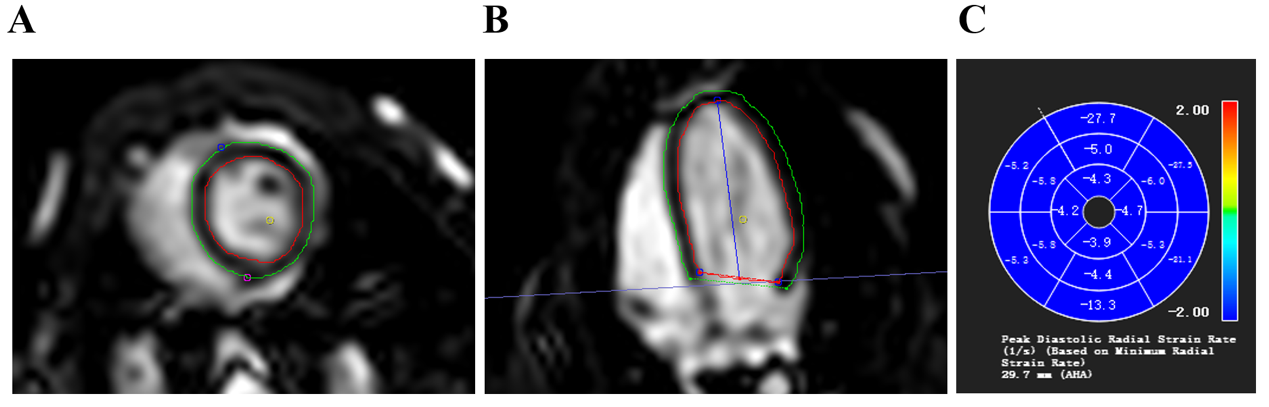
We included a total of 30 rabbits, three of which were randomly selected to be executed after the first baseline magnetic resonance scan of the heart and liver and to obtain pathologic controls for the baseline group. The remaining 27 rabbits underwent bile duct semiligation surgery6 followed by cardiac and hepatic MRI scans every two weeks until the end of week eight. 1-4 rabbits were randomly selected for execution after each scan as a reference for the pathology of each group. MRI scans were performed on a 1.5T MRI scanner (Achieva, Philips Healthcare, The Netherlands). Regarding cardiac MRI, the standard segmented steady-state free-feed cine images were obtained using the following parameters: TE =1.84ms, TR = 3.7ms, field of view = 180 × 180mm2, matrix=144×144 pixels, slice thickness = 5 mm, acquisition voxel size = 1.67 × 1.67 mm2, and reconnaissance voxel size = 1.25 × 1.25 mm2. For liver scan,the MRI proton density fat fraction was performed using a low flip-angle gradient echo sequence with the following parameters: TE=1.18ms,TR=9ms field of view = 300 × 300mm2, matrix=111 × 160,slice thickness = 3 mm, acquisition voxel size = 2.37 × 1.88 mm2, and reconnaissance voxel size = 0.94 x 0.94 mm2. 36 images that met the criteria were finally obtained.After exclusion for inclusion, we finally obtained a total of 36 images of the heart and liver from 23 rabbits with different periods of distribution. We performed region of interest (ROI) outlining in CVI software (Cvi42, version 5.12.4, circle cardiovascular imaging Inc. Calgary, Canada) and Philips post-processing software (Philips Healthcare, The Netherlands) to obtain different stages of myocardial strain, left ventricle (LV) function and partial/whole liver fat fraction (FF). The outlined image of myocardial strain was shown in Figure 1. Mixed linear models were used to compare changes in cardiac and hepatic parameters over time, receiver operating characteristic curve (ROC) is used to evaluate the strain parameters that have changed. Area under the ROC (AUC) were used to assess the diagnostic effects and thresholds for meaningful strain parameters over time. Uden index was used to determine the optimal critical value. Relationship among strain parameters, cardiac function, and liver FF were assessed by Spearman's correlation coefficient.Results
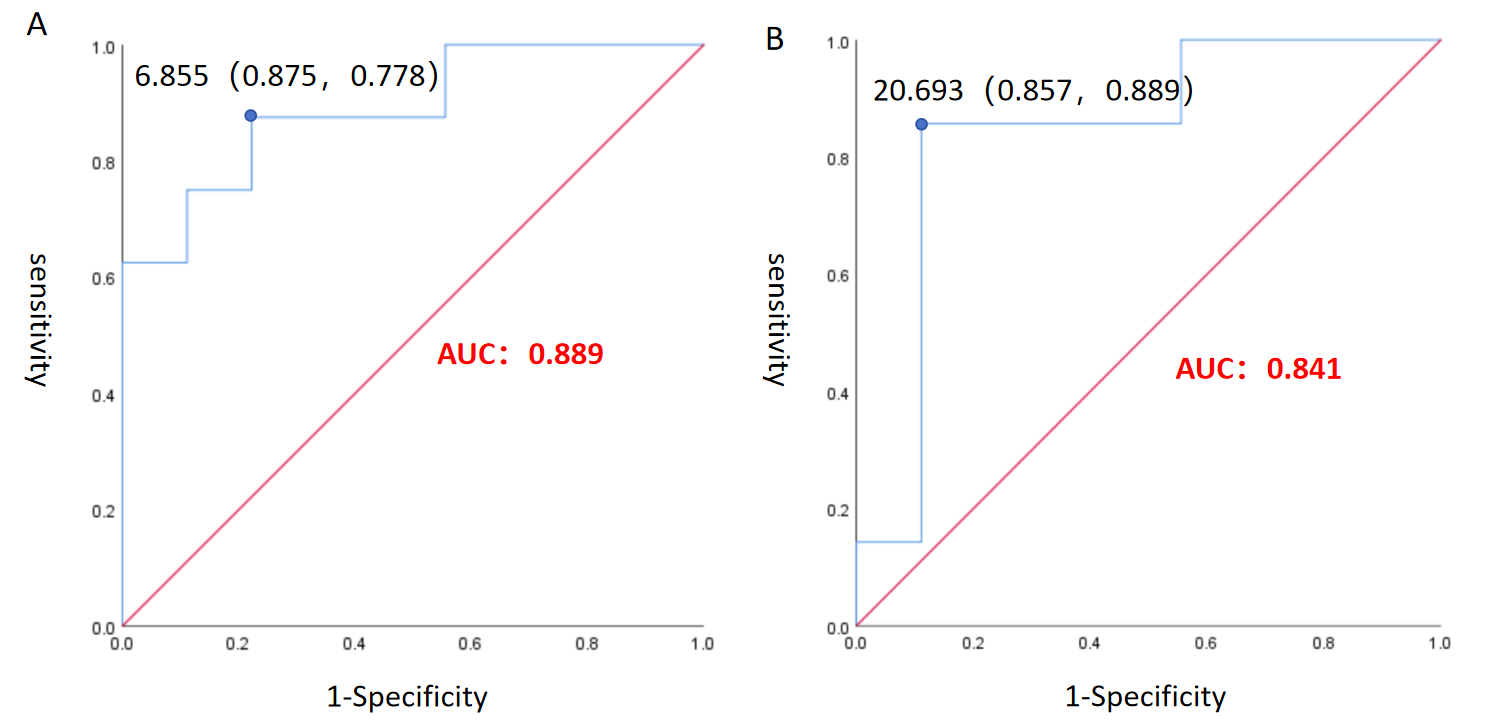
Several strain parameters changed during the observation period, with GLS ( 6th week) and PDRSR-S (4th week) having better diagnostic results at the earliest change. (Table 1)GLS had an AUC of 0.841 at 6th week with sensitivity of 85.7%, specificity of 88.9%, and critical value of 20.693. While PDRSR-S had an AUC of 0.889 at 4th week with a sensitivity of 87.5%, a specificity of 77.8%, and a critical value of 6.855. (Figure 2)
Left liver FF increased from 4th week, right/whole liver FF gradually increased from 2th week,LVEF decreased at week 8.(Table 2)
PDRSR-S showed a significant correlation with right FF (correlation coefficients -0.86) and overall FF (correlation coefficients -0.81) at 4th week,while GLS was only correlated with overall FF at 6th week (correlation coefficient = -0.86). When myocardial strain parameters change, pathology shows cardiomyocyte damage and inflammatory cell infiltration. When hepatic FF was altered, pathology showed hepatocellular necrosis, fibrous tissue proliferation, and inflammatory cell infiltration.
Discussion
Decreased cardiac exercise function is one of the early cardiac damage manifestations of cardiac lesions in cirrhotic patients5. GLS as a common strain parameter, was newly included in the diagnostic criteria for CCM in 20207. Except GLS,we found that PDRSR-S decrease at an earlier time (4th week), had a relatively good diagnostic effect and a good correlation with liver disease. This implies that PDRSR-S may have good diagnostic value in early stages of CCM and is associated with liver lesions.Conclusion
PDRSR-S not only had the ability to suggest CCM at an early stage, but also correlated with liver lesions, which indicates that PDRSR-S might be a potential strain parameter for early diagnosis of CCM.Acknowledgements
We wish to thank all the participants who kindly volunteered their time for this study.References
1. The global, regional, and national burden of cirrhosis by cause in 195 countries and territories, 1990-2017: a systematic analysis for the Global Burden of Disease Study 2017. Lancet Gastroenterol Hepatol, 2020. 5(3): p. 245-266.
2. Wang, X.J. and H. Malhi, Nonalcoholic Fatty Liver Disease. Ann Intern Med, 2018. 169(9): p. Itc65-itc80.
3. Wiese, S., et al., Cardiac dysfunction in cirrhosis: a 2-yr longitudinal follow-up study using advanced cardiac imaging. Am J Physiol Gastrointest Liver Physiol, 2019. 317(3): p. G253-g263.
4. Izzy, M., et al., Cirrhotic Cardiomyopathy Predicts Posttransplant Cardiovascular Disease: Revelations of the New Diagnostic Criteria. Liver Transpl, 2021. 27(6): p. 876-886.
5. Kim, H.M., et al., Myocardial structural and functional changes in patients with liver cirrhosis awaiting liver transplantation: a comprehensive cardiovascular magnetic resonance and echocardiographic study. J Cardiovasc Magn Reson, 2020. 22(1): p. 25.
6. Uhlig, M., et al., Cirrhotic Cardiomyopathy Following Bile Duct Ligation in Rats-A Matter of Time? Int J Mol Sci, 2023. 24(9).
7. Skouloudi, M., et al., Left atrial strain and ventricular global longitudinal strain in cirrhotic patients using the new criteria of Cirrhotic Cardiomyopathy Consortium. Liver Int, 2023.
Figures