3947
Myocardial Tissue Characterization of Acute Myocarditis in Mice: T1, T2 mapping and Extracellular Volume Fraction at 9.4T1School of Biomedical Engineering, ShanghaiTech University, Shanghai, China, 2Shanghai Clinical Research and Trial Center, Shanghai, China, 3Department of Radiology, Beijing Anzhen Hospital, Capital Medical University, Beijing, China
Synopsis
Keywords: Small Animals, Preclinical
Motivation: Myocarditis causes adverse ventricular remodeling. However, its early diagnosis and intervention measures remain to be explored.
Goal(s): Exploring quantitative CMR for monitoring myocarditis developments.
Approach: Cardiac T1, T2 and ECV mapping were performed in mice at two timepoints. Then the CMR parameters were compared between the control and myocarditis groups. The CMR results were validated against histology.
Results: Early acute phase of myocarditis was characterized by increased T2 and ECV. As time progressed, T2 was reduced to the normal level, while myocarditis native T1 and ECV were much higher than the control. The CMR findings agreed with histology.
Impact: Quantitative CMR parameters may serve as reliable indicators for edema, inflammation and fibrosis that are associated with the progression of myocarditis, and can be used for early diagnosis, monitoring and management of myocarditis.
Introduction
Chronic myocarditis can provoke ventricular remodeling, potentially progressing to dilated cardiomyopathy, leading to ventricular dilation and heart failure1–3. In the acute phase, pathological changes primarily include myocardial cell edema, necrosis, apoptosis, and inflammatory cell infiltration. Subsequent phases are characterized by myocardial fibrosis4,5. The gold standard for myocarditis diagnosis, Endomyocardial Biopsy (EMB), is invasive and not suitable for early diagnosis6. CMR has become a non-invasive tool for diagnosing various cardiac diseases. Myocardial T1 and T2 mapping have shown to be effective in detecting and monitoring acute myocarditis7. ECV is a well-established marker for detecting focal and diffuse myocardial fibrosis8. However, the precision and sensitivity of quantitative CMR T1, T2 mapping and ECV in assessing the development of acute myocarditis remain to be explored. In this study, we employed these quantitative CMR techniques to image myocarditis mice at different timepoints and then validated the CMR results with histology.Methods
After the approval of the Experimental Animal Ethics Committee, 10 male Balb/c mice with autoimmune acute myocarditis and 6 gender-, age-, and weight-matched healthy controls (HC) were included in this study. None of the mice had previously been treated with drugs. On days 7 and 28 after the induction of myocarditis, both the control and myocarditis mice underwent CMR scans. After each CMR study, 2 mice from each group were randomly selected and euthanized. The mice's hearts were dissected, and myocardial tissue was collected for histopathological analysis. The myocardial tissues were subjected to Hematoxylin and Eosin (HE), Masson, and Congo Red staining, allowing for the observation of myocardial cell edema and interstitial fibrosis in the myocardium.MR imaging
All MR acquisitions were performed on a 9.4T small animal imaging system (Bruker PharmaScan, BioSpin MRI GmbH, Ettlingen, Germany) with a 2-channel volume coil. The mice were anesthetized via inhalation and placed in a prone position for scanning. After localization scans, native T1, T2 mapping were performed at the short-axis view with three slices located at the basal, middle and apical left ventricle. For T1 mapping, we adopted an inversion recovery Look-Locker sequence9 with electrocardiography-triggered segmented fast low-angle shot readout. For T2 mapping, we adapted the multi-echo spin echo technique with electrocardiography and respiratory gating10. T1 mapping was performed with FOV=20×20mm, voxel size=0.263×0.263mm, slice thickness=1mm, flip angle=10°, echo TR/TE=3.59/1.38ms, segment number=4, segment repetition time=6000ms. T2 mapping was acquired with the same geometry parameters to T1 mapping, and other relevant parameters were: TR~=1000ms, 5 echoes with echo spacing of 5.10ms. Post-contrast T1 mapping was conducted 10 minutes after contrast agent injection with the same technique of native T1 mapping. Immediately after CMR acquisitions, blood samples were taken to measure hematocrit levels.
Image Analysis
After registration, the T1 and T2 images were fitted to the corresponding exponential models to obtain T1 and T2 maps. ECV maps were calculated with pre- and post-contrast T1 maps and corrected with hematocrit. The mean native T1, T2 and post-contrast T1, ECV were calculated in the short-axis slices and were then compared between the control and myocarditis groups using unpaired t-test.
Results
Fig. 1 displays the pathological sections of the mice heart. Compared with the control group, the acute myocarditis mice demonstrated cellular infiltration related to myocarditis and local expansion of interstitial spaces due to myocardial cell necrosis and subsequent replacement fibrosis. Noticeably, fibrosis significantly increased on day 28. Fig. 2 presents the CMR images of HC and myocarditis groups on day 14. In the acute phase of myocarditis, comparing with HC, myocardial T2 was obviously increased (24.9ms vs. 35.9ms); native T1 was unchanged (1214.6ms vs. 1234.7ms); post-contrast T1 decreased (710.7ms vs. 616ms), leading to increased ECV (0.23 vs. 0.32). Fig. 3 exhibits the mapping results of the two groups on day 28. T2 was similar between the two groups (27.6ms vs. 28.6ms), while the myocarditis mouse showed higher T1 and ECV than the control group (native T1: 1129.6ms vs. 1341.9ms; post-contrast T1: 865.7ms vs. 611.2ms; ECV: 0.21 vs. 0.37). The mean CMR parameters of all mice were compared between the HC and myocarditis mice at two timepoints in Fig. 4.Discussion
The study underscores the potential utility of CMR in detecting and monitoring the progression of myocarditis in a mouse model. It highlights significant changes in T1, T2 and ECV values during the progression of myocarditis caused by edema, inflammation and gradual deposition of fibrosis, which were evident by the histology results. It suggests that these quantitative CMR parameters could serve as key indicators in the monitoring and management of myocarditis.Acknowledgements
No acknowledgement found.References
1. Maron BJ, Zipes DP, Kovacs RJ, American Heart Association Electrocardiography and Arrhythmias Committee of Council on Clinical Cardiology, Council on Cardiovascular Disease in Young, Council on Cardiovascular and Stroke Nursing, Council on Functional Genomics and Translational Biology, and American College of Cardiology. Eligibility and Disqualification Recommendations for Competitive Athletes With Cardiovascular Abnormalities: Preamble, Principles, and General Considerations: A Scientific Statement From the American Heart Association and American College of Cardiology. Circulation. 2015;132(22):e256-261.
2. Rosier L, Zouaghi A, Barré V, et al. High Risk of Sustained Ventricular Arrhythmia Recurrence After Acute Myocarditis. J Clin Med. 2020;9(3):848.
3. Ali-Ahmed F, Dalgaard F, Al-Khatib SM. Sudden cardiac death in patients with myocarditis: Evaluation, risk stratification, and management. American Heart Journal. 2020;220:29-40.
4. Yajima T, Knowlton KU. Viral myocarditis: from the perspective of the virus. Circulation. 2009;119(19):2615-2624.
5. Maisch B. Cardio-Immunology of Myocarditis: Focus on Immune Mechanisms and Treatment Options. Front Cardiovasc Med. 2019;6:48.
6. Caforio ALP, Pankuweit S, Arbustini E, et al. Current state of knowledge on aetiology, diagnosis, management, and therapy of myocarditis: a position statement of the European Society of Cardiology Working Group on Myocardial and Pericardial Diseases. Eur Heart J. 2013;34(33):2636-2648, 2648a-2648d.
7. Haaf P, Garg P, Messroghli DR, Broadbent DA, Greenwood JP, Plein S. Cardiac T1 Mapping and Extracellular Volume (ECV) in clinical practice: a comprehensive review. J Cardiovasc Magn Reson. 2016;18:89.
8. Lurz JA, Luecke C, Lang D, et al. CMR–Derived Extracellular Volume Fraction as a Marker for Myocardial Fibrosis: The Importance of Coexisting Myocardial Inflammation. JACC: Cardiovascular Imaging. 2018;11(1):38-45.
9. Messroghli DR, Nordmeyer S, Buehrer M, et al. Small animal Look-Locker inversion recovery (SALLI) for simultaneous generation of cardiac T1 maps and cine and inversion recovery-prepared images at high heart rates: initial experience. Radiology. 2011;261(1):258-265.
10. Chen Y, Li W, Jiang K, Wang CY, Yu X. Rapid T2 mapping of mouse heart using the carr-purcell-meiboom-gill sequence and compressed sensing reconstruction. J Magn Reson Imaging. 2016;44(2):375-382.
Figures
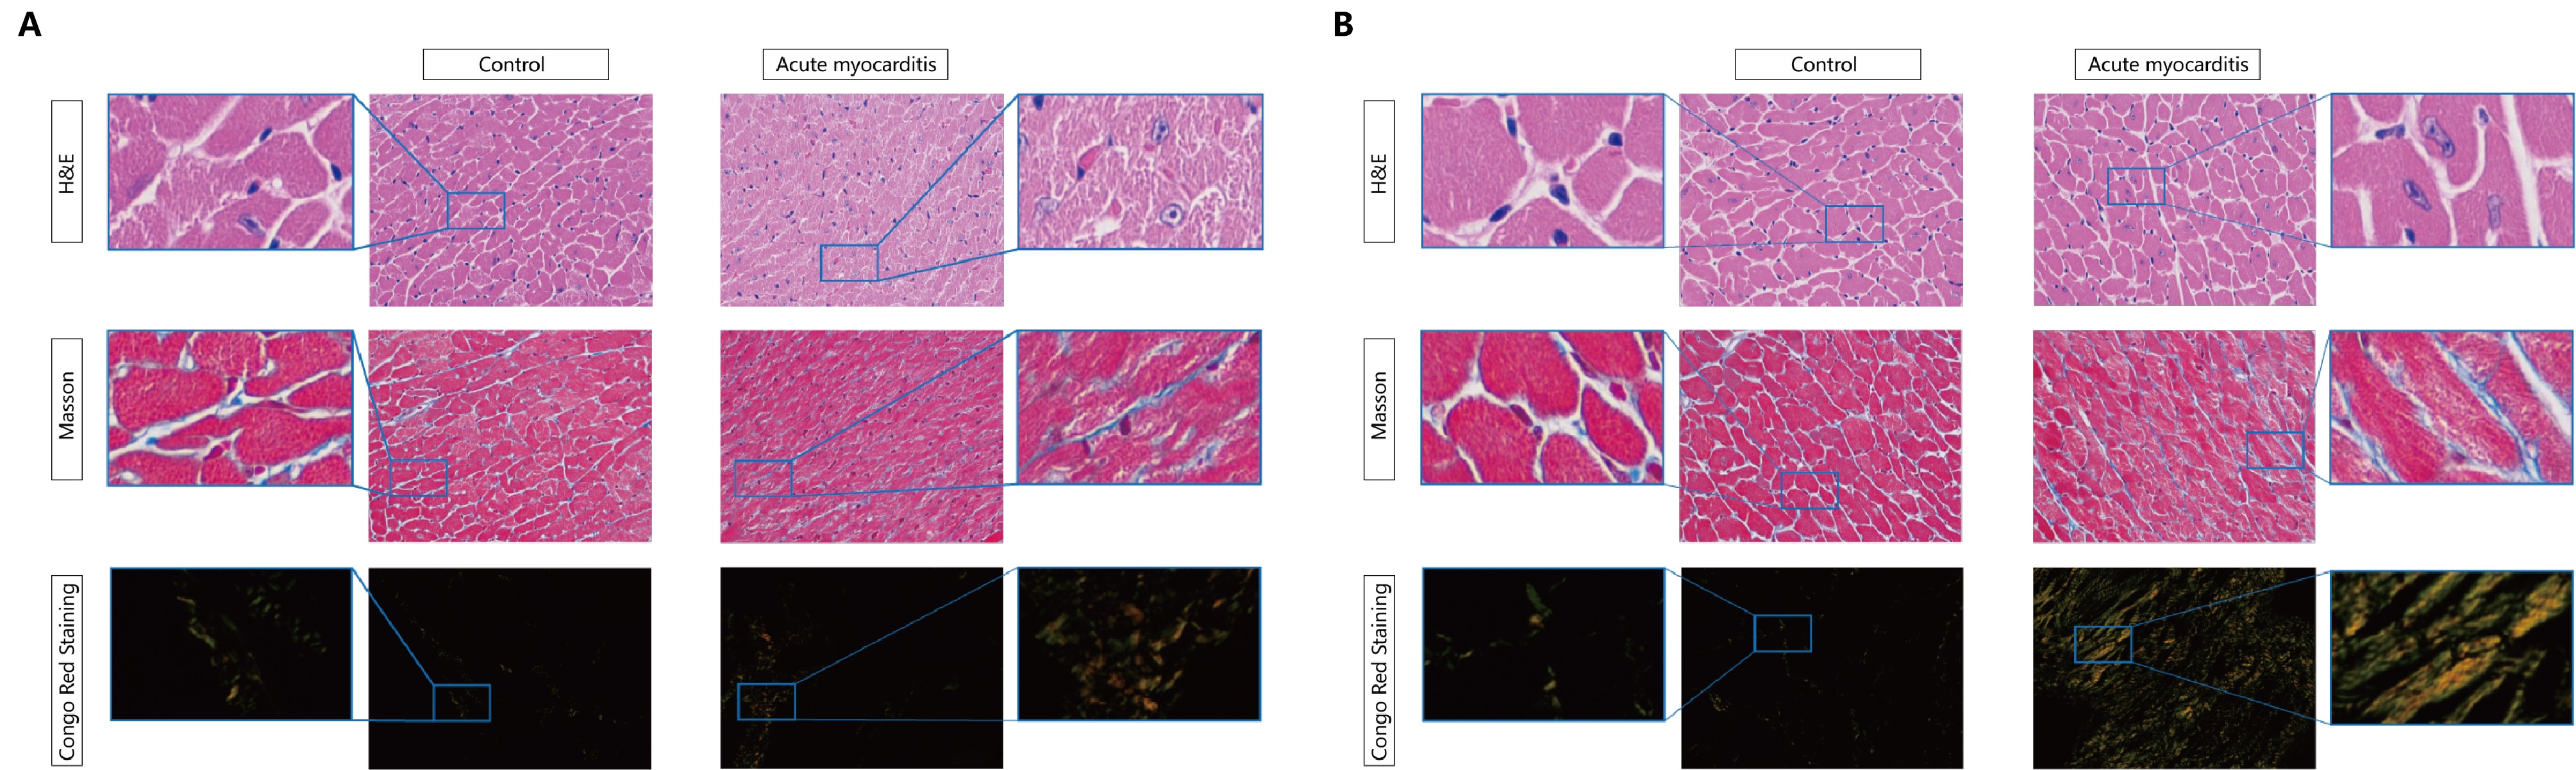
Fig. 1 Histopathological results of health control and myocarditis mice at 14 days (A) and 28 days (B) after the induction of myocarditis. From top to bottom rows is respectively HE, Masson, and Congo Red staining, used to observe the degree of myocardial cell edema and the area of myocardial interstitial fibrosis.
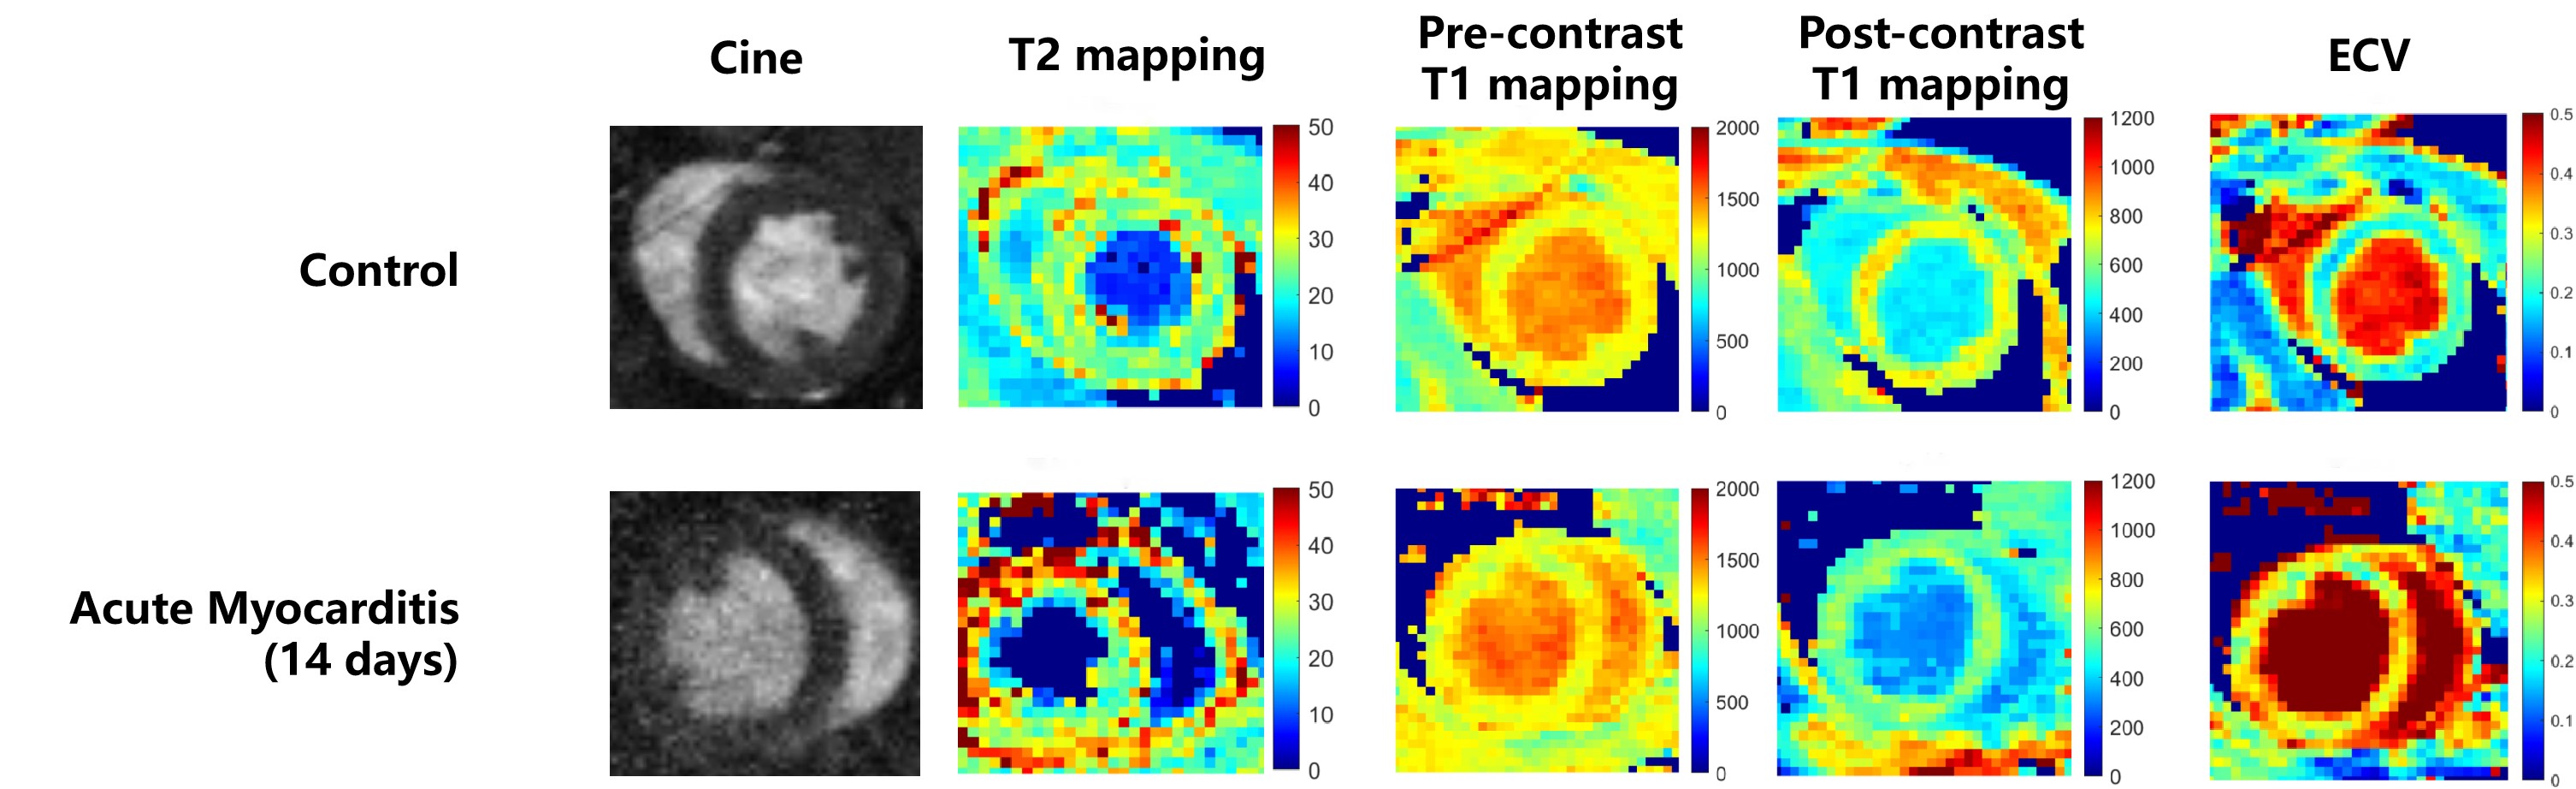
Fig. 2 Cardiac cine, T2 mapping, pre- and post-contrast T1 mapping, and ECV maps acquired by the 14-day CMR examination of mice from control and myocarditis groups. In myocarditis mice, T2 and ECV were elevated, while there was no discernable difference in native T1 mapping between the two groups.
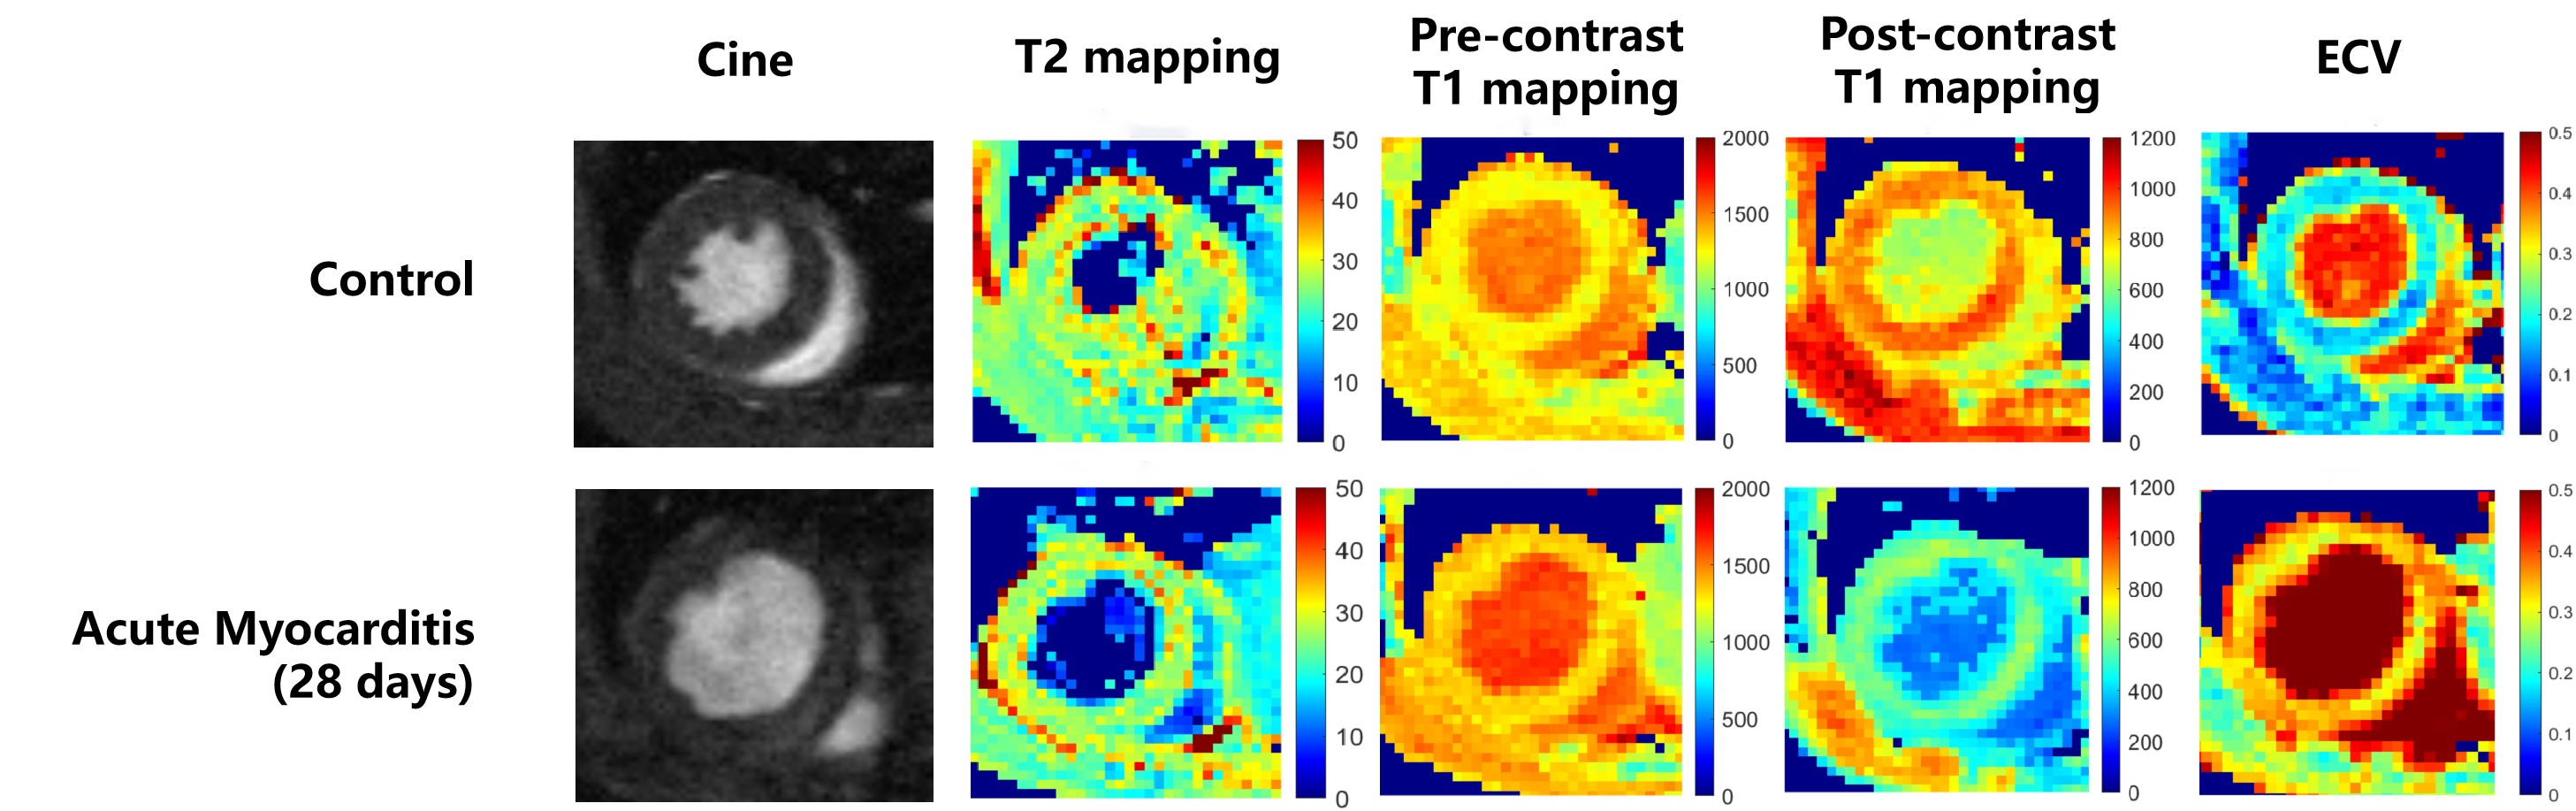
Fig. 3 Cardiac cine, T2 mapping, pre- and post-contrast T1 mapping, and ECV maps acquired by the 28-day CMR examination of mice from control and myocarditis groups. In myocarditis mice, T2 was decreased to levels close to the control group, while native T1 and ECV were significantly increased.
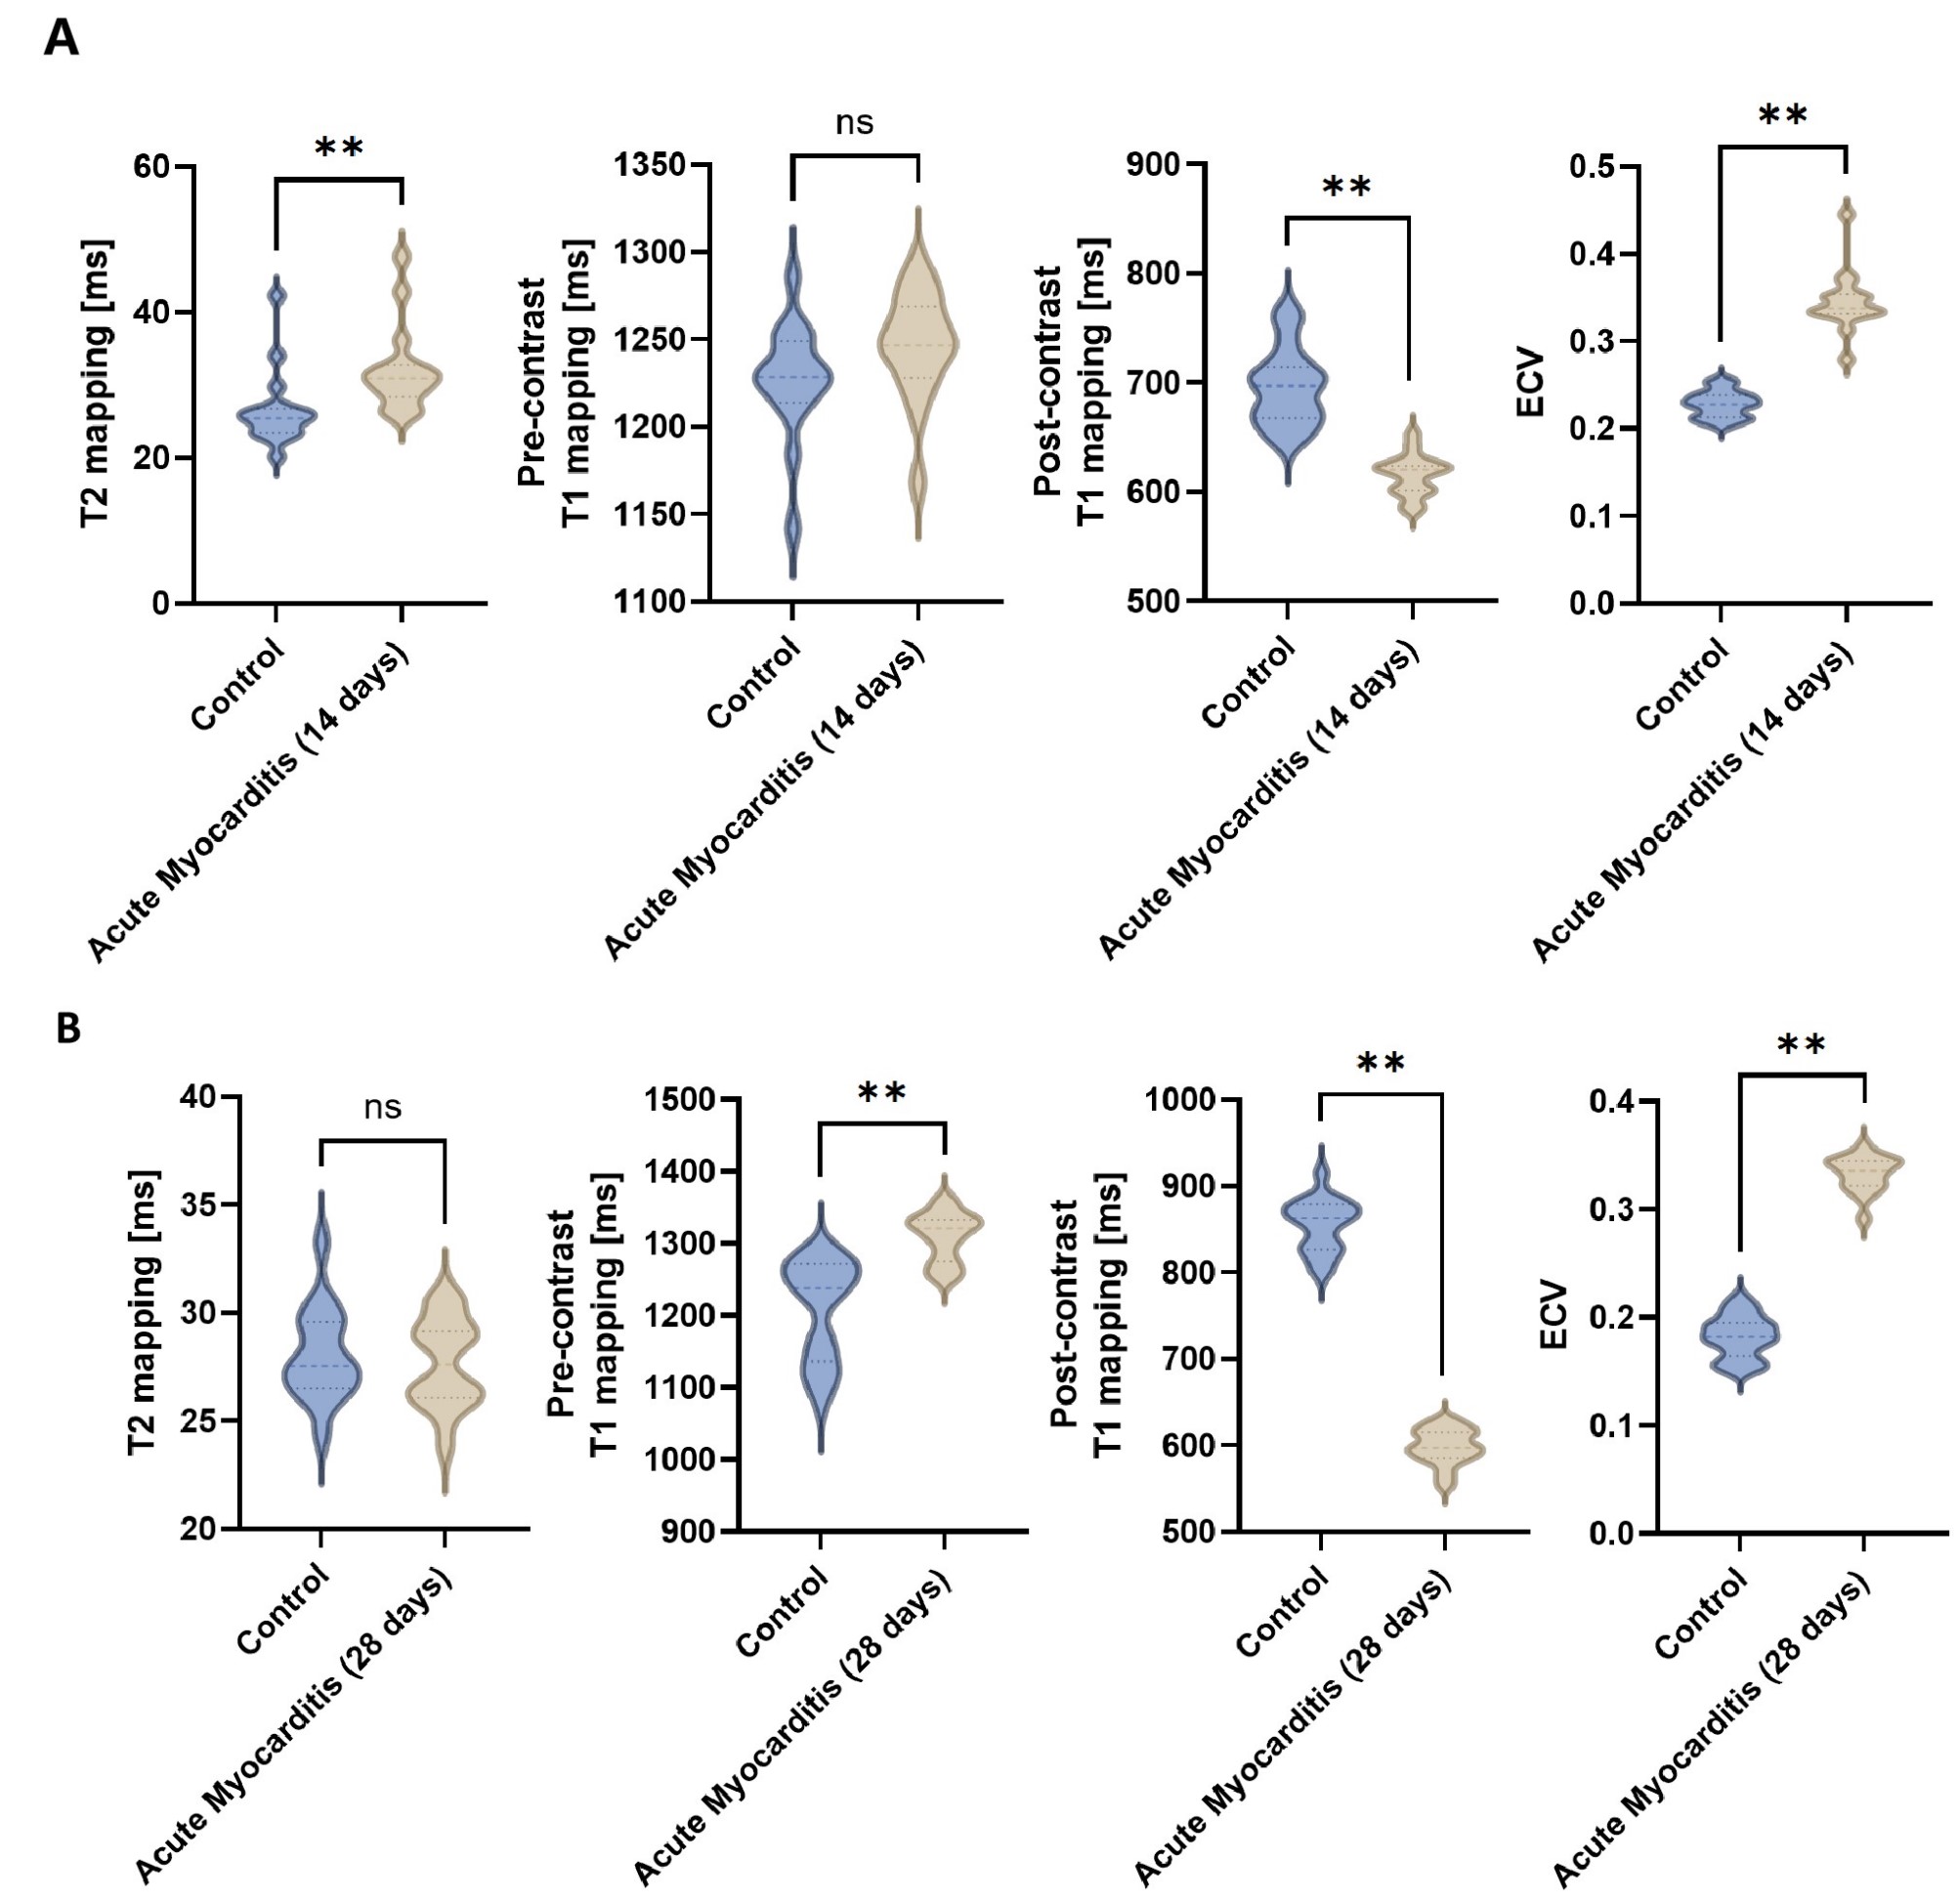
Fig. 4 Comparison of CMR parameters of control and myocarditis mice at 14 days (A) and 28 days (B) after myocarditis. ns indicates no significant difference. ** indicates p<0.01.