3946
Biomechanical properties and multiparametric MRI to identify microstructural dynamics in a non-alcoholic steatohepatitis mouse model1Department of Radiology, Charité – Universitätsmedizin Berlin, Berlin, Germany, 2Department of Veterinary Medicine, Freie Universität Berlin, Berlin, Germany, 3iPATH Berlin Core Unit, Charité – Universitätsmedizin Berlin, Berlin, Germany, 4Institute of Medical Informatics, Charité – Universitätsmedizin Berlin, Berlin, Germany
Synopsis
Keywords: Biology, Models, Methods, Elastography, Preclinical, Steatohepatitis, Murine model, Viscoelasticity, Water diffusion, Fat content
Motivation: The relationship between the microstructural changes and the imaging-based biophysical properties of the liver as NASH progresses are not fully established.
Goal(s): We aim to identify quantitative imaging markers that can provide valuable insights into the microstructural progression of NASH.
Approach: We established non-alcoholic steatohepatitis in mice with a defined amino-acid high-fat diet. We performed MRI, MR elastography and histological scoring with automated fat segmentation at different times during the course of NASH.
Results: Our results shed light on liver viscosity and water diffusivity as potential quantitative markers of steatohepatitis progression in mice.
Impact: This study highlights the role of multiparametric-MRI, MR elastography and histopathology to reveal the dynamics of microstructural changes of non-alcoholic steatohepatitis in a mouse model using a clinical scanner. We identify liver viscosity and water diffusivity as reliable quantitative markers.
Introduction
MR elastography (MRE) can non-invasively quantify shear-wave speed (SWS) as a surrogate for stiffness and penetration rate (PR) as a surrogate for viscosity(1,2). In addition to multiparametric MRI (mp-MRI) and histology, MRE allows the biophysical assessment of non-alcoholic steatohepatitis (NASH)(3-6). In this study, we aim to investigate how microstructural changes affect the imaging-based biophysical properties of the liver as NASH progresses. Liver fibrosis and steatosis have been shown to cause liver stiffening(7) and reduced ADC(8) in patients. Therefore, we hypothesize that hepatic biomechanical properties and water diffusivity may serve as markers of NASH progression.Methods
C57BL/6 mice were fed an amino-acid-defined, high-fat diet (CDAHFD) for 12 days (t1, N=10), 21 days (t2, N=10), 83 days (t3, N=9), and 120 days (t4, N=8), including a control group (t0, N=8)(3). Mice were measured using a 3T clinical MRI scanner (Magnetom Lumina, Siemens, Germany) and a mouse coil (Rapid Biomedical GmbH, Germany) (Figure 1). Twenty axial T2w images (resolution: 0.25x0.25x1.2mm³, TR=2500ms, TE=77ms) were acquired. The fat content was quantified using a 2-point DIXON method in 20 axial images (TE1=2.46ms, TE2=3.69ms, TR=5.6ms, 1 mm3 isotropic resolution). SE-EPI MRE was performed using two coupled piezo actuators (APA200, Cedrat Technologies, France) generating vibrations at 300, 400, and 500 Hz (wave field, resolution:1x1x1.2mm³). Ten slices of diffusion-weighted images (DWI) were acquired (resolution: 1x1x2.4mm³) with three b-values (50, 400, and 800s/mm²). MRE magnitude images were interpolated based on rigid registration to T2w images as reference(9). Maps of SWS and PR (both in m/s) were reconstructed using the k-MDEV algorithm(2). Ex vivo liver specimens were stained with eosin and hematoxylin (H&E) to obtain NAFLD activity score (NAS), lobular inflammation score, macrophage infiltration score, and histopathologic features of fat accumulation(10). The size and number of the fat droplets were quantified from H&E slides using a segmentation algorithm.Results
NASH progressed gradually over time. Little or no fibrosis was quantified at t4. Figure 2 shows the parameter maps, while the corresponding boxplots and histologic scores are summarized in Figure 3. No significant changes in SWS were observed (p=0.47). PR increased with disease progression (+32.6%, p<0.001). The fat percentage increased to 30% from t0 to t2 then decreased by 38.6% from t2 to t4. These measurements align with quantitative fat scoring from H&E slides (30.1% increase from t0 to t2 followed by a 40.1% decrease from t2 to t4, p<0.01). NAS and inflammation scores increased (Figure 3). The significant correlations were: PR vs. lobular inflammation score: R=0.64, p<0.0001, and ADC vs. NAS: R=-0.53, p<0.001. Quantitative histology showed a decrease in fat droplet number and an increase in their radius, suggesting an evolution of the droplet structure: (t1: ⌀=15.1±5.5, n°droplets=724±53, t4: ⌀=27±5.6, n°droplets=470±42, p<0.01). A decrease in ADC occurred from t0 to t1, coinciding with an increase in fat percentage, lobular inflammation scores, and higher macrophage infiltration. From t2 and t3, PR decreased, associated with reduced fat percentage, larger fat droplet diameter, and higher lobular inflammation scores.Discussion
Our findings show that CDAHFD intake induced early-onset hepatic inflammation associated with fat accumulation. The inflammation appeared lobular and involved the infiltration of macrophages into the extracellular matrix. No change in liver stiffness was observed, probably due to the absence of fibrosis. In contrast, viscosity decreased significantly at t3, which was associated with lobular inflammation and changes in the structure of fat droplets such as decreased quantity but increased size. Hepatic ADC decreased as NASH progressed, especially at t1, which could relate to increased fat content. Furthermore, livers with larger fat droplets and reduced macrophage infiltration had higher ADC values. We hypothesize that in NASH, fat droplets become larger due to the coalescence of smaller fat vacuoles, forming new distribution patterns that may impede water diffusion. In addition, macrophage infiltration may contribute to this obstructive effect, resulting in decreased ADC and decreased overall liver viscosity. Taken together, water diffusivity and viscosity may serve as biomarkers for the progression of steatohepatitis in the liver. The CDAHFD-induced NASH model allows a comprehensive examination of the relationship between in-vivo biophysical imaging parameters and microstructural changes associated with steatohepatitis progression. Metabolic analyses are ongoing to further investigate the cascade of NASH in vivo before the manifestation of fibrosis.Conclusion
Our study demonstrated that mp-MRI combined with MRE on a clinical scanner can detect microstructural changes associated with NASH progression in the mouse liver. Measurements of viscosity and water diffusivity proved valuable in quantifying changes associated with progression of lobular inflammation and changes in fat content and structure.Acknowledgements
This work was supported by the Deutsche Forschungsgemeinschaft (GRK2260, BIOQIC, SFB1340 Matrix-In-Vision)References
1. Venkatesh SK, Yin M, Ehman RL. Magnetic resonance elastography of liver: clinical applications. J Comput Assist Tomogr 2013;37(6):887-896.
2. Tzschätzsch H, Ipek-Ugay S, Guo J, Streitberger KJ, Gentz E, Fischer T, Klaua R, Schultz M, Braun J, Sack I. In vivo time-harmonic multifrequency elastography of the human liver. Phys Med Biol 2014;59(7):1641-1654.
3. Waghorn PA, Ferreira DS, Erstad DJ, Rotile NJ, Masia R, Jones CM, Tu C, Sojoodi M, Chen YI, Schlerman F, Wellen J, Martinez RVP, Tanabe KK, Fuchs BC, Caravan P. Quantitative, noninvasive MRI characterization of disease progression in a mouse model of non-alcoholic steatohepatitis. Sci Rep 2021;11(1):6105.
4. Hudert CA, Tzschätzsch H, Rudolph B, Bläker H, Loddenkemper C, Müller H-P, Henning S, Bufler P, Hamm B, Braun J. Tomoelastography for the evaluation of pediatric nonalcoholic fatty liver disease. Investigative Radiology 2019;54(4):198-203.
5. Yin M, Glaser KJ, Manduca A, Mounajjed T, Malhi H, Simonetto DA, Wang R, Yang L, Mao SA, Glorioso JM. Distinguishing between hepatic inflammation and fibrosis with MR elastography. Radiology 2017;284(3):694-705.
6. Salameh N, Larrat B, Abarca-Quinones J, Pallu S, Dorvillius M, Leclercq I, Fink M, Sinkus R, Van Beers BE. Early detection of steatohepatitis in fatty rat liver by using MR elastography. Radiology 2009;253(1):90-97.
7. Reiter R, Tzschätzsch H, Schwahofer F, Haas M, Bayerl C, Muche M, Klatt D, Majumdar S, Uyanik M, Hamm B, Braun J, Sack I, Asbach P. Diagnostic performance of tomoelastography of the liver and spleen for staging hepatic fibrosis. Eur Radiol 2020;30(3):1719-1729.
8. Anderson SW, Soto JA, Milch HN, Ozonoff A, O'Brien M, Hamilton JA, Jara HJ. Effect of disease progression on liver apparent diffusion coefficient values in a murine model of NASH at 11.7 Tesla MRI. Journal of Magnetic Resonance Imaging 2011;33(4):882-888.
9. Klein S, Staring M, Murphy K, Viergever MA, Pluim JP. Elastix: a toolbox for intensity-based medical image registration. IEEE transactions on medical imaging 2009;29(1):196-205.
10. Kleiner DE, Brunt EM. Nonalcoholic fatty liver disease: pathologic patterns and biopsy evaluation in clinical research. 2012. Thieme Medical Publishers. p 003-013.
Figures
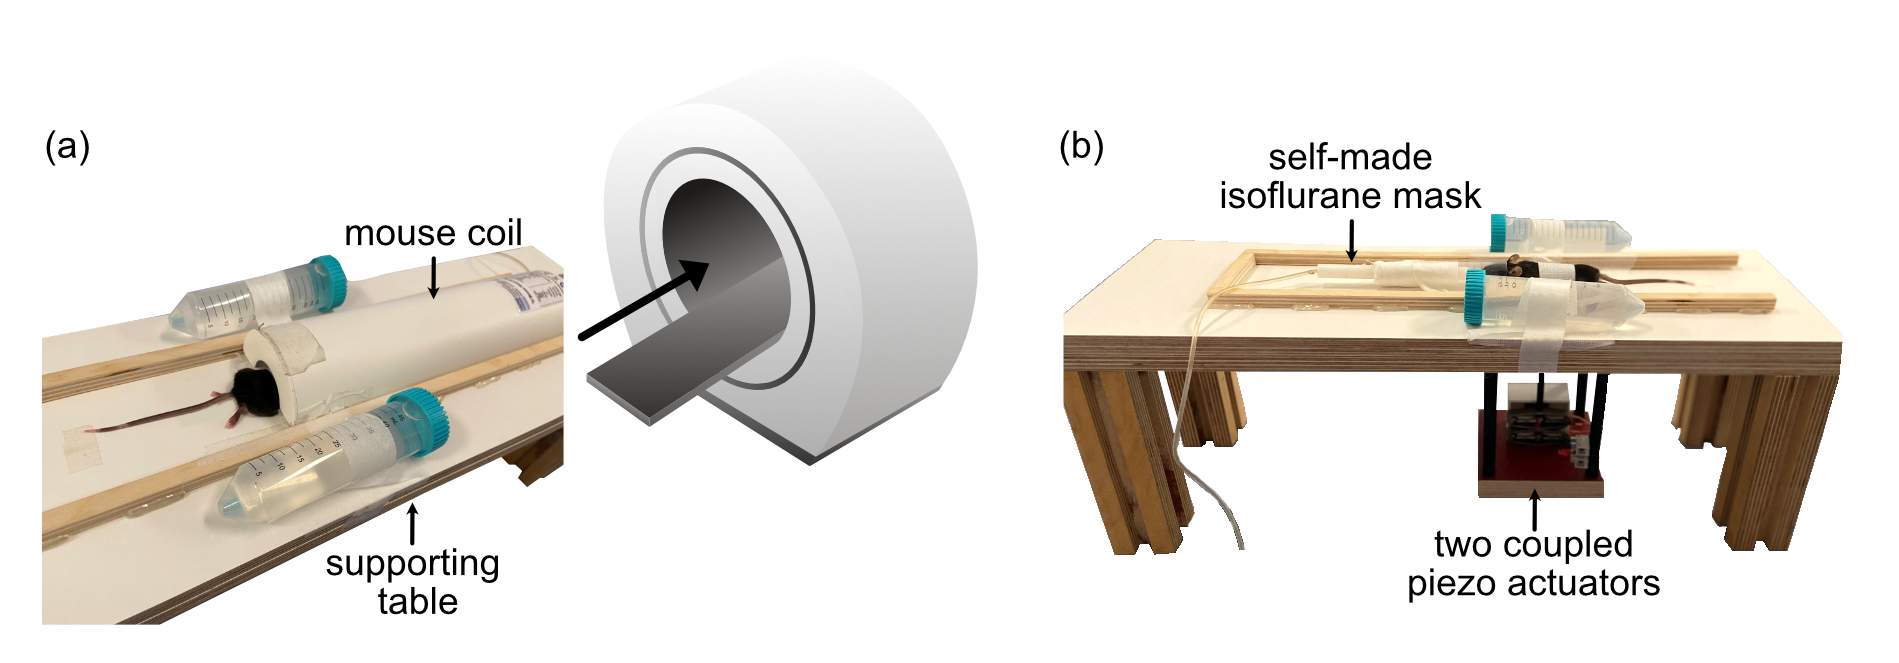
Figure 1: Experimental setup: (a) shows the mouse positioned under the mouse coil on the supporting table. (b) shows the mouse connected to the sedation device and positioned on the piezo-actuators.
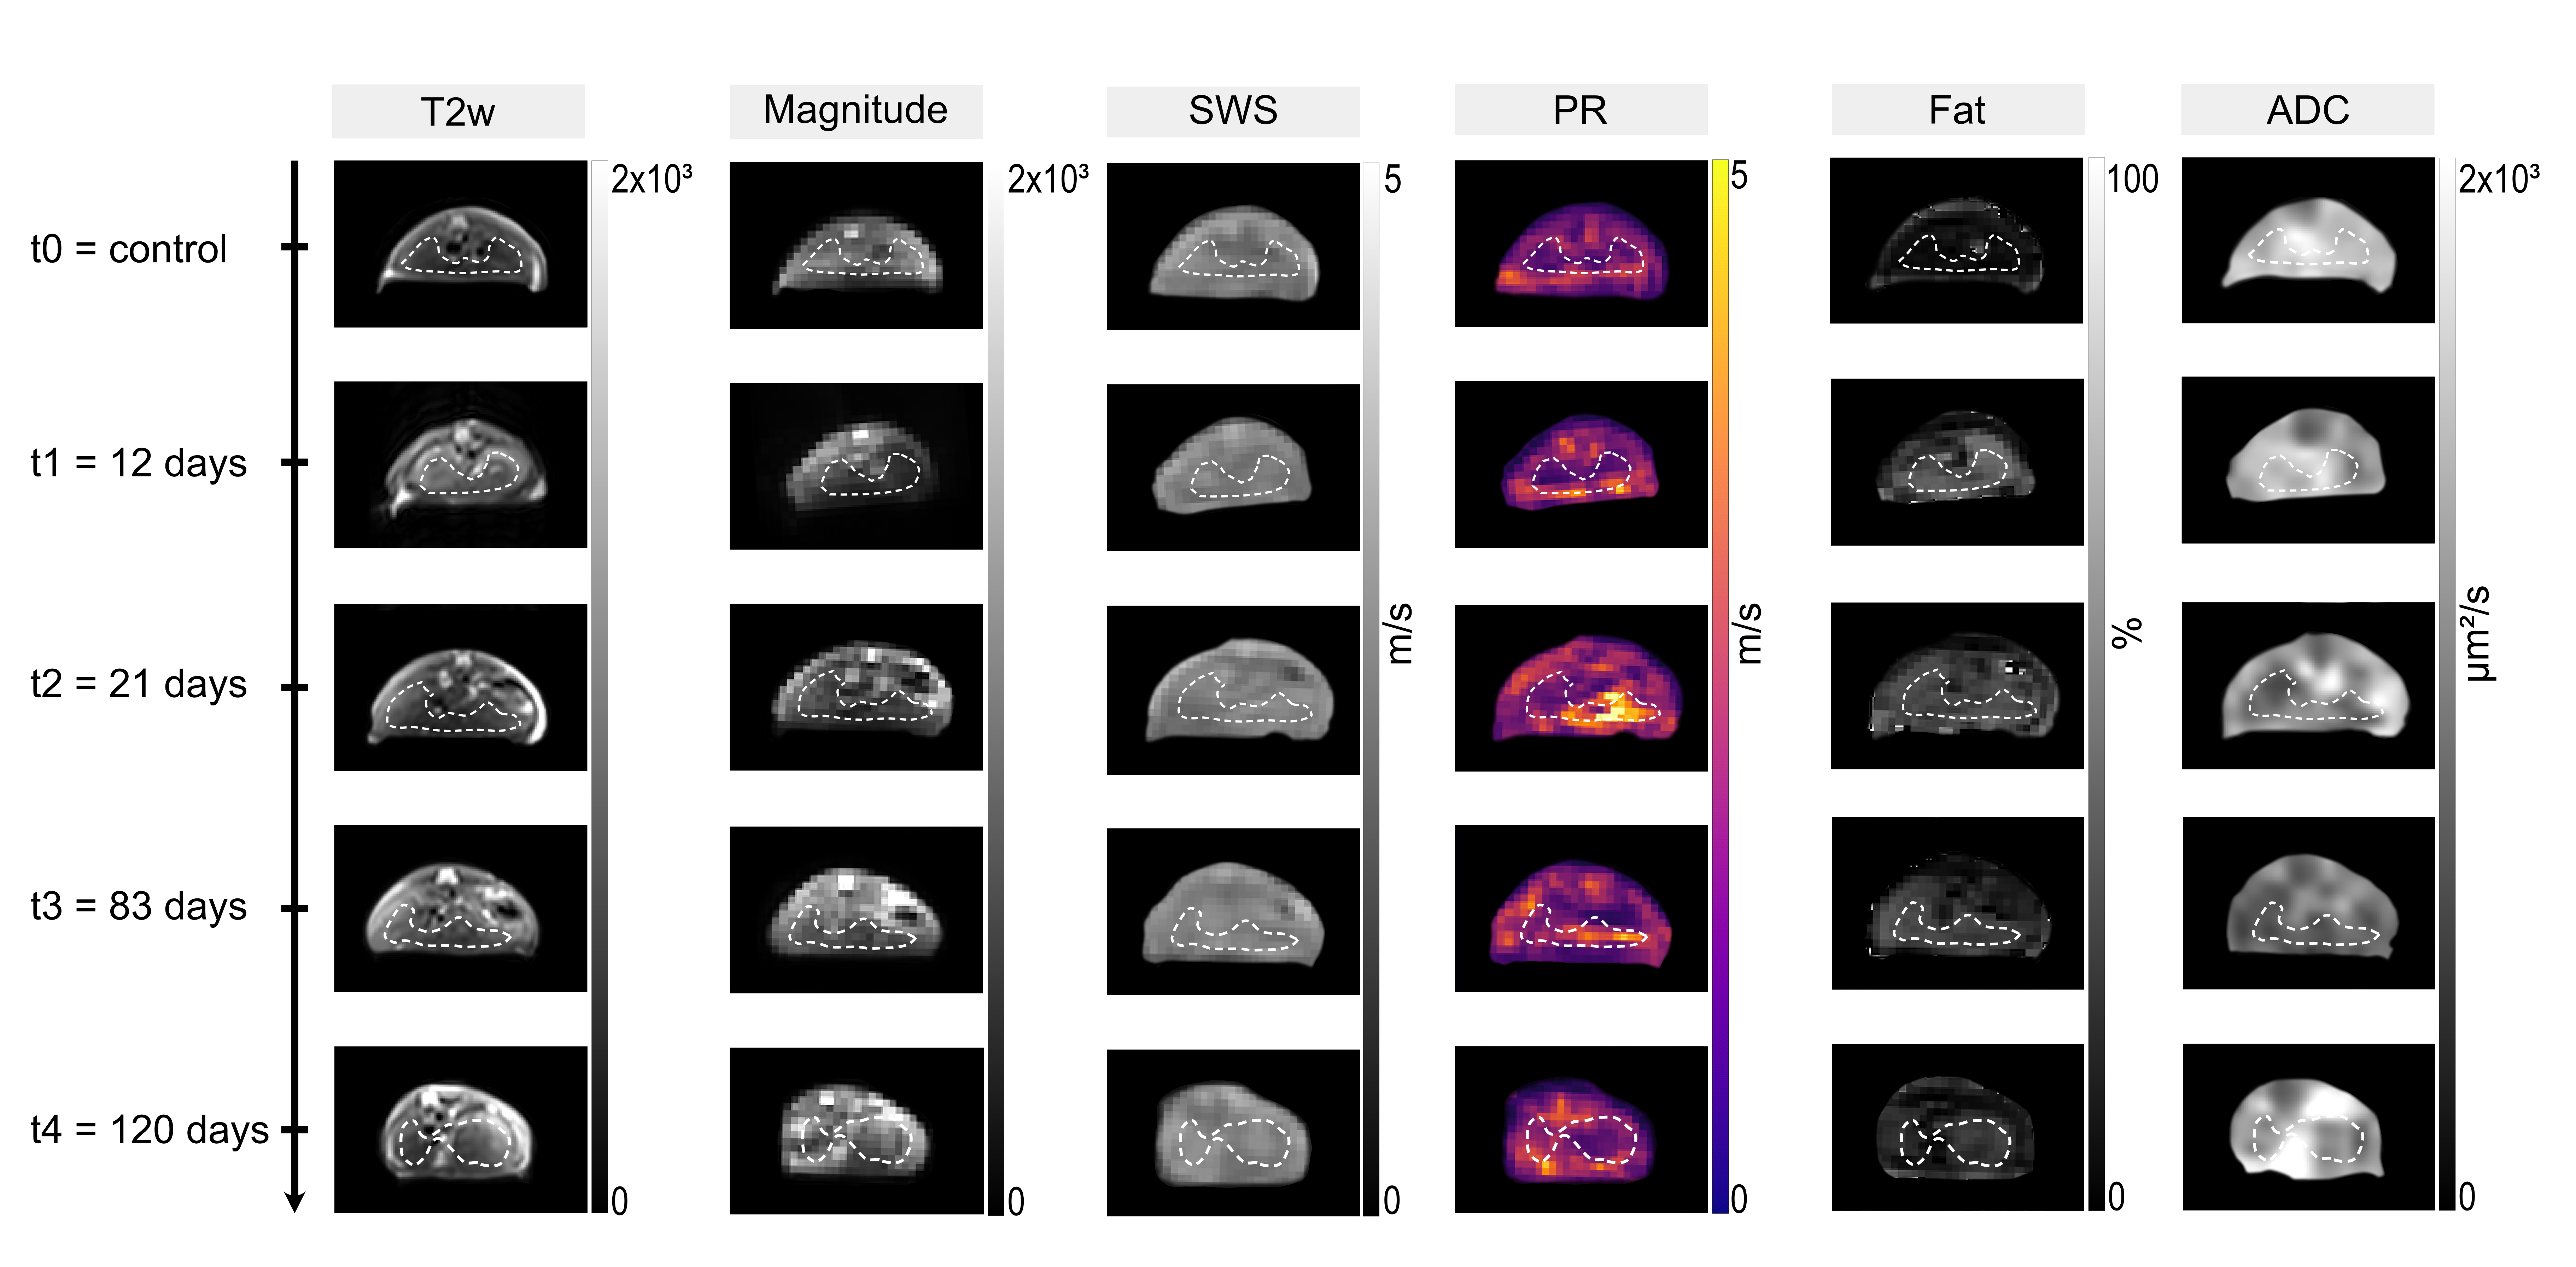
Figure 2: T2w images, MRE magnitude, shear wave speed (SWS) and penetration rate (PR) maps, fat percentage (Fat) and apparent diffusion coefficient (ADC) maps acquired at progressive experimental time points.
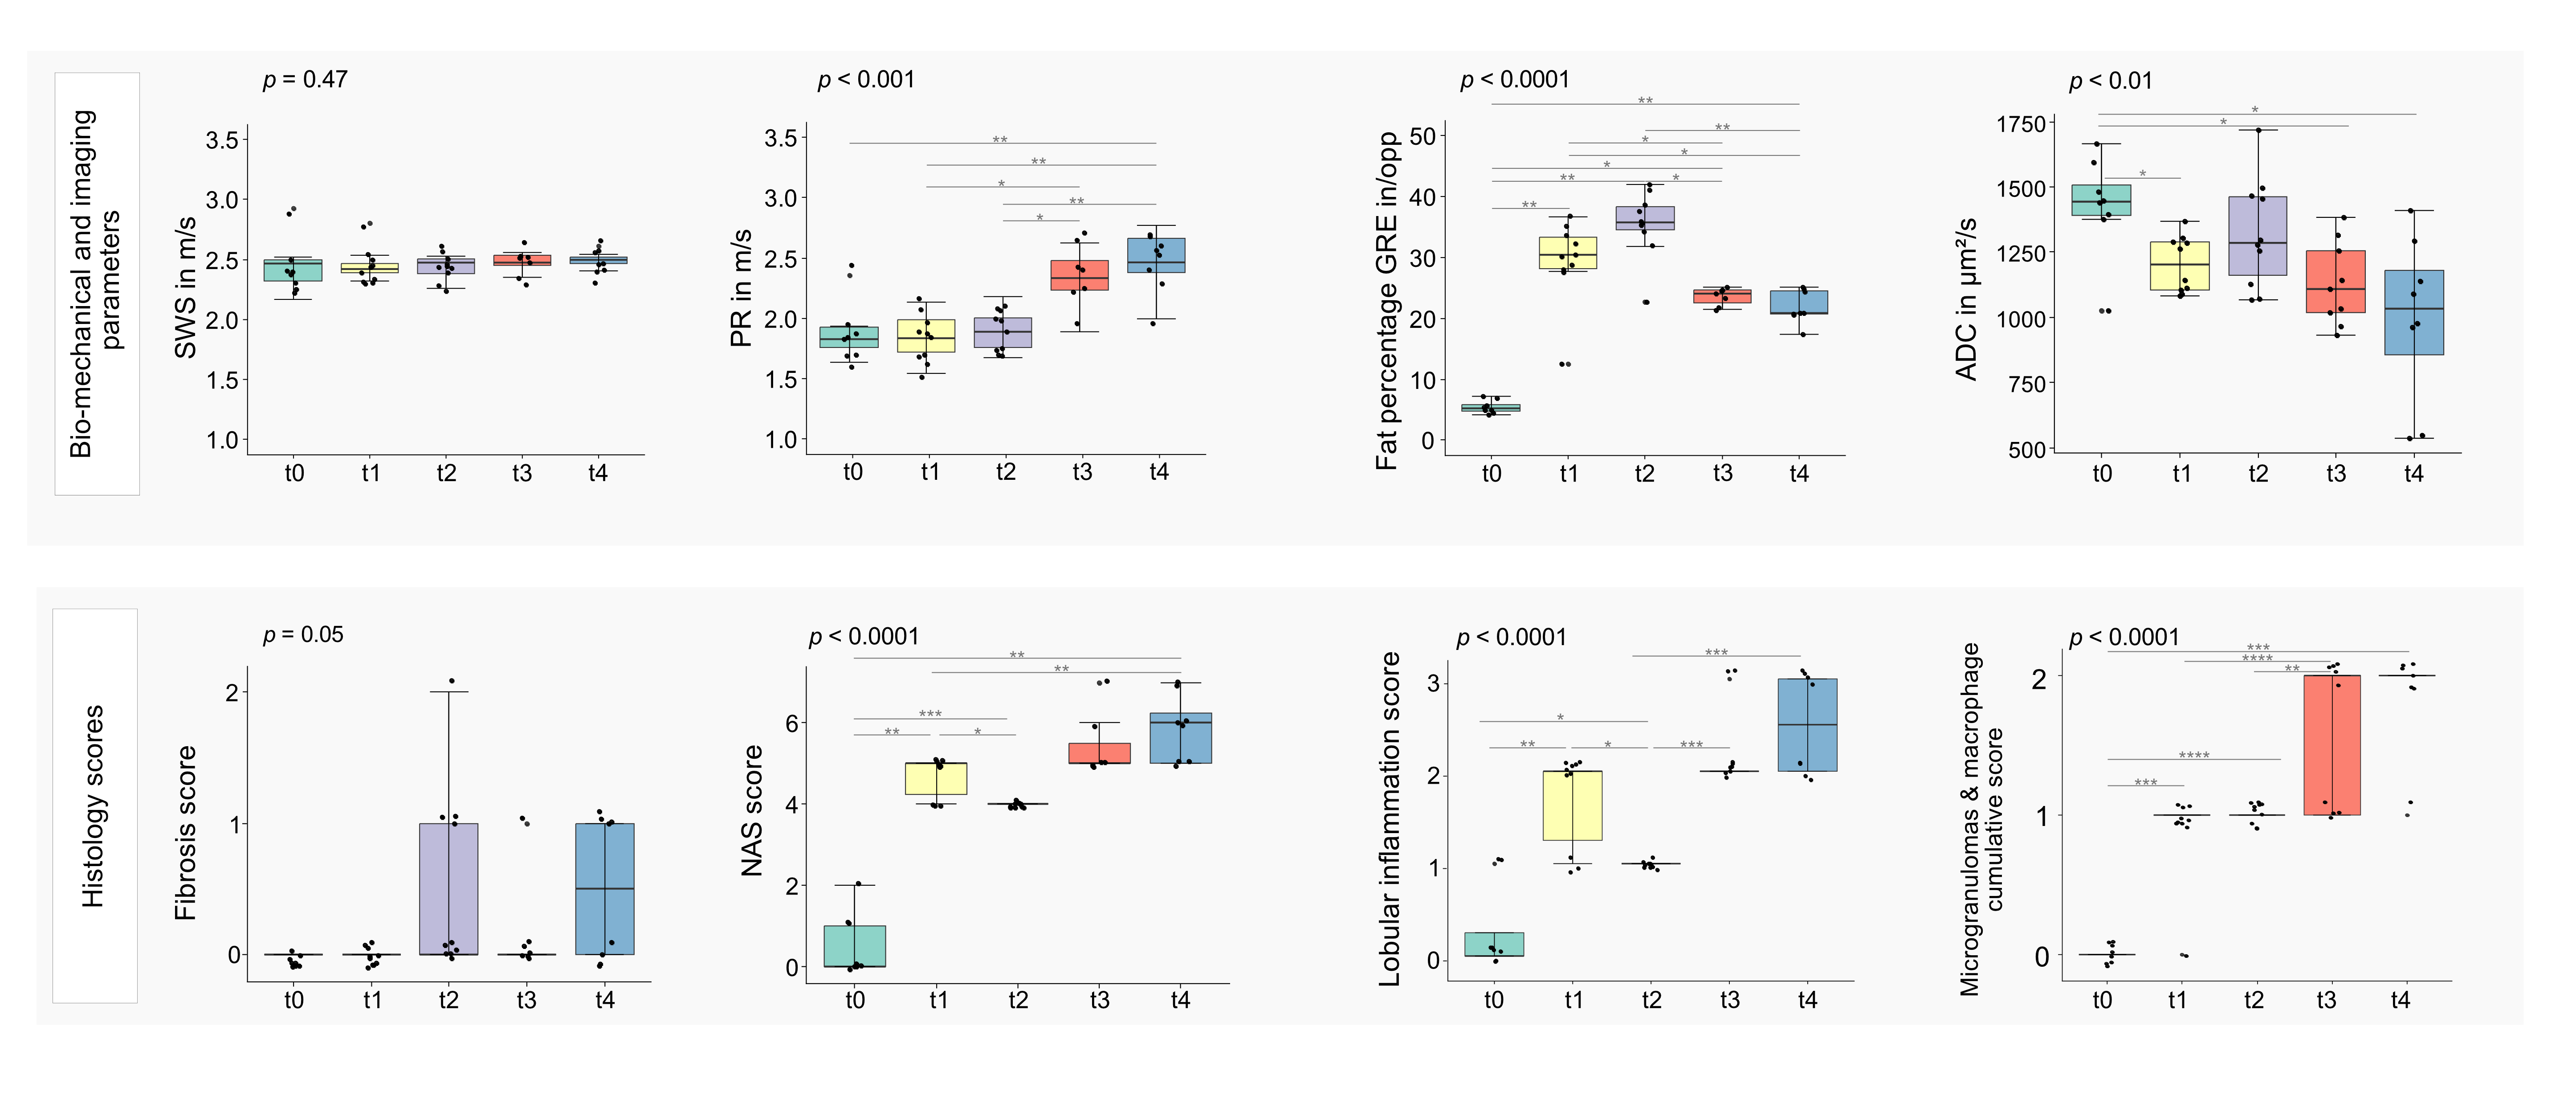
Figure 3: First row: boxplots of the measured imaging and biomechanical parameters. Second row: Histologic scores based on H&E staining.
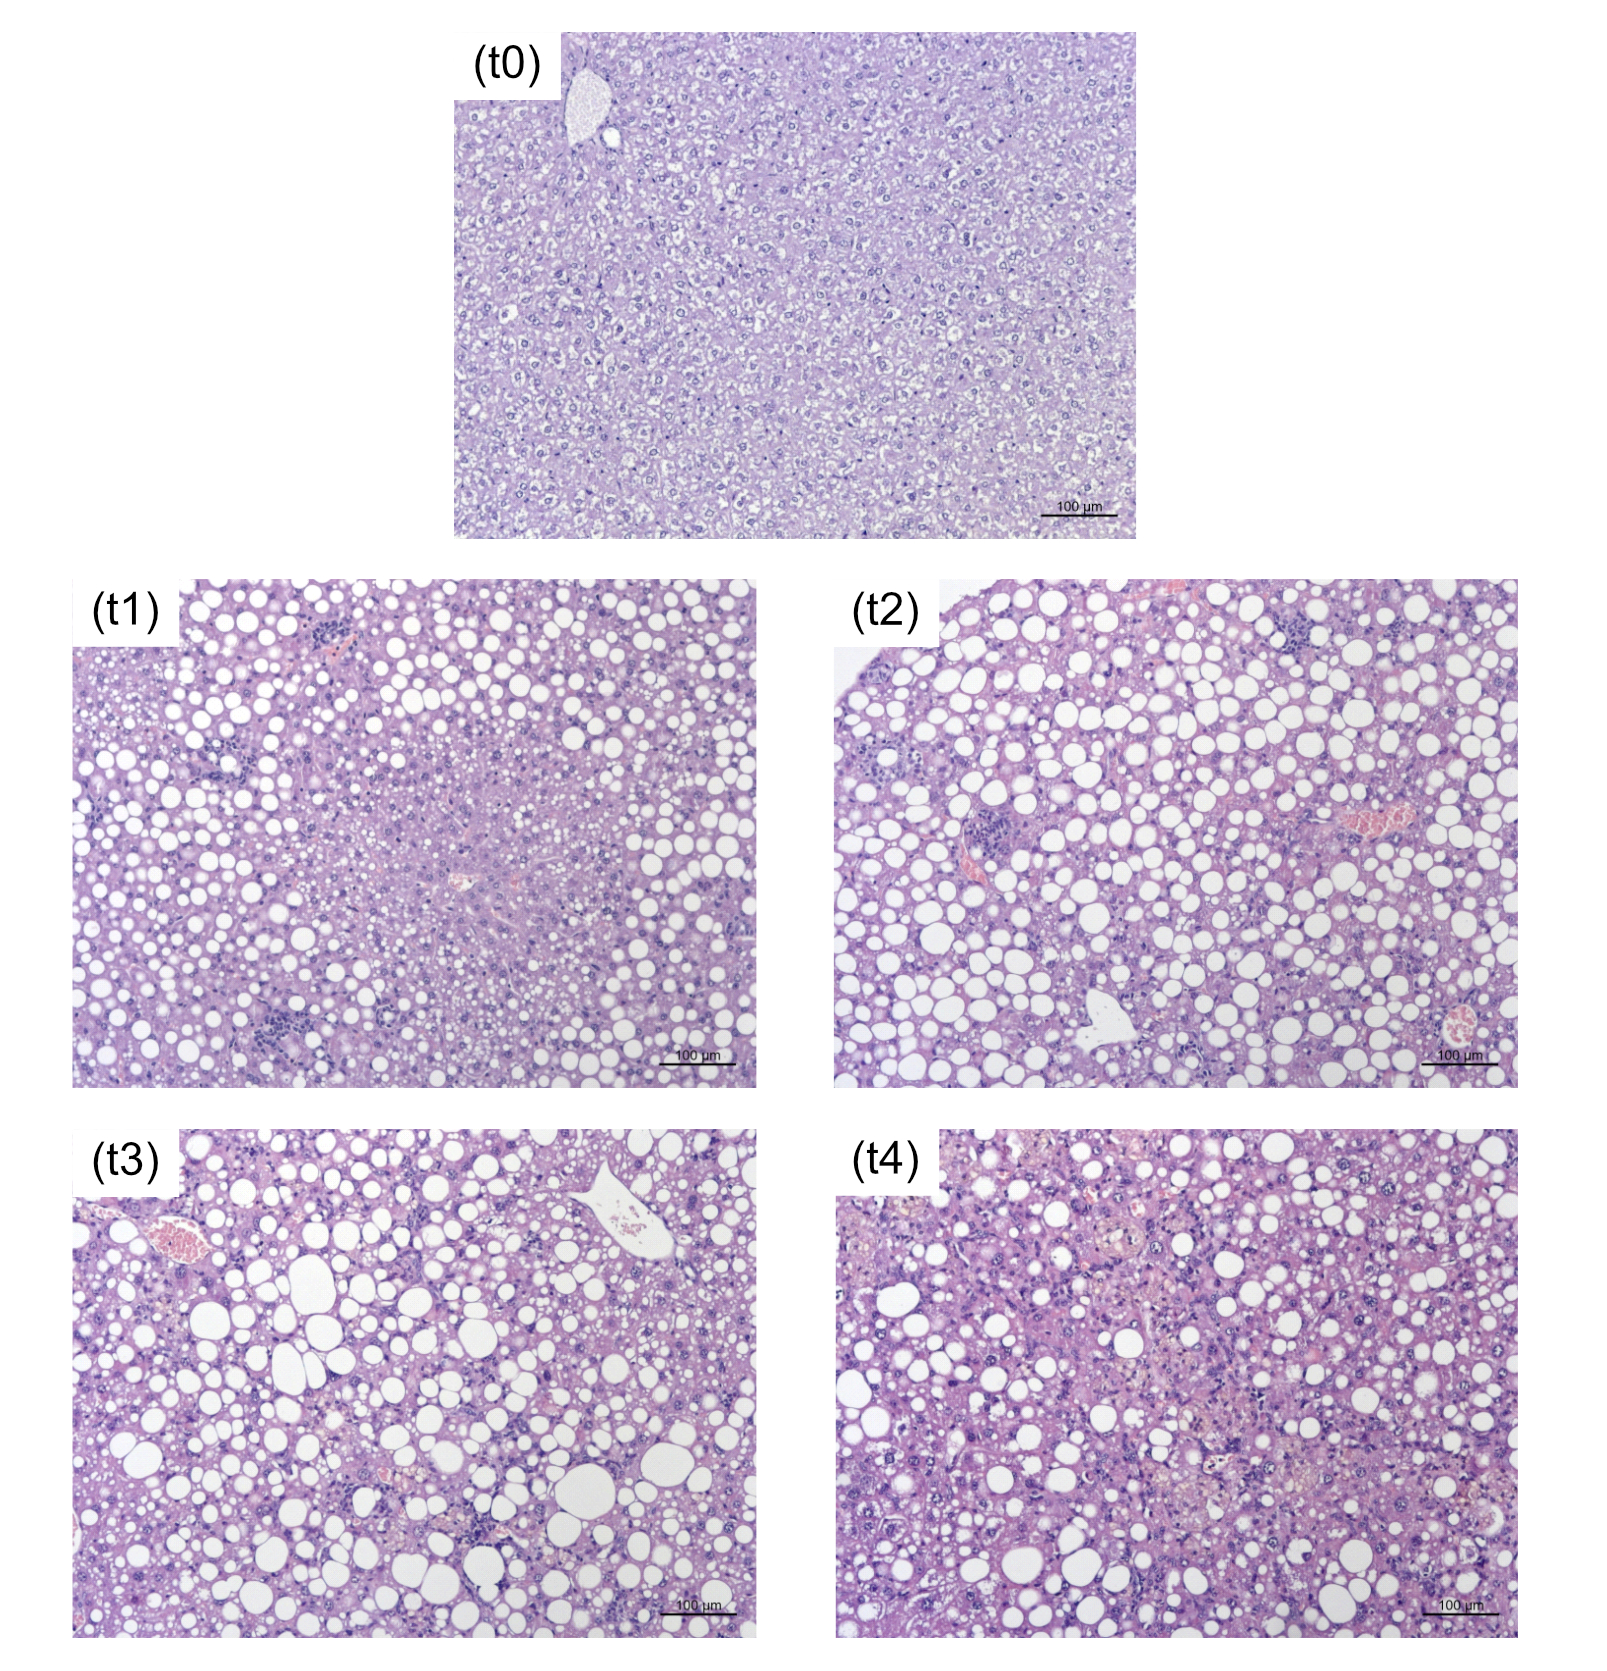
Figure 4: Histological H&E slides used to assess disease progression by quantifying fat droplet size and number at different time points.