3927
15O-Water PET Arrival Time Correlation with MR ASL Mean Arterial Time1Stanford University, Stanford, CA, United States
Synopsis
Keywords: PET/MR, PET/MR, ASL, MATT, PET arrival time
Motivation: Arterial Transit Time (ATT) is an important hemodynamic biomarker for cerebrovascular diseases such as stroke and although 15O-water PET is considered the gold standard CBF imaging modality, its capabilities in measuring transit time has not been demonstrated.
Goal(s): To map tracer arrival time in 15O-water PET exams.
Approach: Reconstructed short frames during the early PET acquisition with consistent image quality and used a 5D noise filtering method to measure time-activity-curve and then PET-arrival-time for each voxel.
Results: PET-arrival-time can map perfusion related abnormalities apparent in simultaneously acquired ASL-ATT
Impact: Even though 15O-water PET is considered the gold standard CBF imaging modality, it lacks measuring an important hemodynamic biomarker, arterial-transit-time. By using MR-priors, we measured the PET-arrival-time on PET/MR and showed it correlates well with MATT measured by ASL simultaneously.
Objectives:
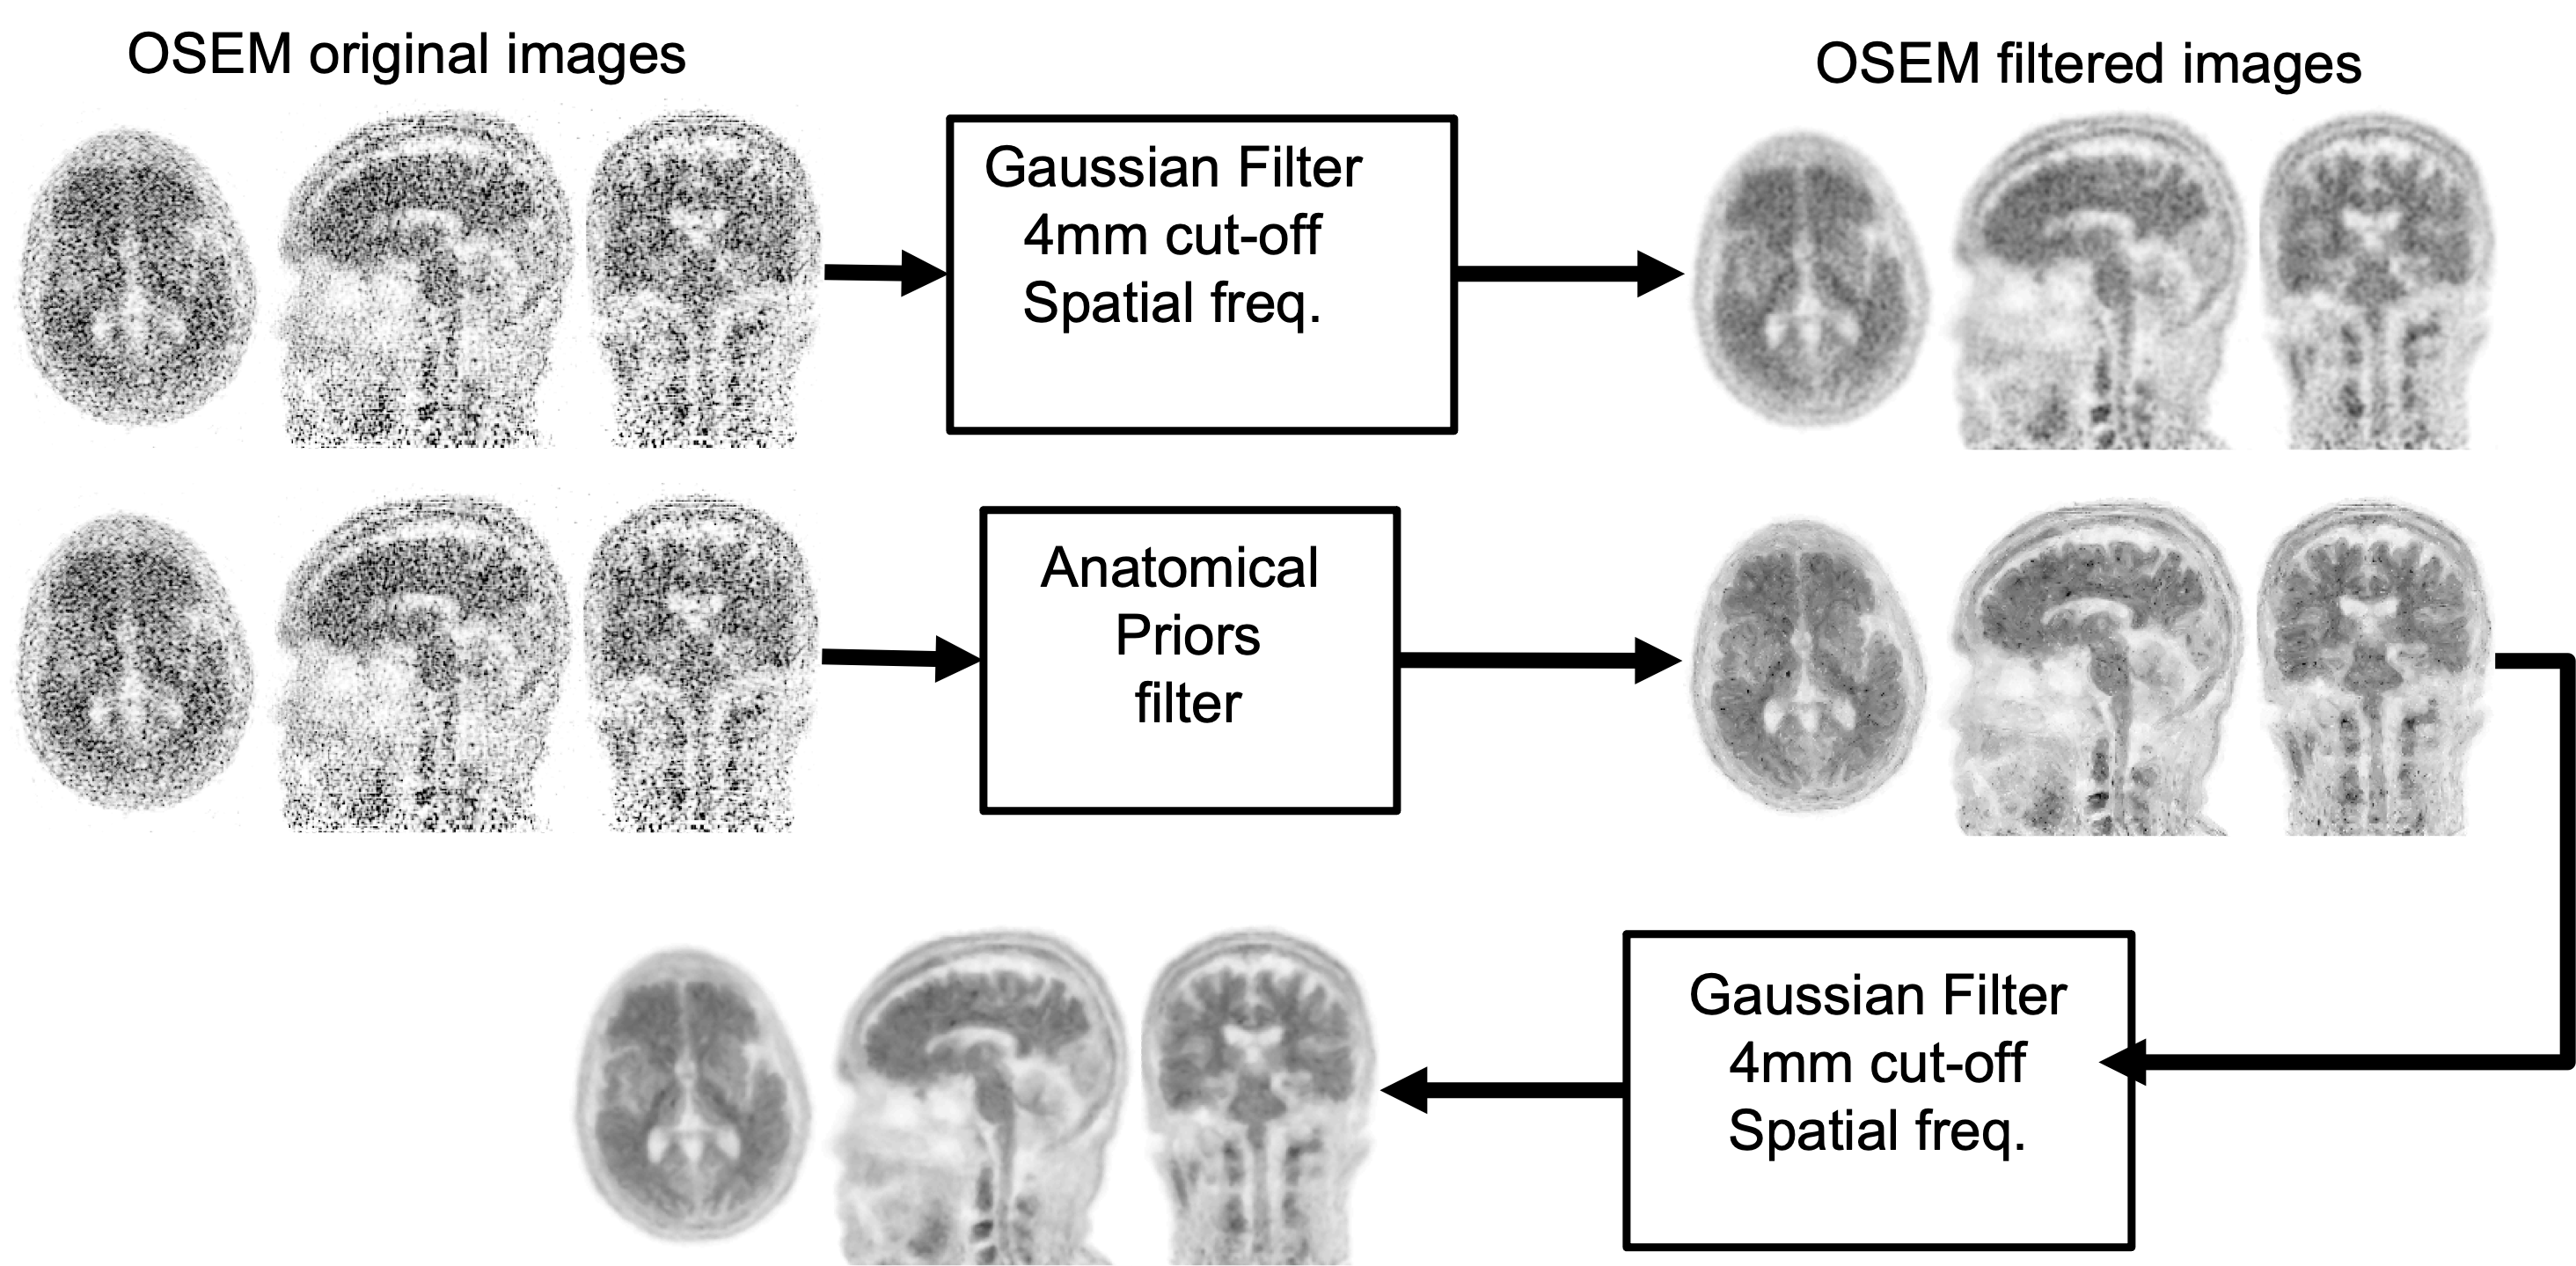
Arterial transit time (ATT) is an important hemodynamic parameter that measures the time it takes for a target compound to reach the imaging region and can be used to mitigate the transit delay confounds in mapping CBF by the ASL technique. In addition to its utility in correcting CBF measurements, ATT is a standalone biomarker and provides valuable insight into the perfusion dynamics in the cerebrovascular system and can distinguish the healthy from the pathological1,2. However, this hemodynamic parameter has not been measured in 15O-water PET exams which is the gold standard CBF imaging modality.To measure the tracer arrival time in PET, a high temporal resolution (better than 1 second) is needed. Such short frames result in high spatial-temporal noise which makes the measurement of tracer arrival time practically impossible. To control the noise, we chose our short frames with 0.5 million coincident events to ensure consistent image quality between frames. We used a 5-dimensional filter to reduce the noise: a 3D filter in space, a 1D filter in time and a 1D filter using MR-priors3. We used the MR anatomical images to identify similar voxels (voxels with similar intensity on MR anatomical images) and we used a Gaussian filter to remove noise between these similar voxels.
Methods
A Moyamoya patient was injected with 23 mCi of 15O-Water and scanned on a 3T PET/MR scanner (SIGNA, GE HealthCare, Waukesha WI). The patient provided written consent and the study was approved by Stanford IRB. The PET list file was used to reconstruct short frames with 0.5 million counts in the early PET uptake. A 5-dimensional filter was used to remove noise. For each voxel, its 27 most similar voxels from anatomical MRI images were found and a 1D Gaussian filter with FWHM of 4 mm was applied. A 3D Gaussian filter (FHWM 4mm) was applied in spatial domain and a low pass filter was used to remove noise in temporal domain. Using the time activity curve (TAC) for each voxel, the arrival time from 0 to 80% of the peak tracer accumulation was then calculated as an estimated measure for the tracer’s arrival time.Results
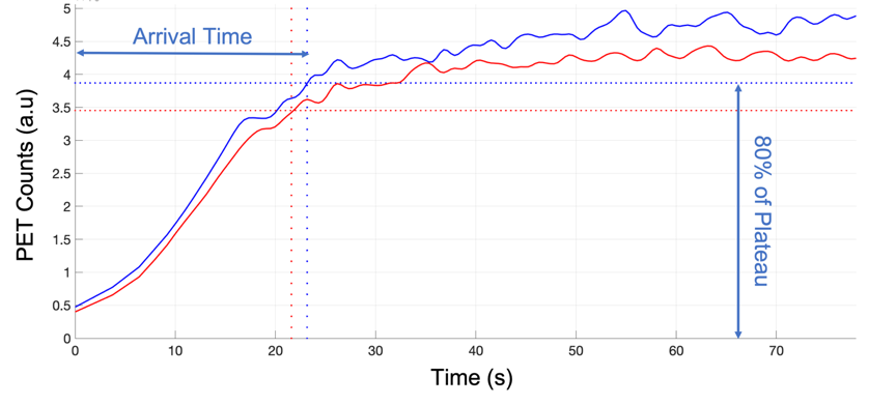
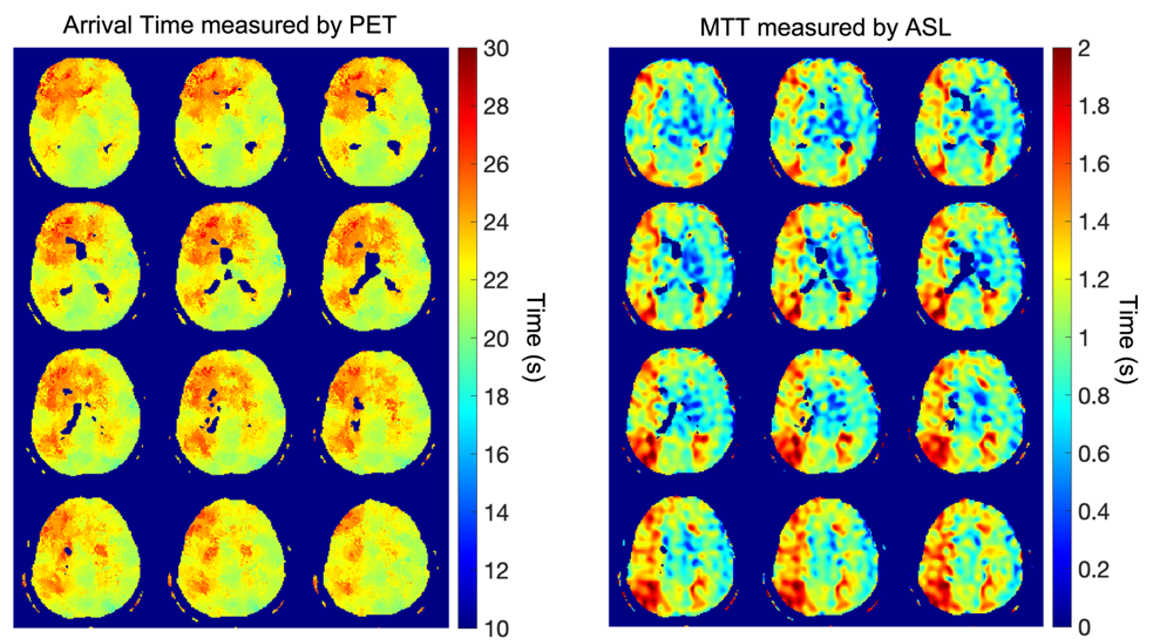
Figure 1 shows the denoising of short PET frames. Instead of using the conventional 3D spatial filtering showed in the top row, the images are filtered with anatomical priors first i.e., the similar voxels are identified by MR anatomical images and then a Gaussian filter is applied to them followed by a spatial 3D Gaussian filter. The images are then filtered in the time domain using a low pass filter. Figure 2 shows the TAC curves for two representative voxels in the right (blue) and left (red) of the brain. The horizontal lines show the 80% of their plateau levels and the vertical lines show the measured arrival time for each voxel. Figure 3 compares the arrival time measured by PET and the mean arterial transit time measured by ASL simultaneously. An arterial occlusion on the right side of the patient is indicated by both PET arrival time and ASL arterial transit time as bot modalities show a delayed blood flow to the right side of the brain.Conclusion
PET arrival time measurement has been made possible using high temporal frames with consistent image quality and using anatomical MR priors to control noise further in addition to temporal-spatial filtering. The initial results shows a good correlation with ASL mean arterial transit time measured simultaneously on a PET/MR scanner.Acknowledgements
No acknowledgement found.References
[1] Zhao MY, Fan AP, Chen DY-T, et al. Using arterial spin labeling to measure cerebrovascular reactivity in Moyamoya disease: Insights from simultaneous PET/MRI. Journal of Cerebral Blood Flow & Metabolism. 2022;42(8):1493-1506.
[2] Fan, Audrey P., et al. "Comparison of cerebral blood flow measurement with [15O]-water positron emission tomography and arterial spin labeling magnetic resonance imaging: a systematic review." Journal of Cerebral Blood Flow & Metabolism 36.5 (2016): 842-861.
[3] Khalighi MM, et al. “High resolution PET image denoising using anatomical priors by K-nearest neighborhood method in the feature space,” ISMRM 2021
Figures