3923
Measurement and modeling of peripheral nerve magnetostimulation in a head solenoid from 200 Hz to 88.1 kHz1EECS, MIT, Cambridge, MA, United States, 2Martinos Center, MGH, Charlestown, MA, United States, 3Biophysics, Harvard, Boston, MA, United States, 4Health Sciences and Technology, Harvard-MIT, Cambridge, MA, United States, 5Harvard Medical School, Boston, MA, United States
Synopsis
Keywords: Bioeffects & Magnetic Fields, Bioeffects & Magnetic Fields, Peripheral Nerve Stimulation, Magnetic Particle Imaging
Motivation: Two previous peripheral nerve magnetostimulation experiments reported increasing thresholds above 25 kHz, which deviates from the hyperbolic strength-duration curve describing thresholds versus frequency. However, high-frequency PNS measurements are sparse and established neurodynamic models have not been validated above 1 kHz.
Goal(s): Characterize PNS thresholds in a solenoidal head coil between 200 Hz and 88.1 kHz.
Approach: We measure PNS thresholds in four healthy volunteers and compare to predictions of our electromagnetic-neurodynamic PNS model.
Results: The measured thresholds increase 36% on average from 16.9 kHz to 66.7 kHz, which is at odds both with the hyperbolic scaling as well as our detailed PNS modeling.
Impact: Our strength-duration measurements show that the greatest stimulation propensity is ~17 kHz and PNS thresholds remain relatively low at frequencies greater than 20 kHz, which is important for informing the design of MRI and MPI coils.
Introduction
Time-varying magnetic fields produced by MRI gradient coils or magnetic particle imaging (MPI) drive coils induce electric fields that can cause peripheral nerve stimulation (PNS)[1]; a bio-effect to be minimized to ensure subject comfort and safety[2]. The fundamental law of magnetostimulation (FLM) predicts a hyperbolic relationship between B-field threshold amplitude and frequency[3]. However, two previous studies reported deviations from this relationship above 25 kHz [4,5]. A limitation of those studies is that they included only a few high frequency data points and which displayed high variability, suggesting further measurements of high-frequency thresholds are needed.Mapping of PNS at high frequencies is important for the design and operation of MPI drive fields (typically ~25 kHz)[6] and the development of high-frequency gradient systems[7]. We expand upon previous work by measuring PNS thresholds in 4 healthy volunteers at 16 frequencies between 200Hz and 88.1kHz and compare these measurements to the FLM and our neurodynamic PNS model[8-10].
Methods
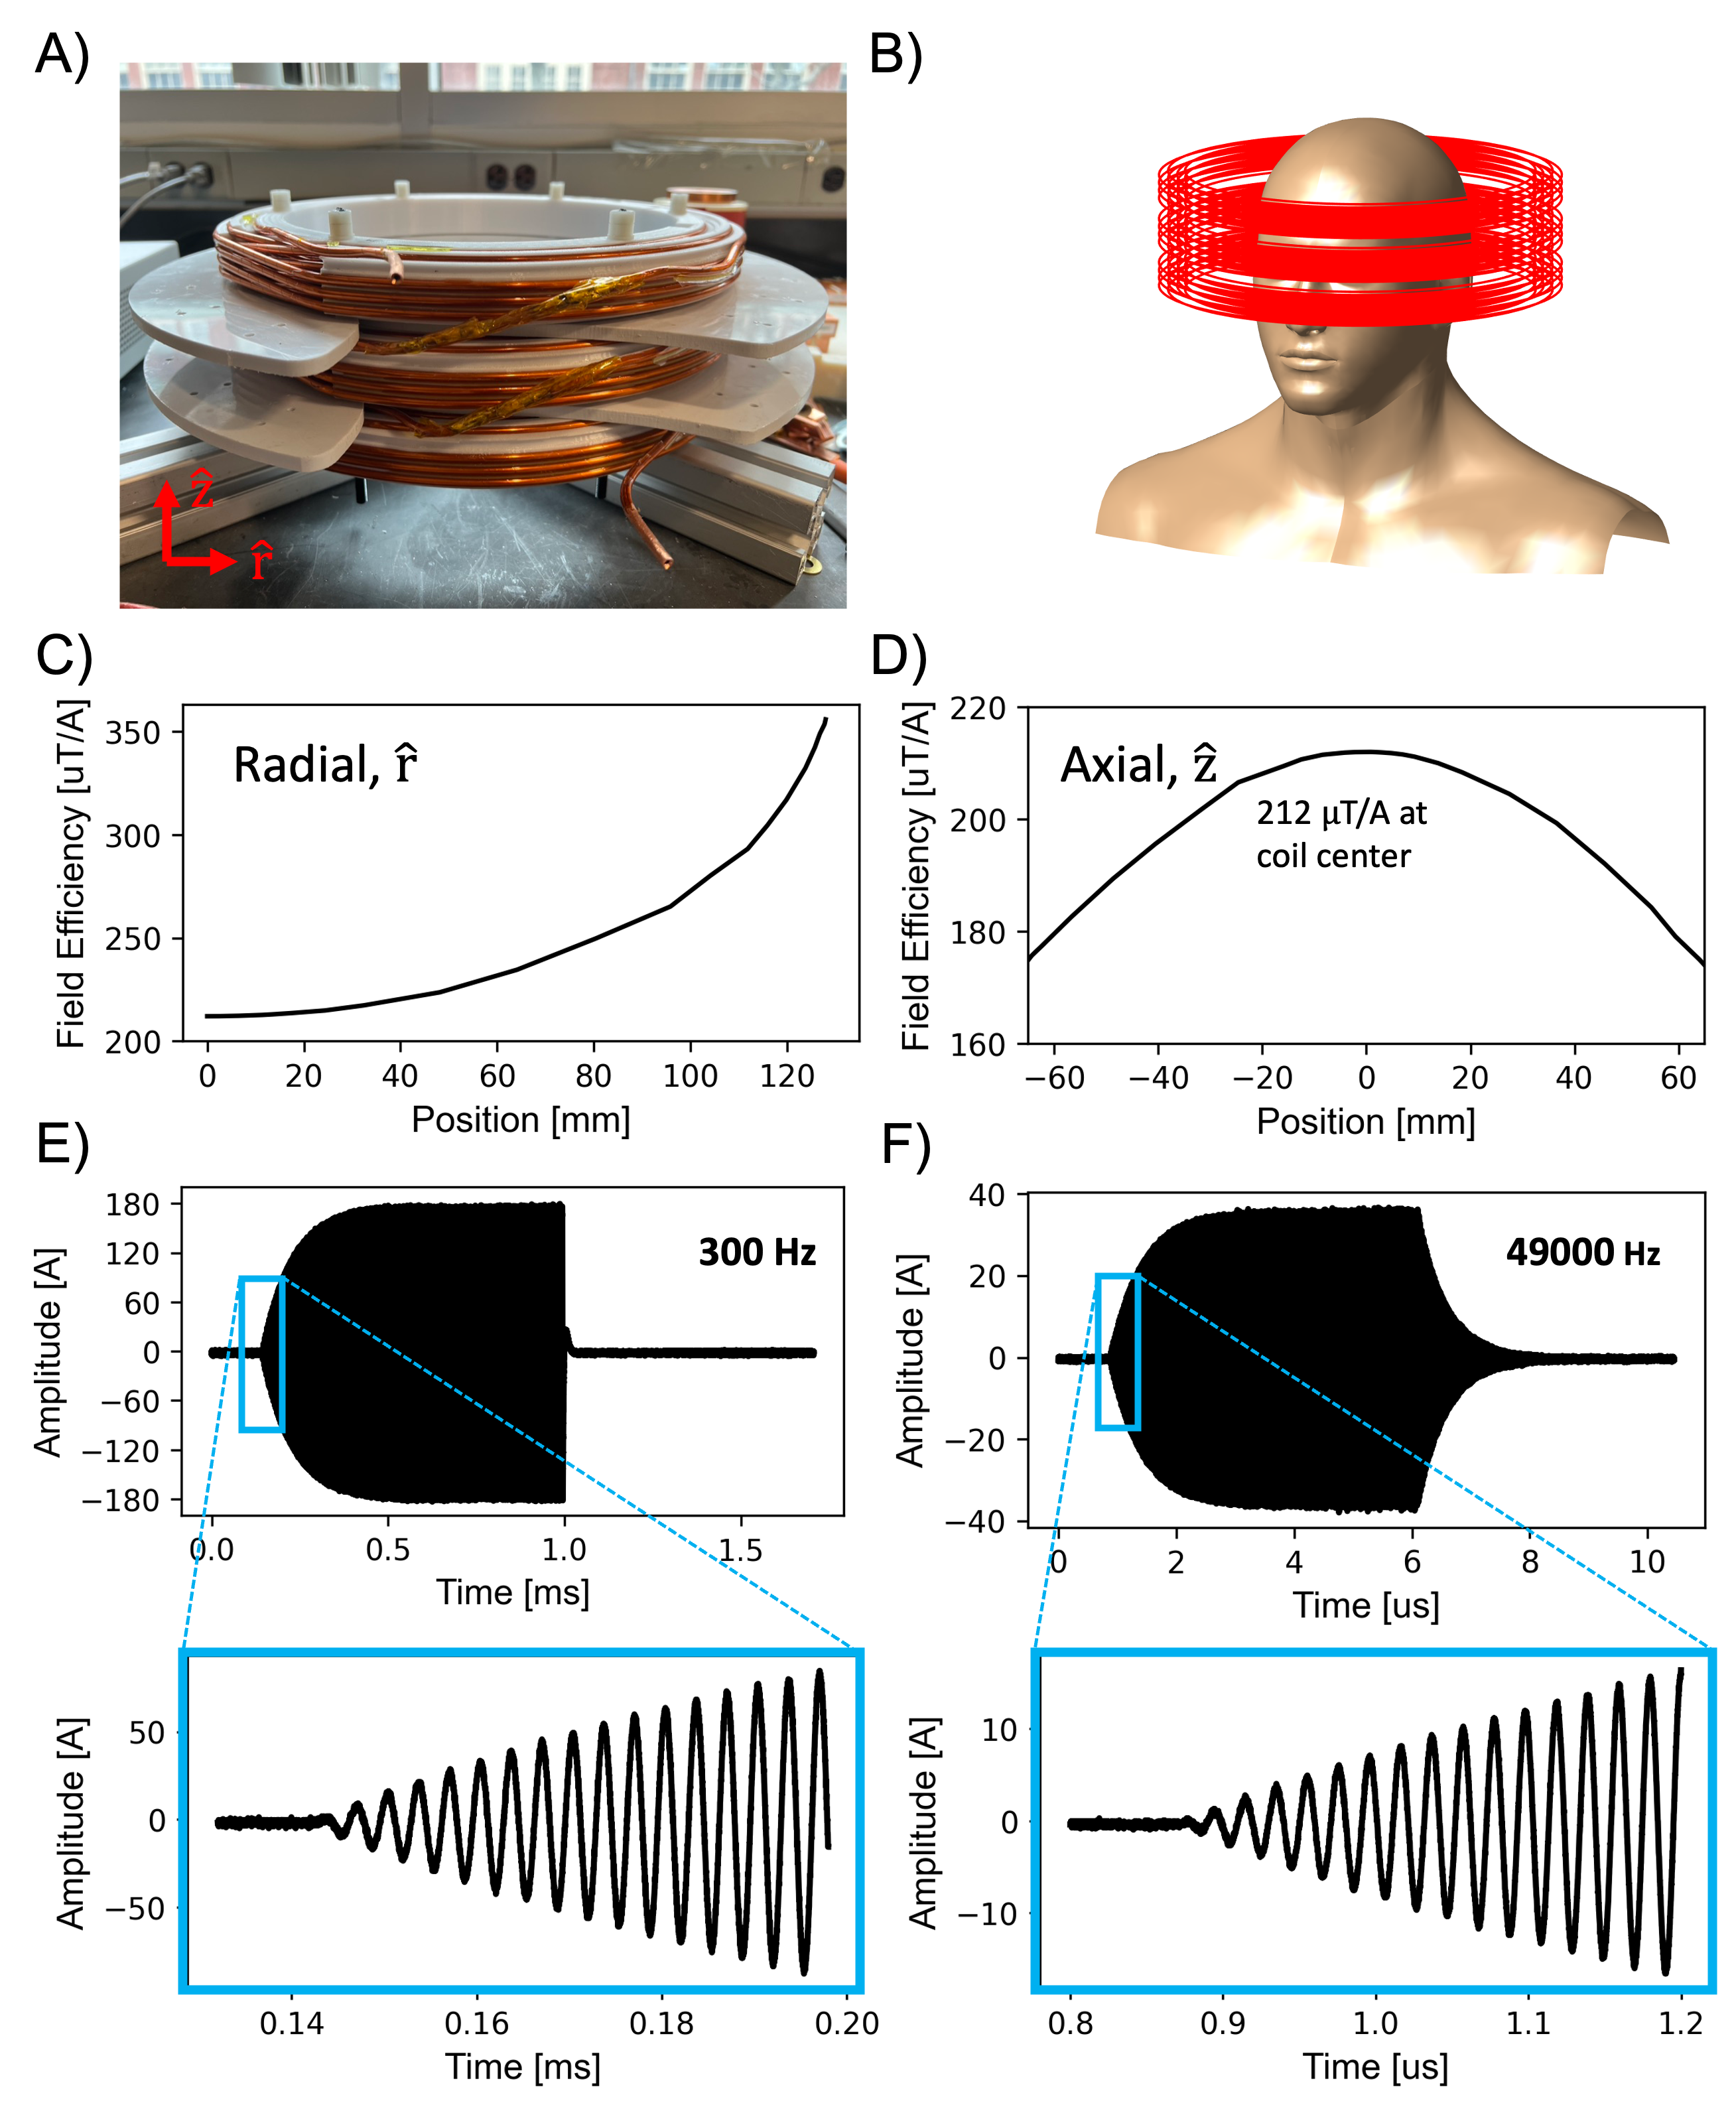
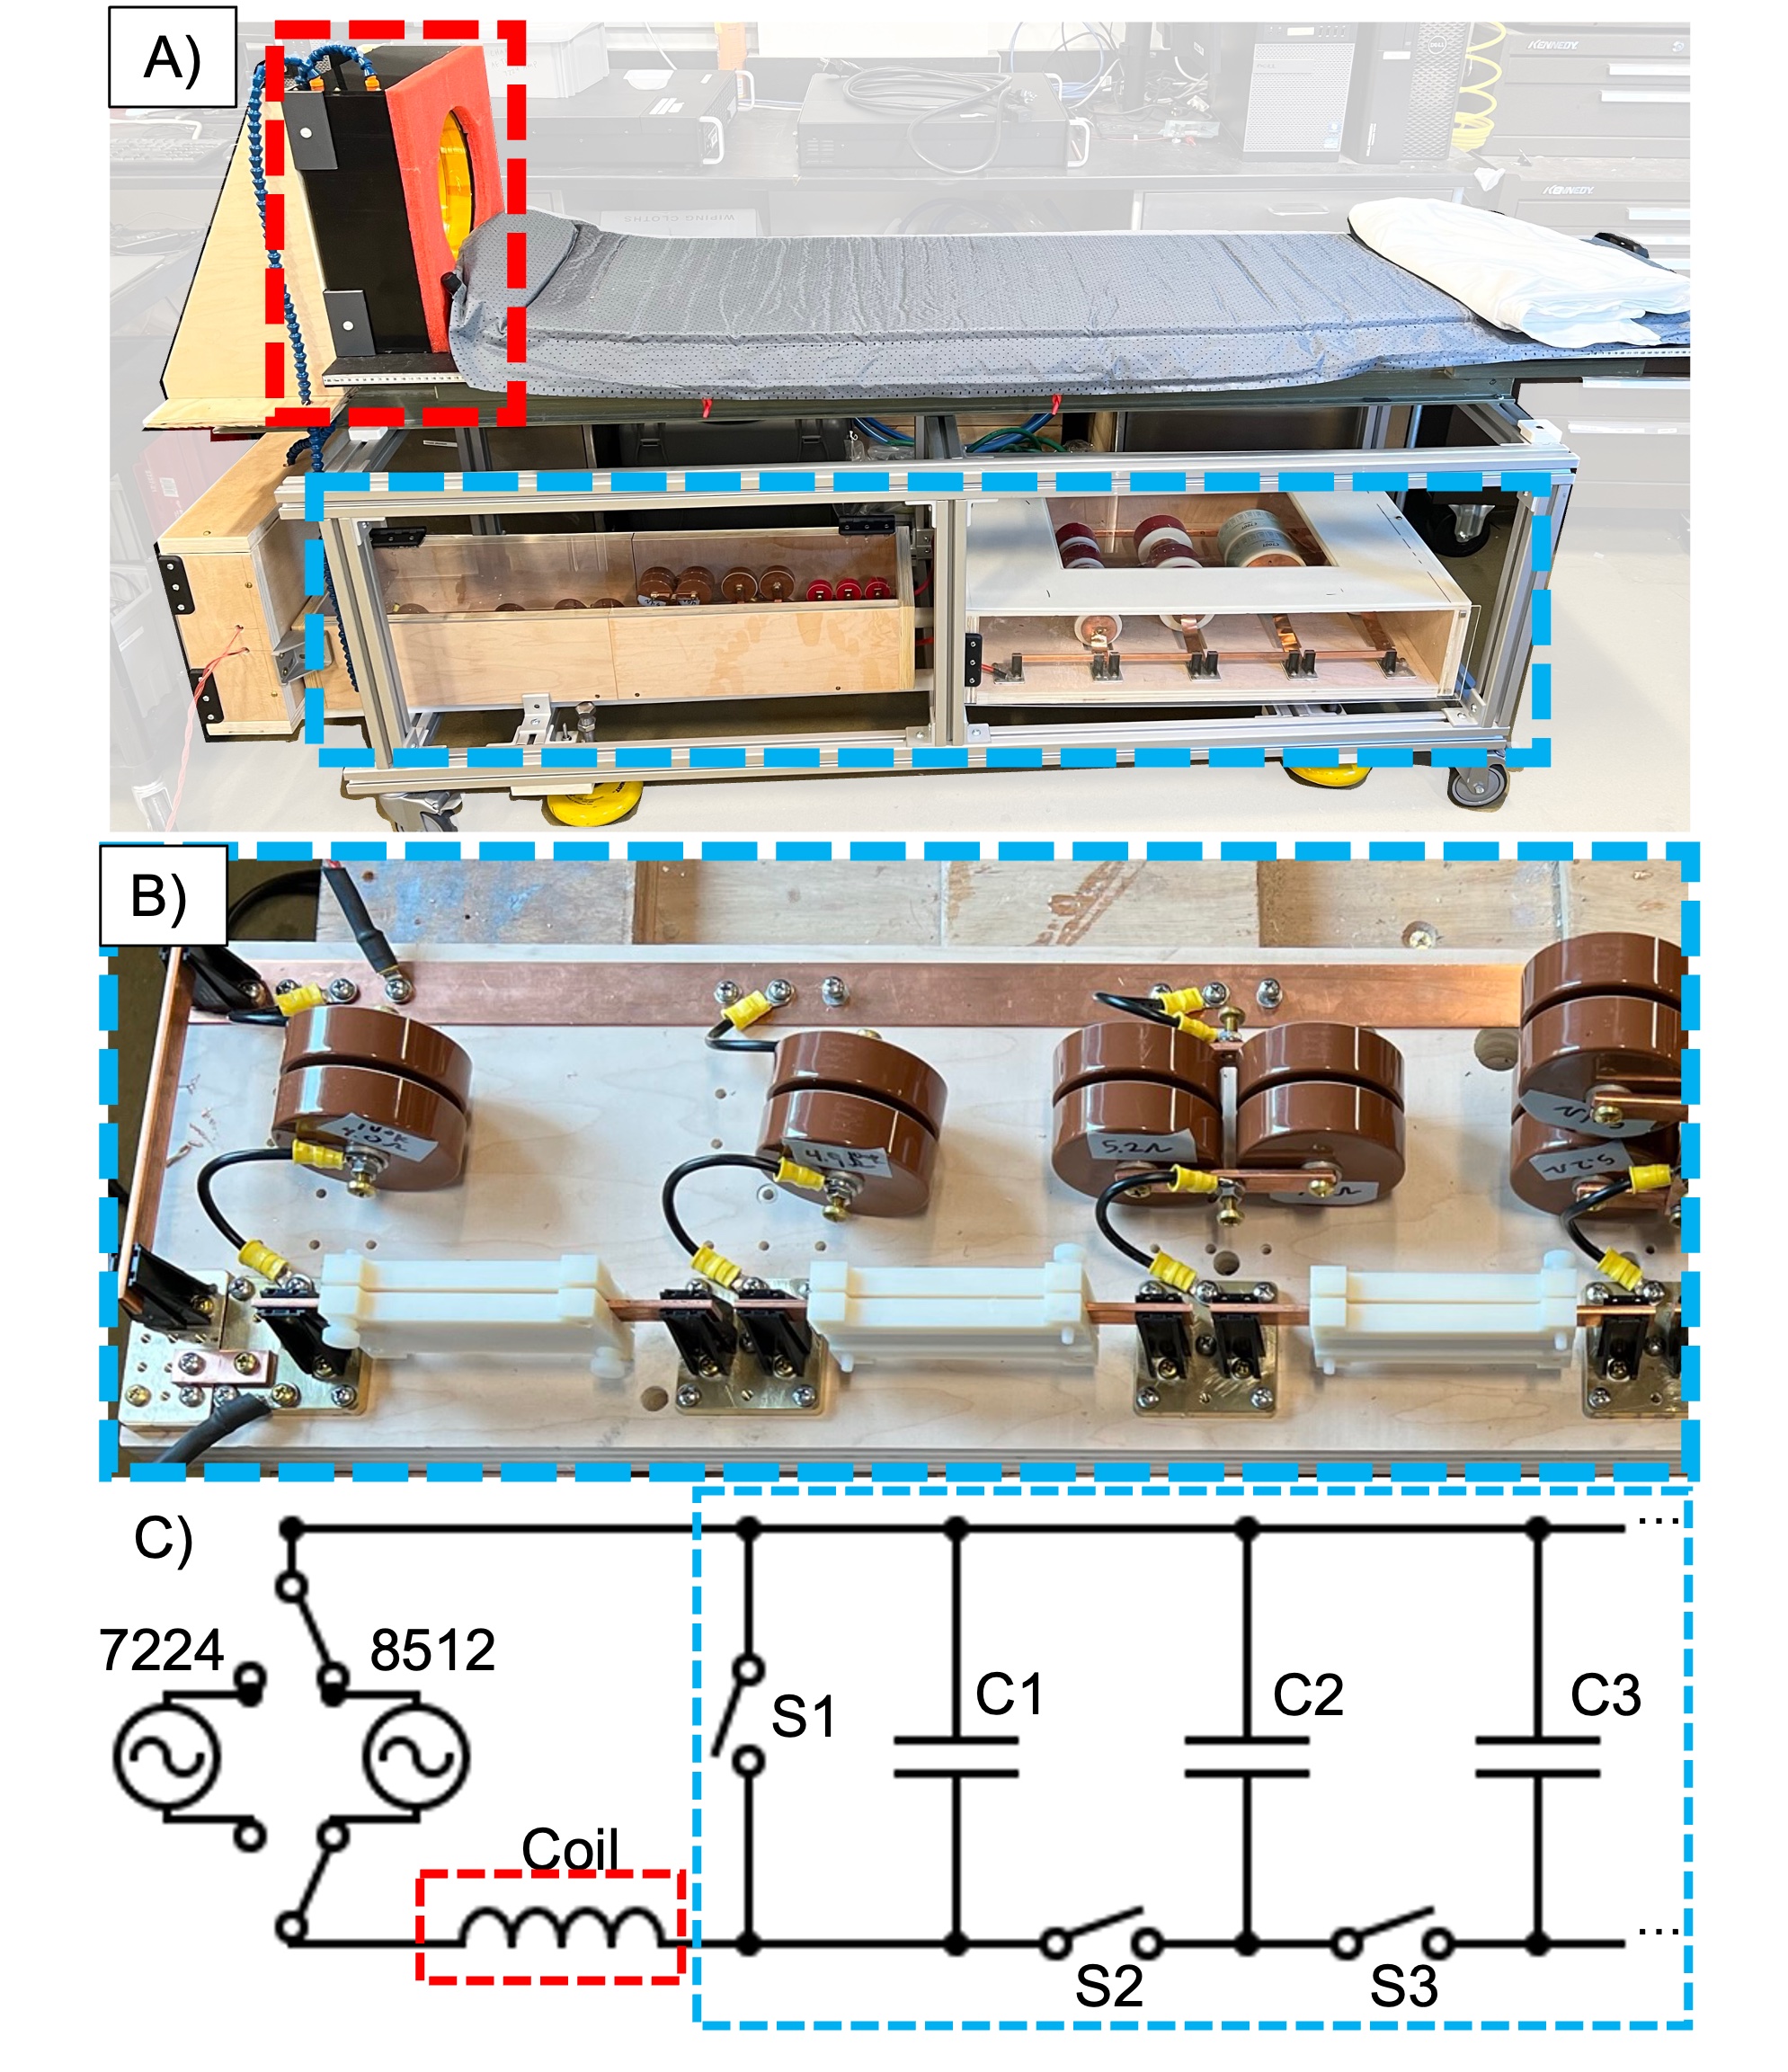
Coil design and switchable capacitor bank: We built a solenoidal coil based on our human MPI scanner drive coil design[11] (Fig. 1A). We connected the coil in series to a switchable capacitor bank to achieve resonance at 10 frequencies: 1.76, 2.59, 4.04, 8.05, 16.9, 25.3, 35.4, 49.0, 66.7, and 88.1 kHz. Driving at resonance minimizes impedance and power requirements, enabling high field amplitudes using conventional amplifiers (two high frequency AE Techron 7224 in a push-pull configuration)., Additionally, we drove the coil in an untuned configuration at six lower frequencies (f=200-700 Hz) using a AE Techron 8512 amplifier. The head coil and capacitor bank were mounted on a patient table (Fig. 2).Stimulus waveforms: We used a NIDAQ USB-6343 X-Series to generate sinusoidal stimulus waveforms with 256 cycles each (Fig. 1E-F). We modulated the low-frequency sinusoidal waveforms (f=200-700 Hz) with exponential ramp-up envelopes $$$(1-exp(t/\tau))$$$ with $$$\tau=25/f$$$ to enforce similar waveform shapes across tuned and untuned coil-configurations. The Techron AE 7224 current was monitored by a Rogowski coil, and the Techron AE 8512 current was monitored by the internal BNC IMON. We used a Tektronix P5200A differential high voltage probe to monitor the load voltage.
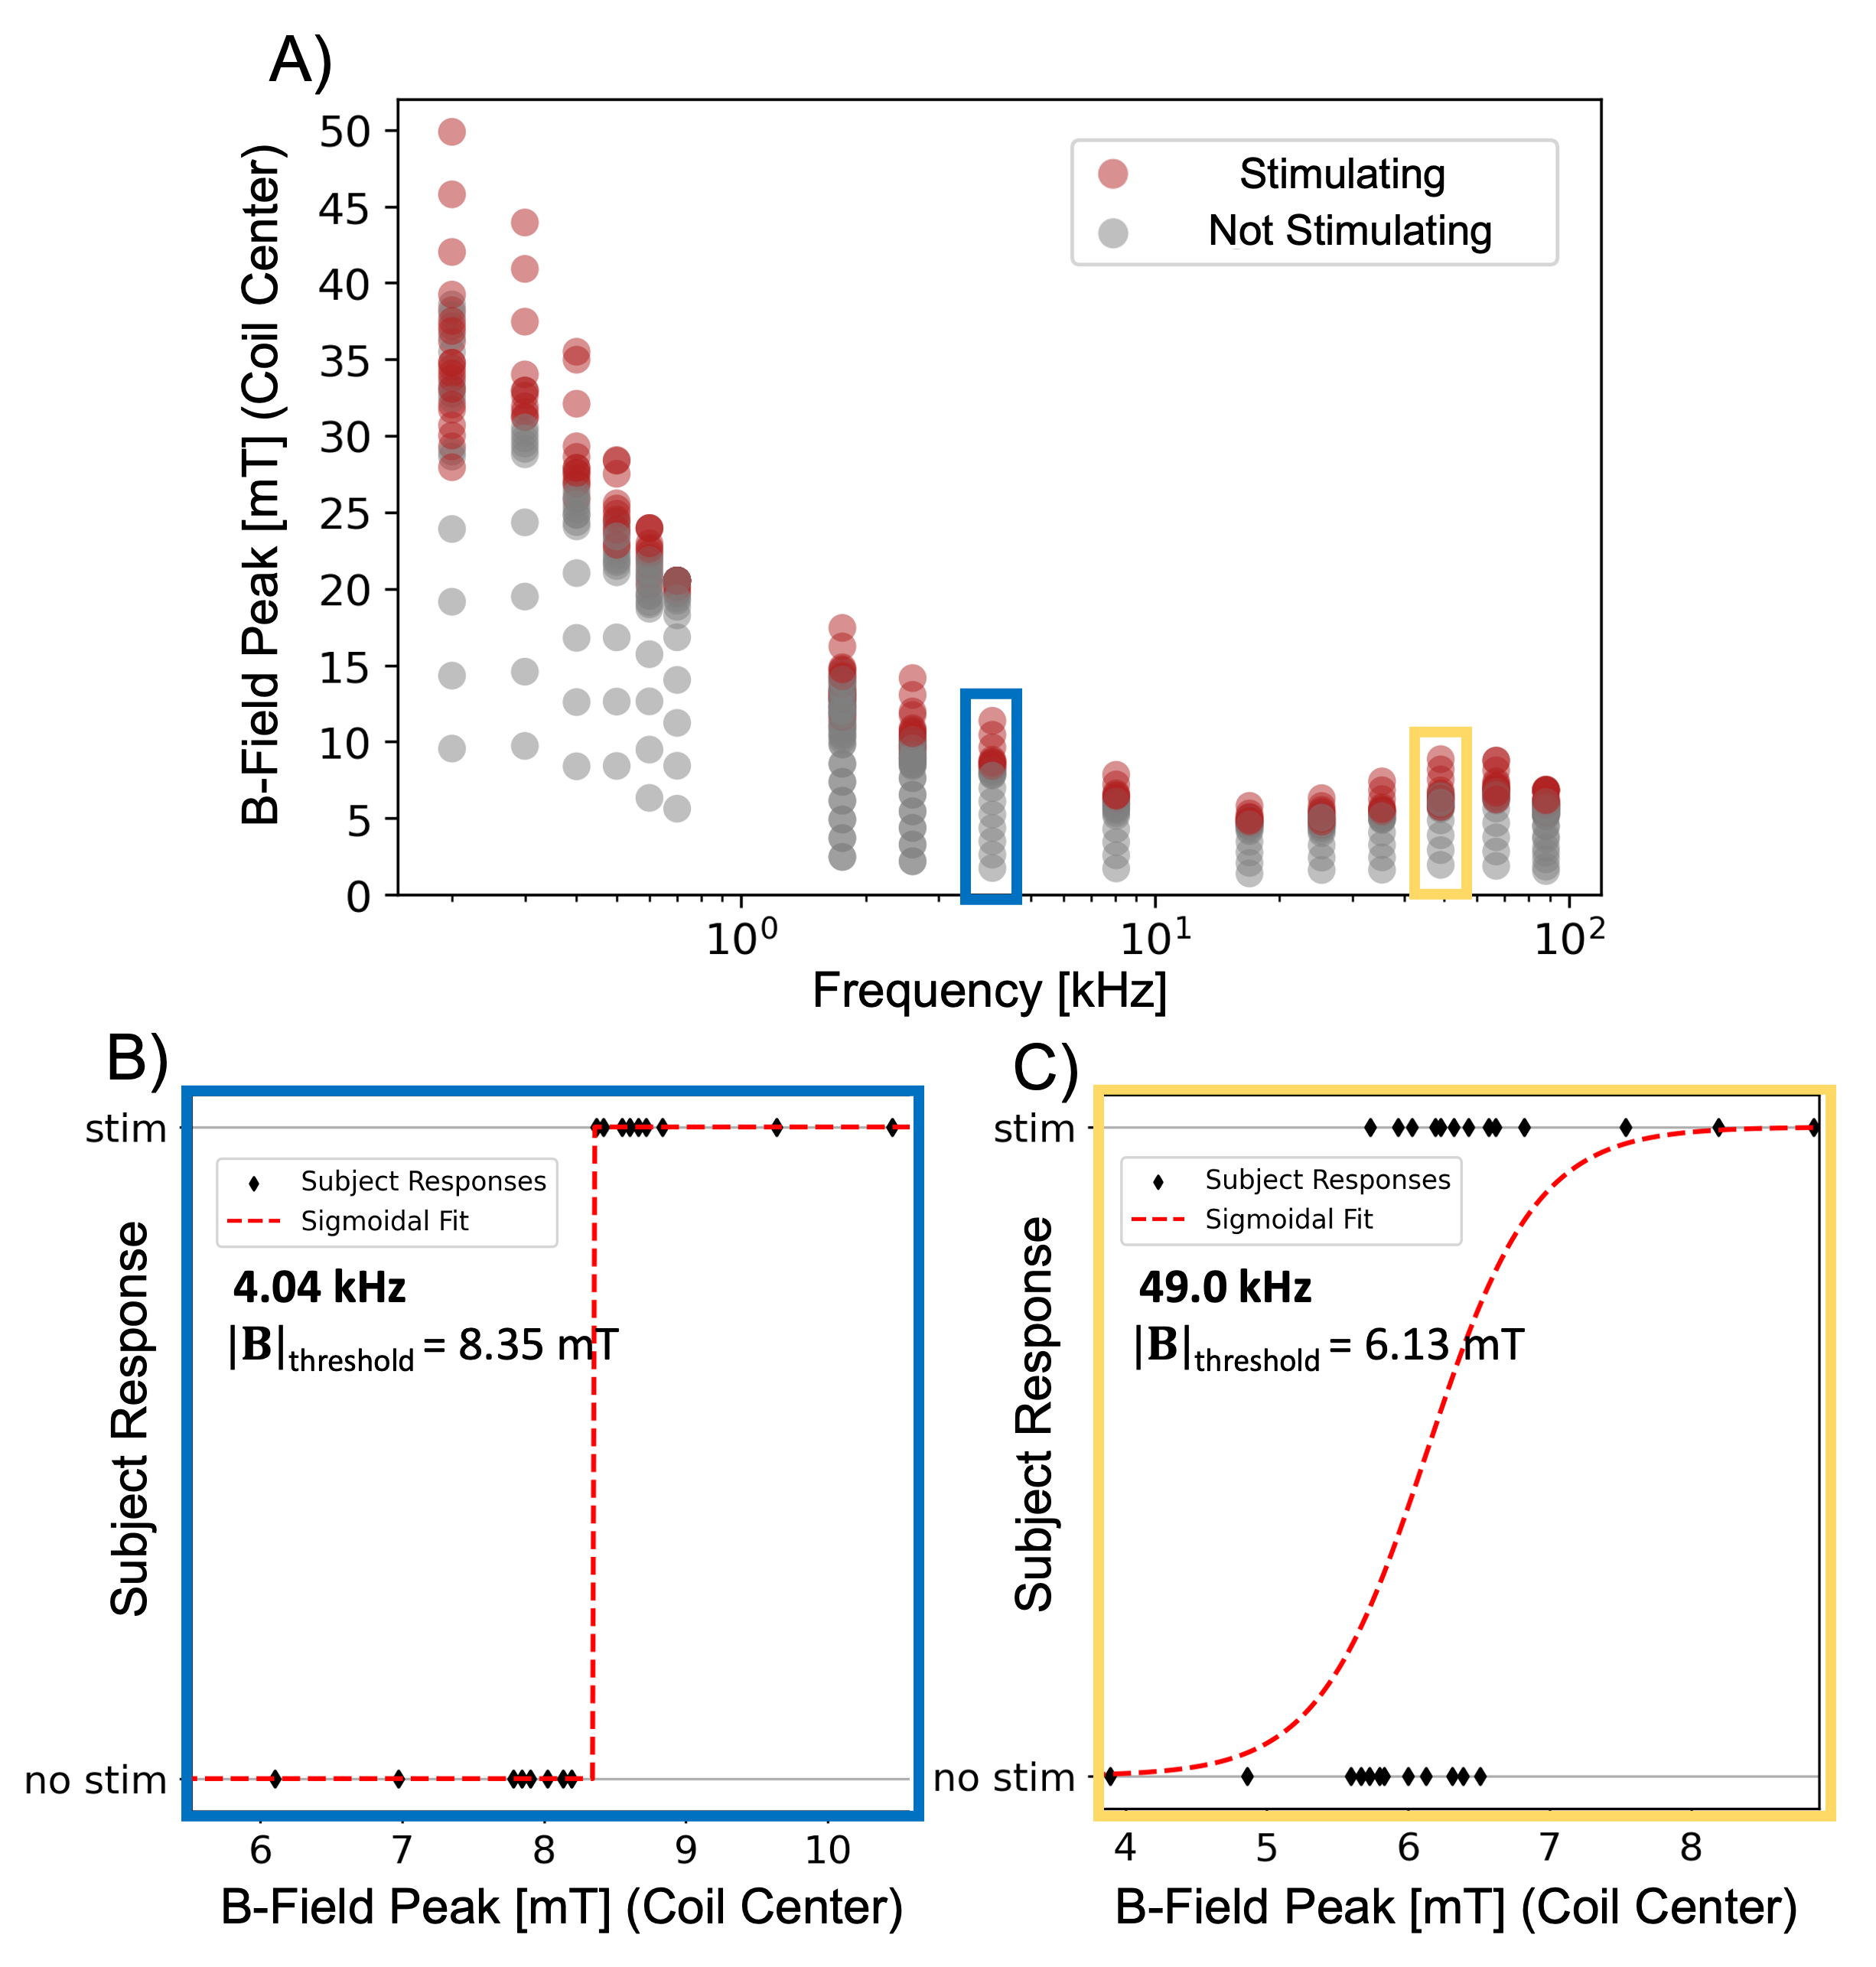
PNS threshold measurements: Four healthy volunteers (2 male, 2 female, 26-27 years, height 1.63-1.85 m, weight 123-195 lbs) provided written informed consent and were positioned with eyebrows at coil isocenter. Coil current (B-field) amplitude was varied for each frequency, and the subject reported responses (stimulation or no stimulation) via a push button. We fitted a sigmoid curve to stimulation responses versus B-field amplitude for robust threshold determination[6].
PNS simulations: We modeled PNS thresholds for the head coil and sinusoidal stimulus waveforms in male and female body models using our previously developed, PNS modeling framework experimentally validated in the 100-5000 Hz range[8-10] Our framework combines state-of-the-art FEM E-field simulations with the neurodynamic MRG model[12] to predict PNS at the individual nerve level.
Results
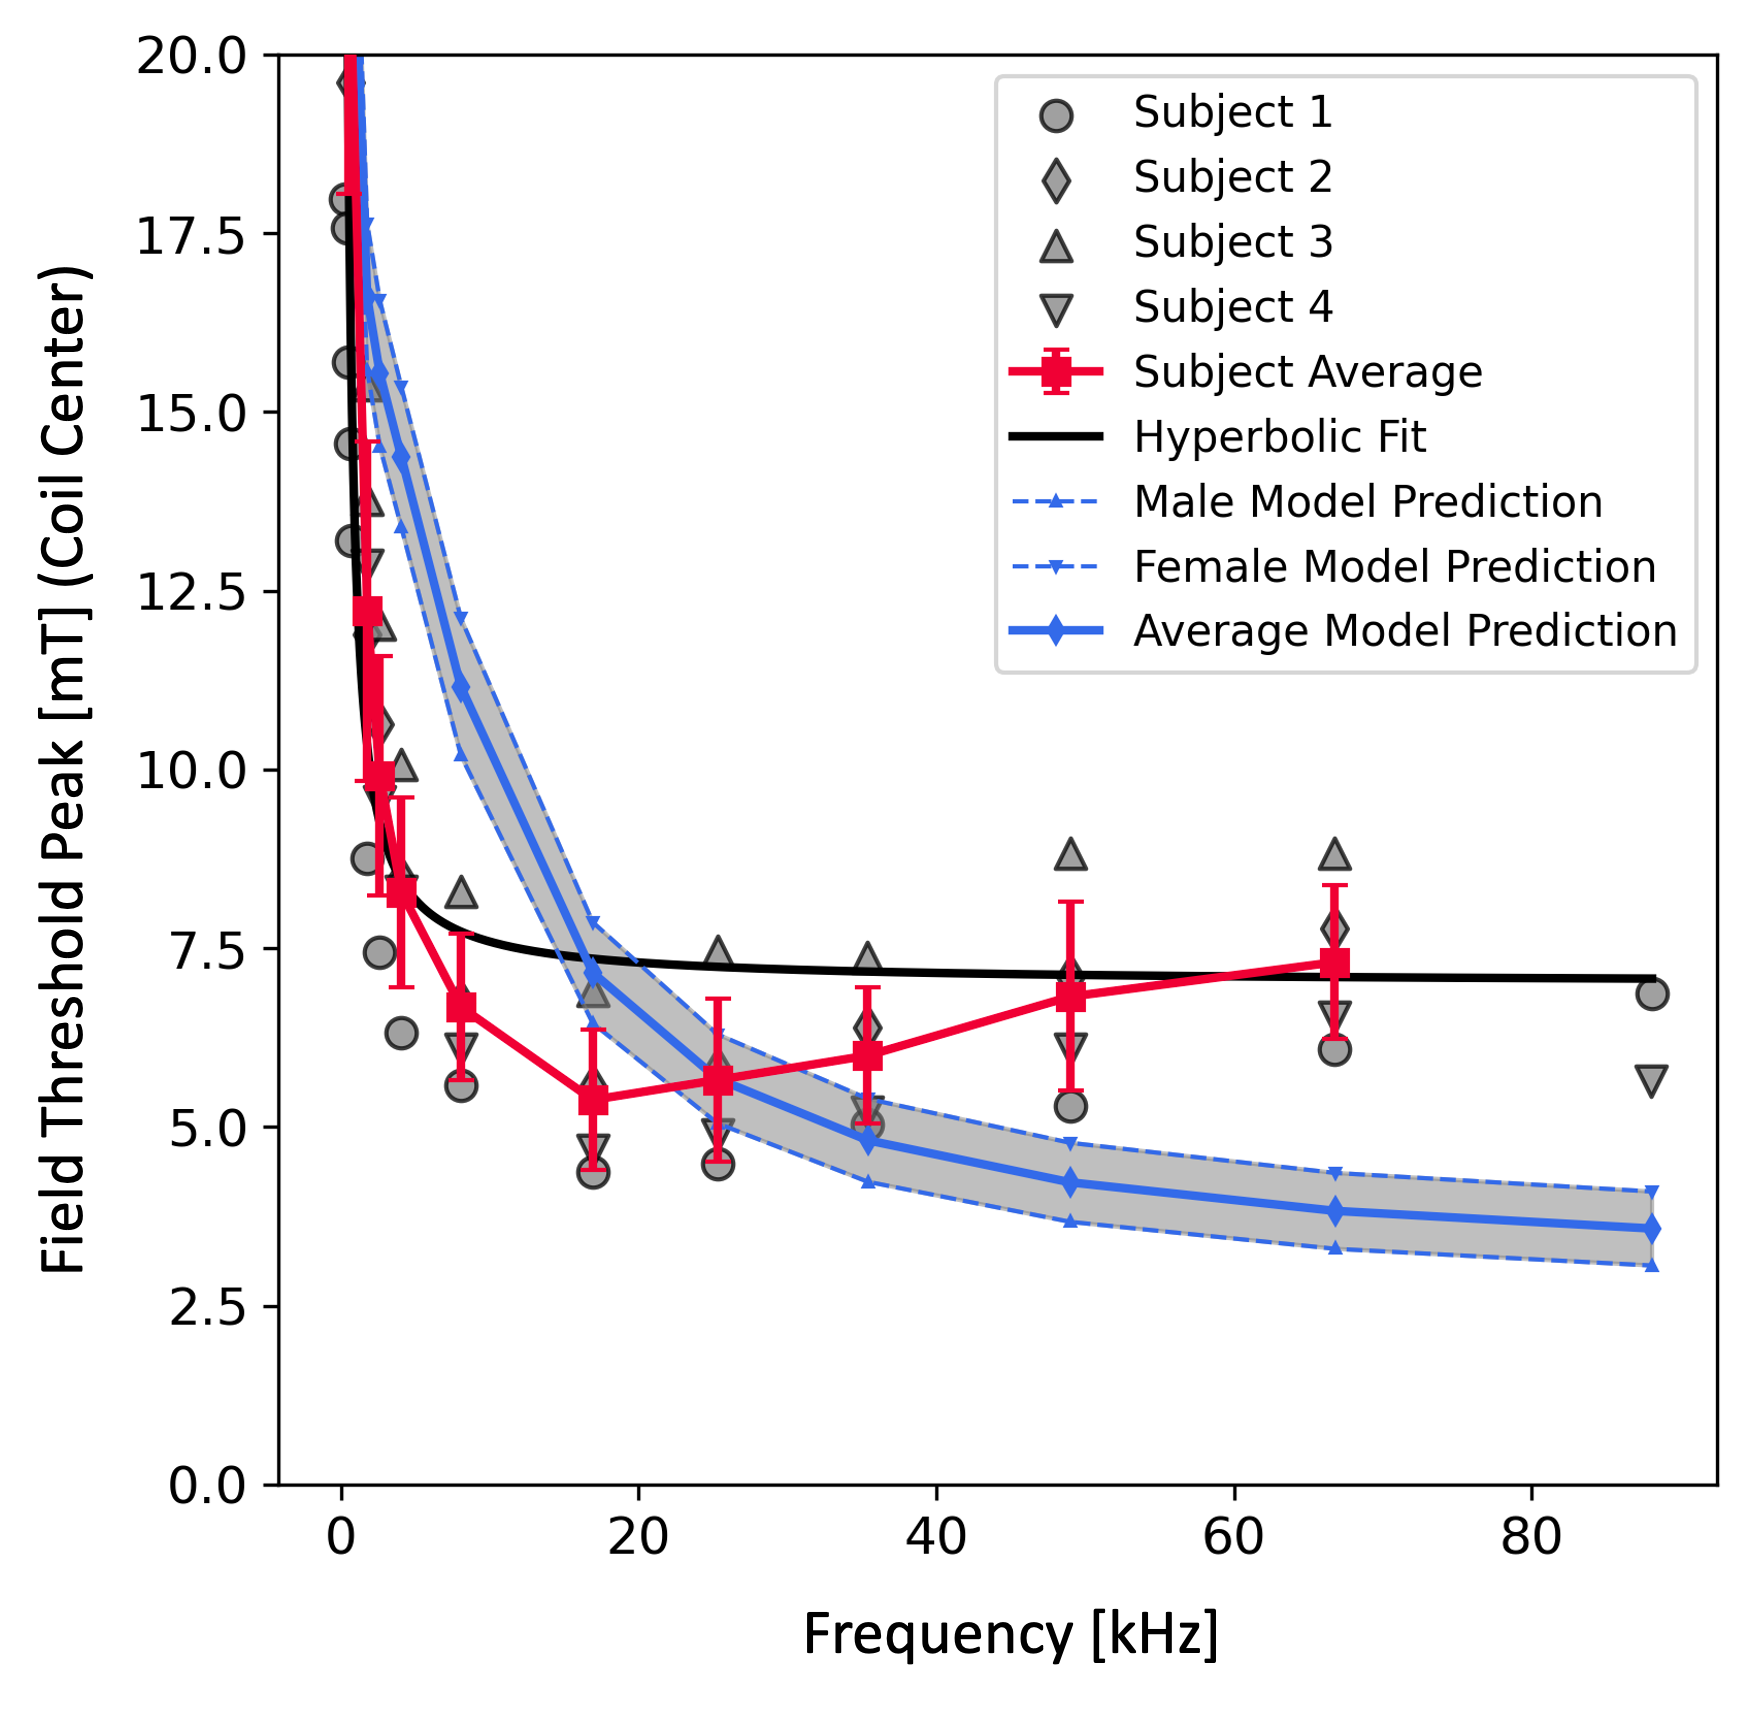
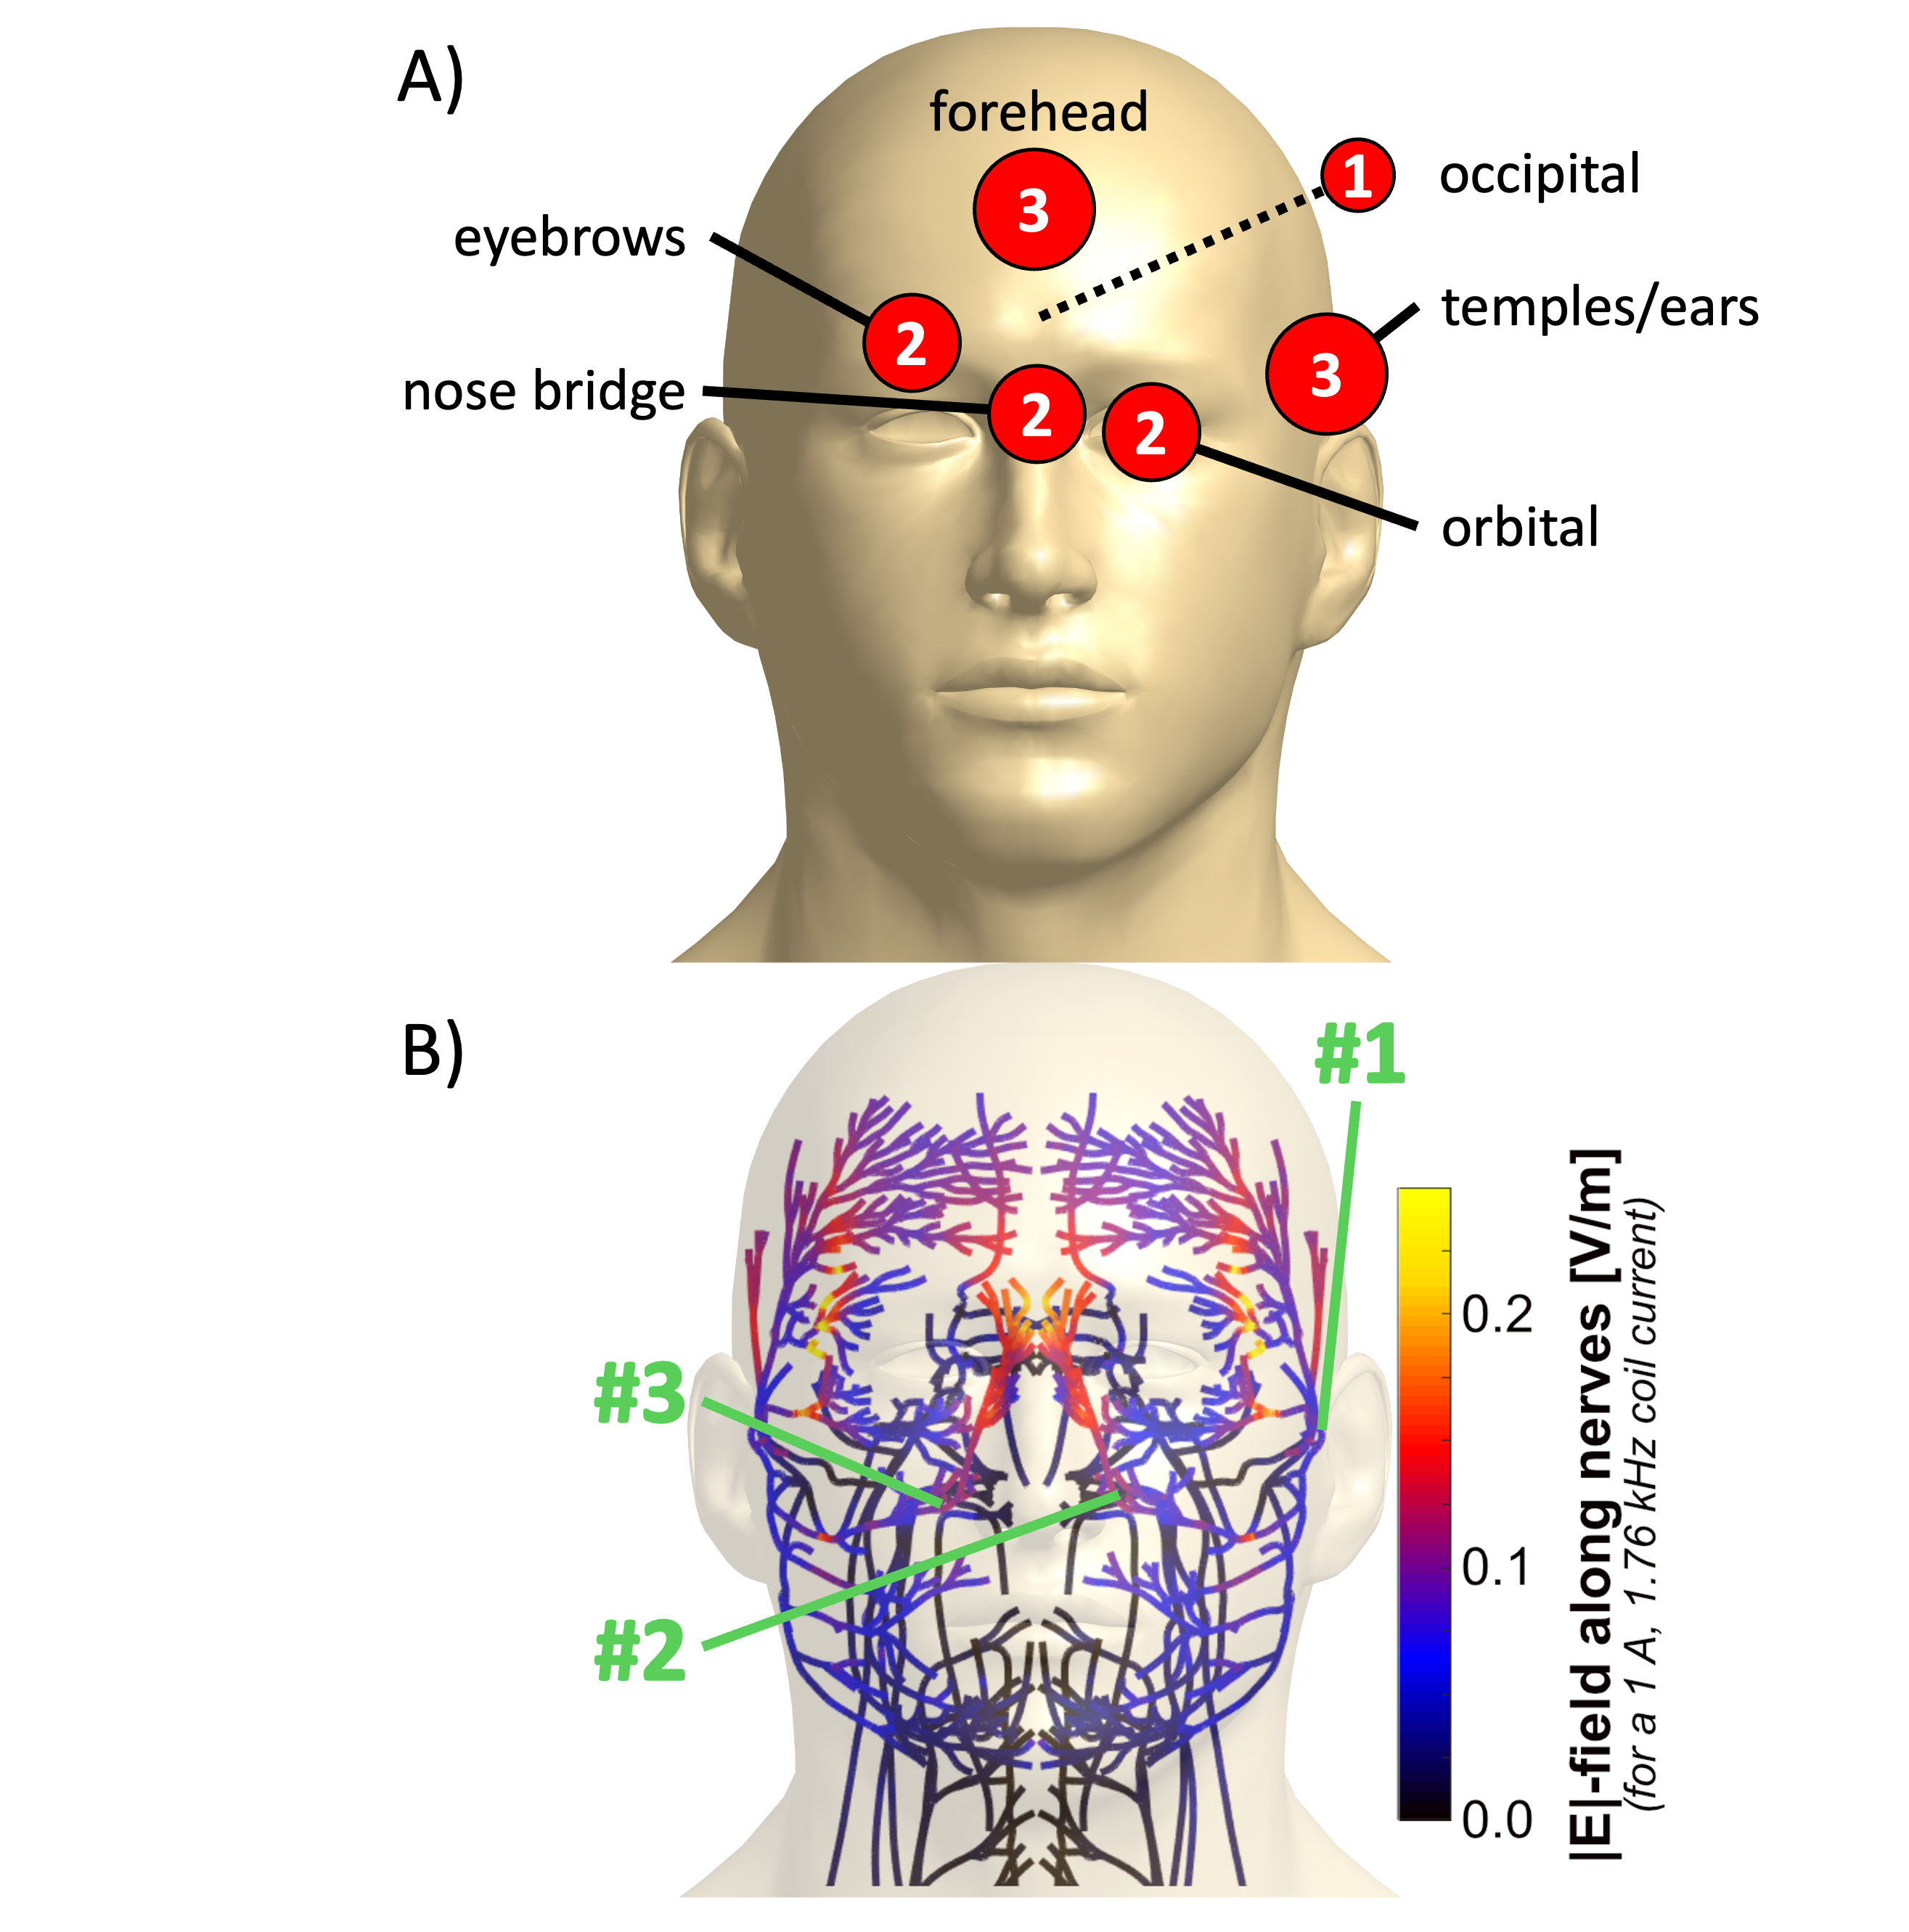
Figure 3 shows stimulation responses, example titration curves, and sigmoid fit for one subject. Figure 4 shows measured thresholds across all subjects and frequencies, and average over subjects (red curve). In comparison, the blue curves show predictions from the PNS modeling framework. The black curve shows a hyperbolic strength-duration curve fit to the average threshold ($$$B_{rheo}(1+(2\tau_{chron}f)^{-1})$$$: $$$B_{rheo}$$$=7 mT peak, $$$\tau_{chron}$$$= 602 $$$\mu$$$s). Experimental thresholds indicate a consistent minimum at 16.9 kHz across all subjects, followed by a mild increase at higher frequencies (~36% average increase from 16.9 kHz to 66.7 kHz). This threshold behavior deviates both from the hyperbolic strength-duration curve and from our MRG model-based predictions over these frequencies. Figure 5 shows that the stimulation sites indicated by the subjects agree roughly with those predicted by our PNS model.Conclusion
We measured PNS thresholds in the head of healthy volunteers across frequencies from 200 Hz to 88.1 kHz. The average threshold at 25.3 kHz was 5.69±1.15 mT peak at coil center over four subjects, which is comparable to a previous PNS measurement in the head at this frequency[13]. Our measurements show that there is significant PNS at frequencies above 20 kHz[5,7], with a maximum PNS propensity ~17 kHz. In addition, the widely used monotonically decreasing hyperbolic strength-duration curve deviates from the data which shows a mild gradual increase in thresholds above 17 kHz. Our detailed PNS model based on the MRG model is also monotonically decreasing, suggesting that additional modeling components (e.g. additional ion channels, more nerves) may be needed to reproduce the observed behavior.Acknowledgements
We thank Jorge Chacon Caldera, Frauke Niebel, John Drago, Erica Mason, and Livia Vendramini. This research was supported by the award number R01EB028250.References
[1] Schaefer D J, Bourland J D, and Nyenhuis J A, Review of patient safety in time-varying gradient fields. J. Magn. Reson. Imaging, 2000. 12: 20-29.[2] IEC, International standard IEC 60601 medical electrical equipment. Part 2-33: Particular requirements for the basic safety and essential performance of magnetic resonance equipment for medical diagnosis. 2010, International Electrotechnical Commission (IEC).
[3] Irnich, W., & Schmitt, F. (1995). Magnetostimulation in MRI. Magnetic resonance in medicine, 33(5), 619-623.
[4] Schmale, I., Gleich, B., Schmidt, J., Rahmer, J., Bontus, C., Eckart, R., ... & Borgert, J. (2013, March). Human PNS and SAR study in the frequency range from 24 to 162 kHz. In 2013 International Workshop on Magnetic Particle Imaging (IWMPI) (pp. 1-1). IEEE.
[5] Weinberg, I. N., Stepanov, P. Y., Fricke, S. T., Probst, R., Urdaneta, M., Warnow, D., ... & Reilly, J. P. (2012). Increasing the oscillation frequency of strong magnetic fields above 101 kHz significantly raises peripheral nerve excitation thresholds. Medical physics, 39(5), 2578-2583.
[6] Saritas, E. U., Goodwill, P. W., Zhang, G. Z., & Conolly, S. M. (2013). Magnetostimulation limits in magnetic particle imaging. IEEE transactions on medical imaging, 32(9), 1600-1610.
[7] Versteeg, E., Klomp, D. W., & Siero, J. C. (2022). A silent gradient axis for soundless spatial encoding to enable fast and quiet brain imaging. Magnetic Resonance in Medicine, 87(2), 1062-1073.
[8] Davids M, Guérin B, Malzacher M, Schad L R, and Wald L L, Predicting magnetostimulation thresholds in the peripheral nervous system using realistic body models. Sci. Rep., 2017. 7.
[9] Klein V, Davids M, Wald L L, Schad L R, and Guérin B, Sensitivity analysis of neurodynamic and electromagnetic simulation parameters for robust prediction of peripheral nerve stimulation. Phys. Med. Biol., 2019. 64: 015005.
[10] Davids M, Guérin B, vom Endt A, Schad L R, and Wald L L, Prediction of peripheral nerve stimulation thresholds of MRI gradient coils using coupled electromagnetic and neurodynamic simulations. Magn. Reson. Med., 2019. 81: 686-701.
[11] Mattingly, E., Mason, E., Sliwiak, M., & Wald, L. L. (2022). Drive and receive coil design for a human-scale MPI system. International Journal on Magnetic Particle Imaging IJMPI, 8(1 Suppl 1).
[12] McIntyre C C, Richardson A G, and Grill W M, Modeling the excitability of mammalian nerve fibers: Influence of afterpotentials on the recovery cycle. J. Neurophysiol., 2002. 87: 995-1006.
[13] Ozaslan, A. A., Utkur, M., Canpolat, U., Tuncer, M. A., Oguz, K. K., & Saritas, E. U. (2022). PNS limits for human head-size MPI systems: Preliminary results. International Journal on Magnetic Particle Imaging IJMPI, 8(1 Suppl 1).
Figures