3922
Simulation of B0 Magnetic Field Conditions in the Human Heart for Improved B0 Shimming in Cardiovascular MRI1Department of Biomedical Engineering, Columbia University in the City of New York, New York, NY, United States, 2Seymour, Paul and Gloria Milstein Division of Cardiology, Department of Medicine, Columbia University Irving Medical Center and NewYork-Presbyterian Hospital, New York, NY, United States, 3Department of Radiology, Columbia University Irving Medical Center, New York, NY, United States, 4MR Clinical Solutions, GE HealthCare, New York, NY, United States
Synopsis
Keywords: Myocardium, Cardiovascular
Motivation: Balanced SSFP sequences in cardiovascular MRI suffer from dark band artifacts due to B0 inhomogeneity. Limited detail of in vivo B0 conditions apparent in various population groups impede the development of optimal cardiac B0 shim methods.
Goal(s): To validate our recently-published high-resolution B0 simulation approach of B0 conditions in the human heart based on structural CT images.
Approach: Validation was achieved through direct comparison of B0 conditions computationally derived from structural CT images, vs. in vivo B0 maps obtained experimentally on the same five subjects.
Results: Excellent agreement occurred between simulated and in vivo B0 maps, with an average spatial correlation of 0.91.
Impact: The validated cardiac B0 simulation from readily-available structural CT images enables characterization of B0 conditions in populations with wide-spread demographics of age, sex, height, weight and the development of advanced B0 shimming methods to improve diagnostic accuracy in cardiovascular MRI.
Introduction
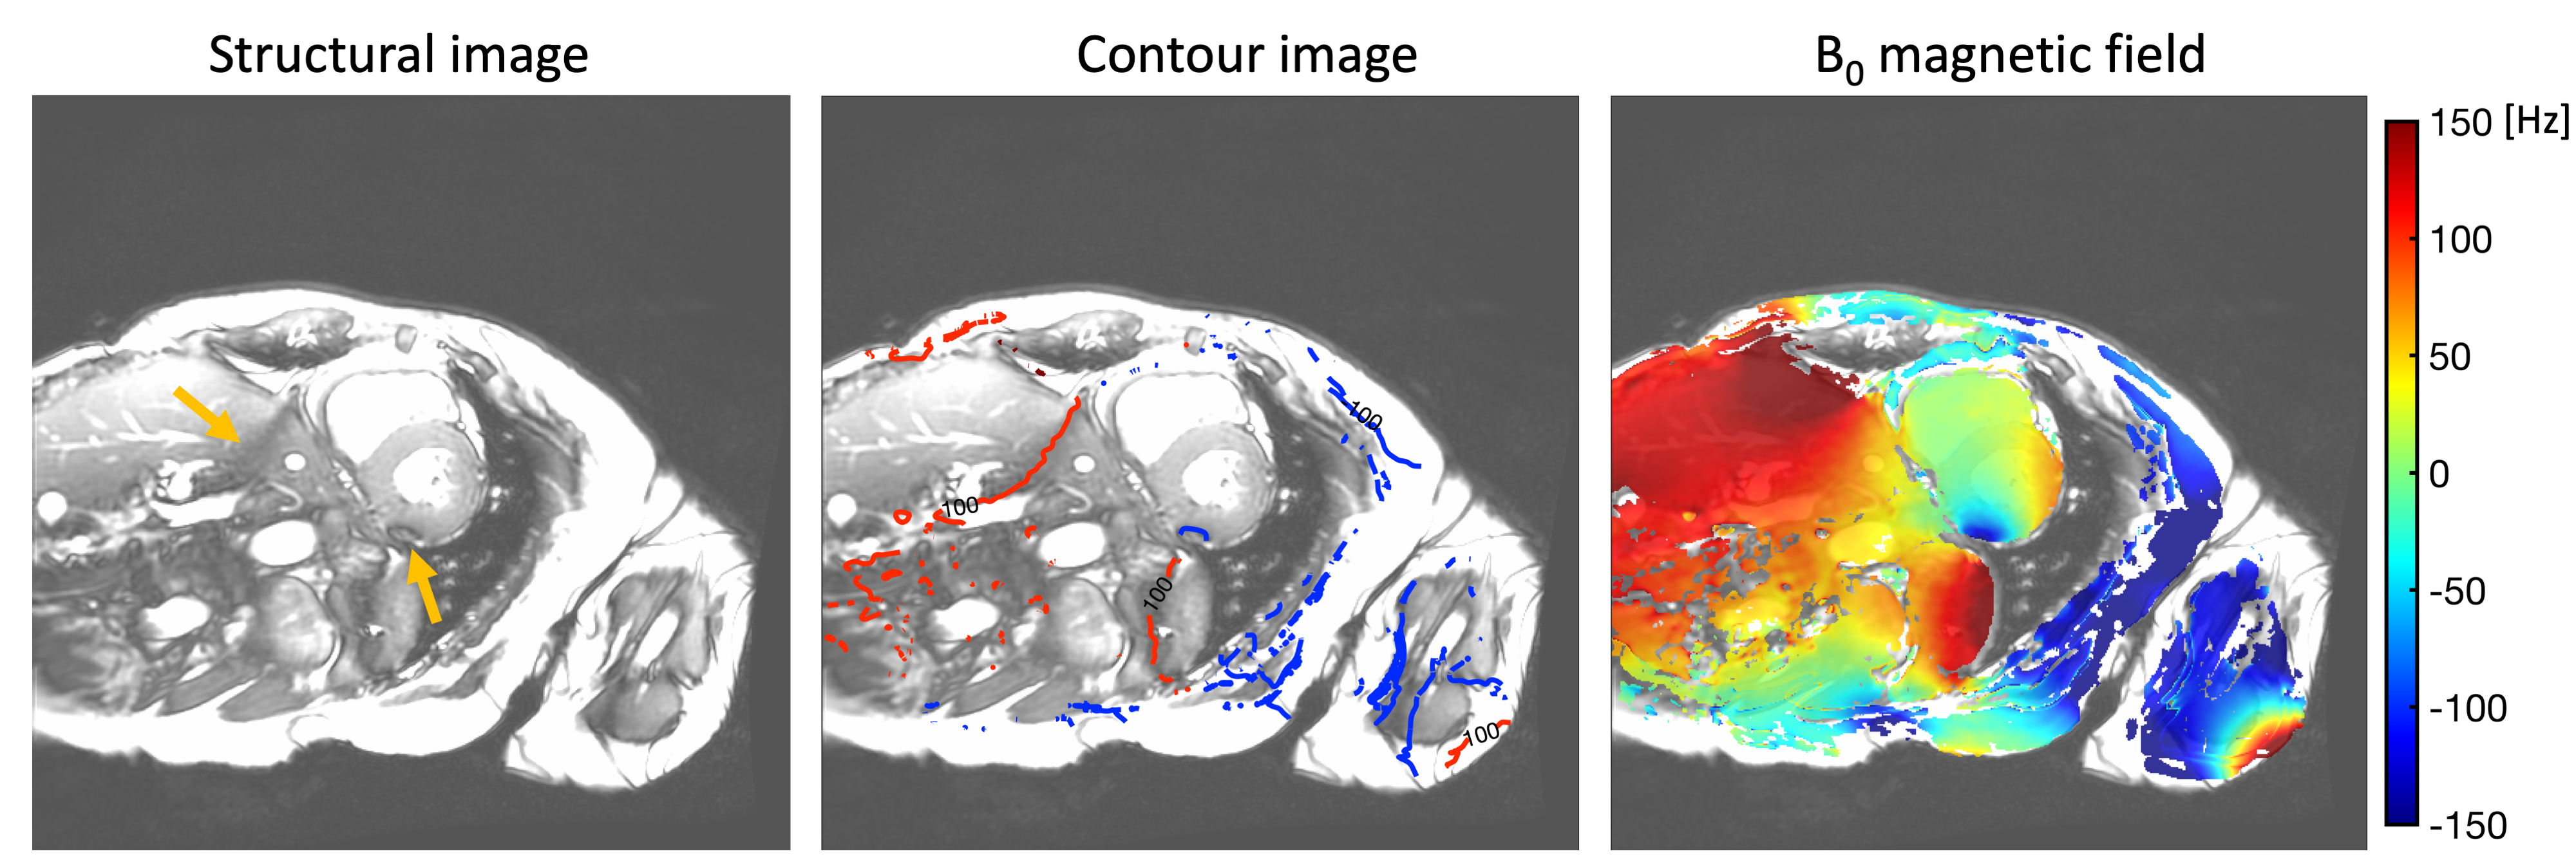
The dark band artifact, or signal loss around the myocardium caused by B0 inhomogeneity, is a common artifact in cardiovascular MRI, which is especially problematic with a balanced steady-state free precession (bSSFP) sequence1 (Figure 1). The development of optimal cardiac B0 shim technology and strategies requires a detailed understanding of B0 conditions in the heart, as well as a large sample size for analysis of demographic characteristics in different populations. Simulation of B0 magnetic fields induced by magnetic susceptibility distributions derived from structural images provides an excellent solution for obtaining high-resolution B0 data under the assumption that both the geometry and numerical value of the susceptibility conditions are known2-5. We recently introduced the simulation of cardiac B0 conditions from chest-abdomen-pelvis CT images6. In this study, we aim to validate our recently published B0 simulation approach by comparing it with in vivo measurements obtained from the same subjects.Methods
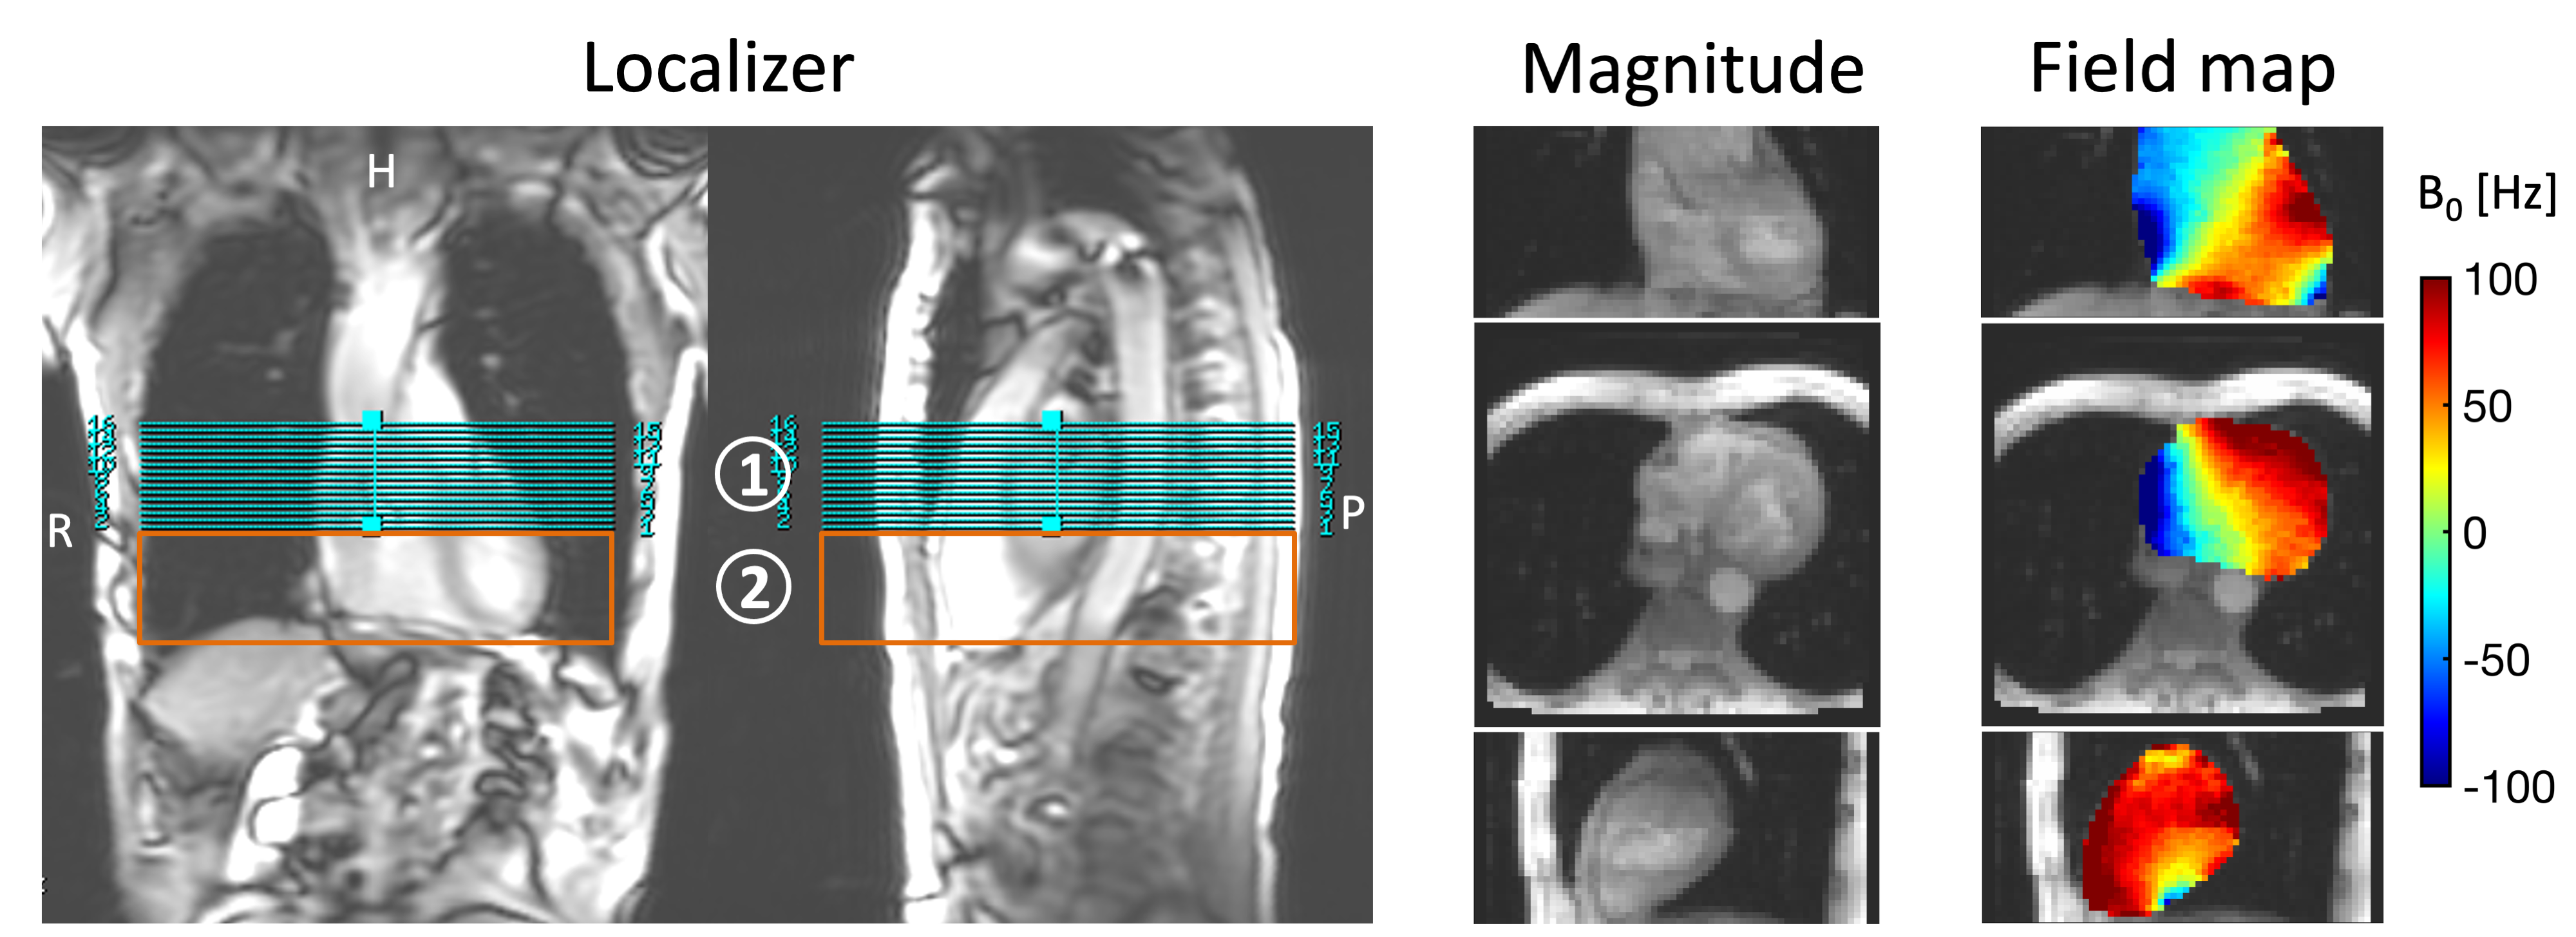
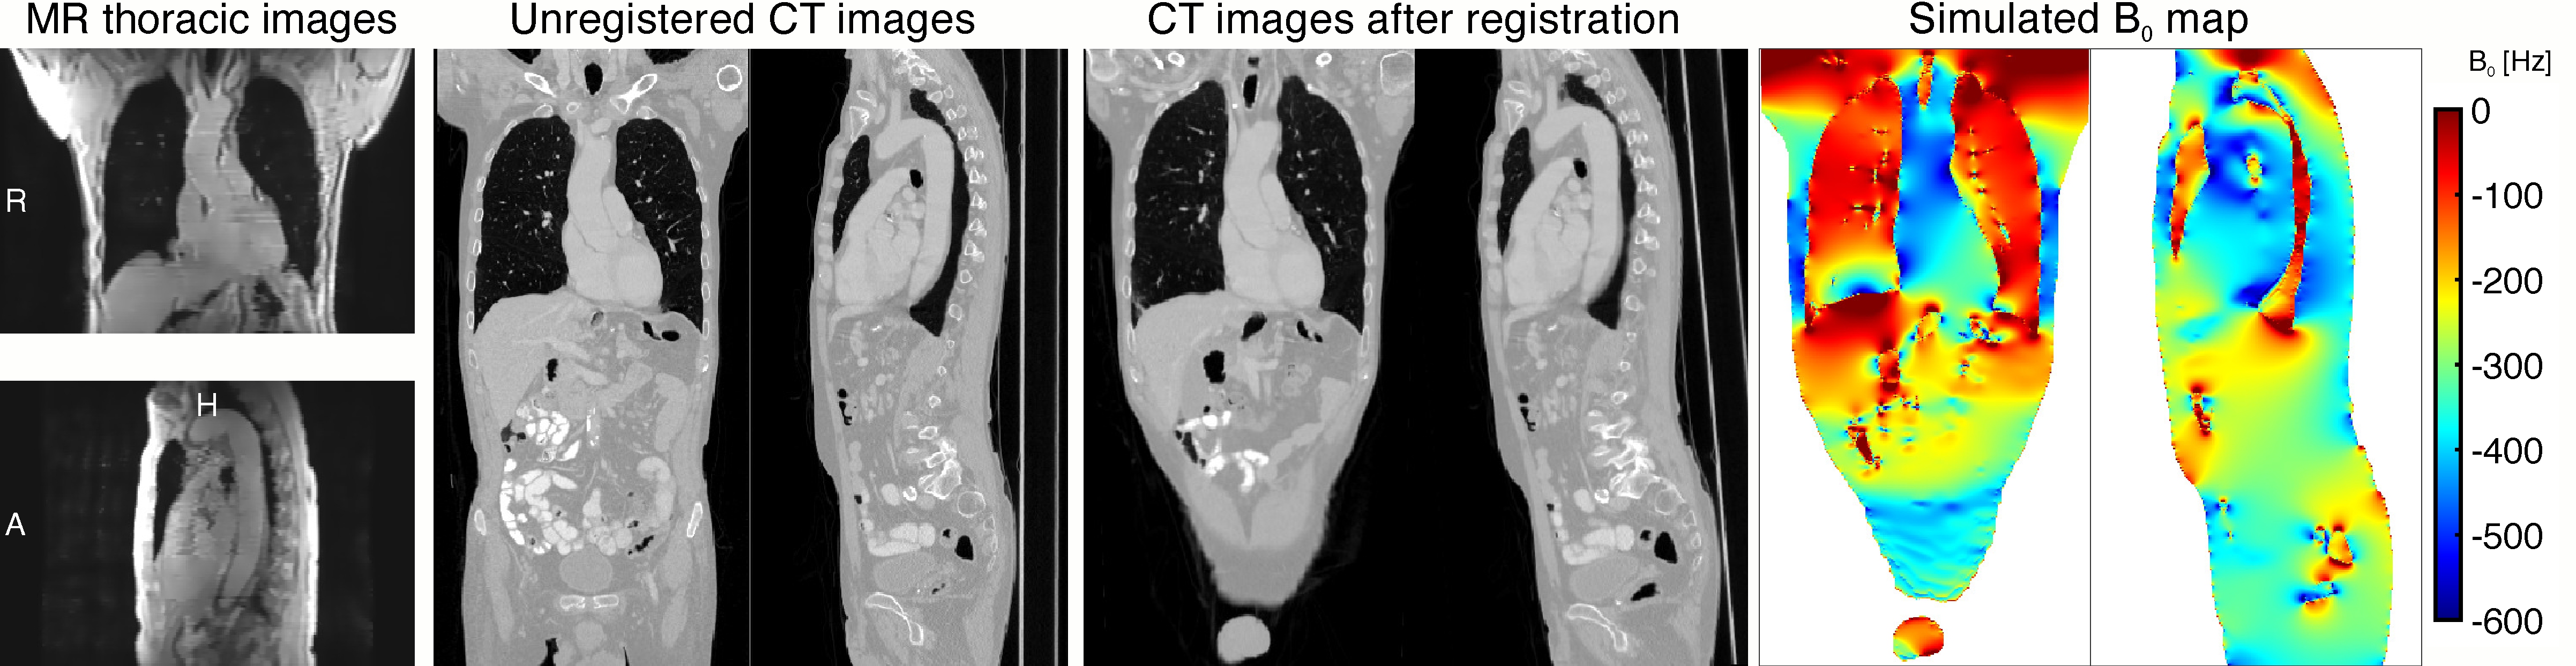
This study was conducted by scanning the same patients via MRI who had been prescribed clinically-indicated chest-abdomen-pelvis CT scans at the NewYork-Presbyterian Hospital with the approval of the Institutional Review Board at Columbia University. In vivo B0 maps of the human heart were acquired from five subjects (males: 3, females: 2, age: 53 ± 19) on a GE Premier 3T scanner (GE Healthcare, Waukesha, WI, U.S.). This sequence is based on a 2D ECG-triggered multi-echo gradient echo sequence under breath-hold (10-20 s) with parameters: TR/TE1/TE2/TE3 = 6.1/2.1/3.2/4.4 ms and in-plane spatial resolution of 3.6–4.4 mm. We used two concatenated scans at high spatial resolution along the foot-head orientation (slice thickness: 3.4 mm) to cover the superior and inferior part of the heart, similar to the approach we published recently7 (Figure 2).In order to align the geometry difference between CT and MR scans regarding the patient positioning and orientation, rigid-body registration was performed by matching MR magnitude images from an additional thoracic gradient echo scan or B0 map sequence, with the CT images, which were then warped inversely to the coordinate system of the in vivo MRI acquisition. The CT images were then resampled to 1.5 mm isotropic and used in our recently published method6 to simulate the distribution of the B0 magnetic field induced inside the human body (Figure 3).
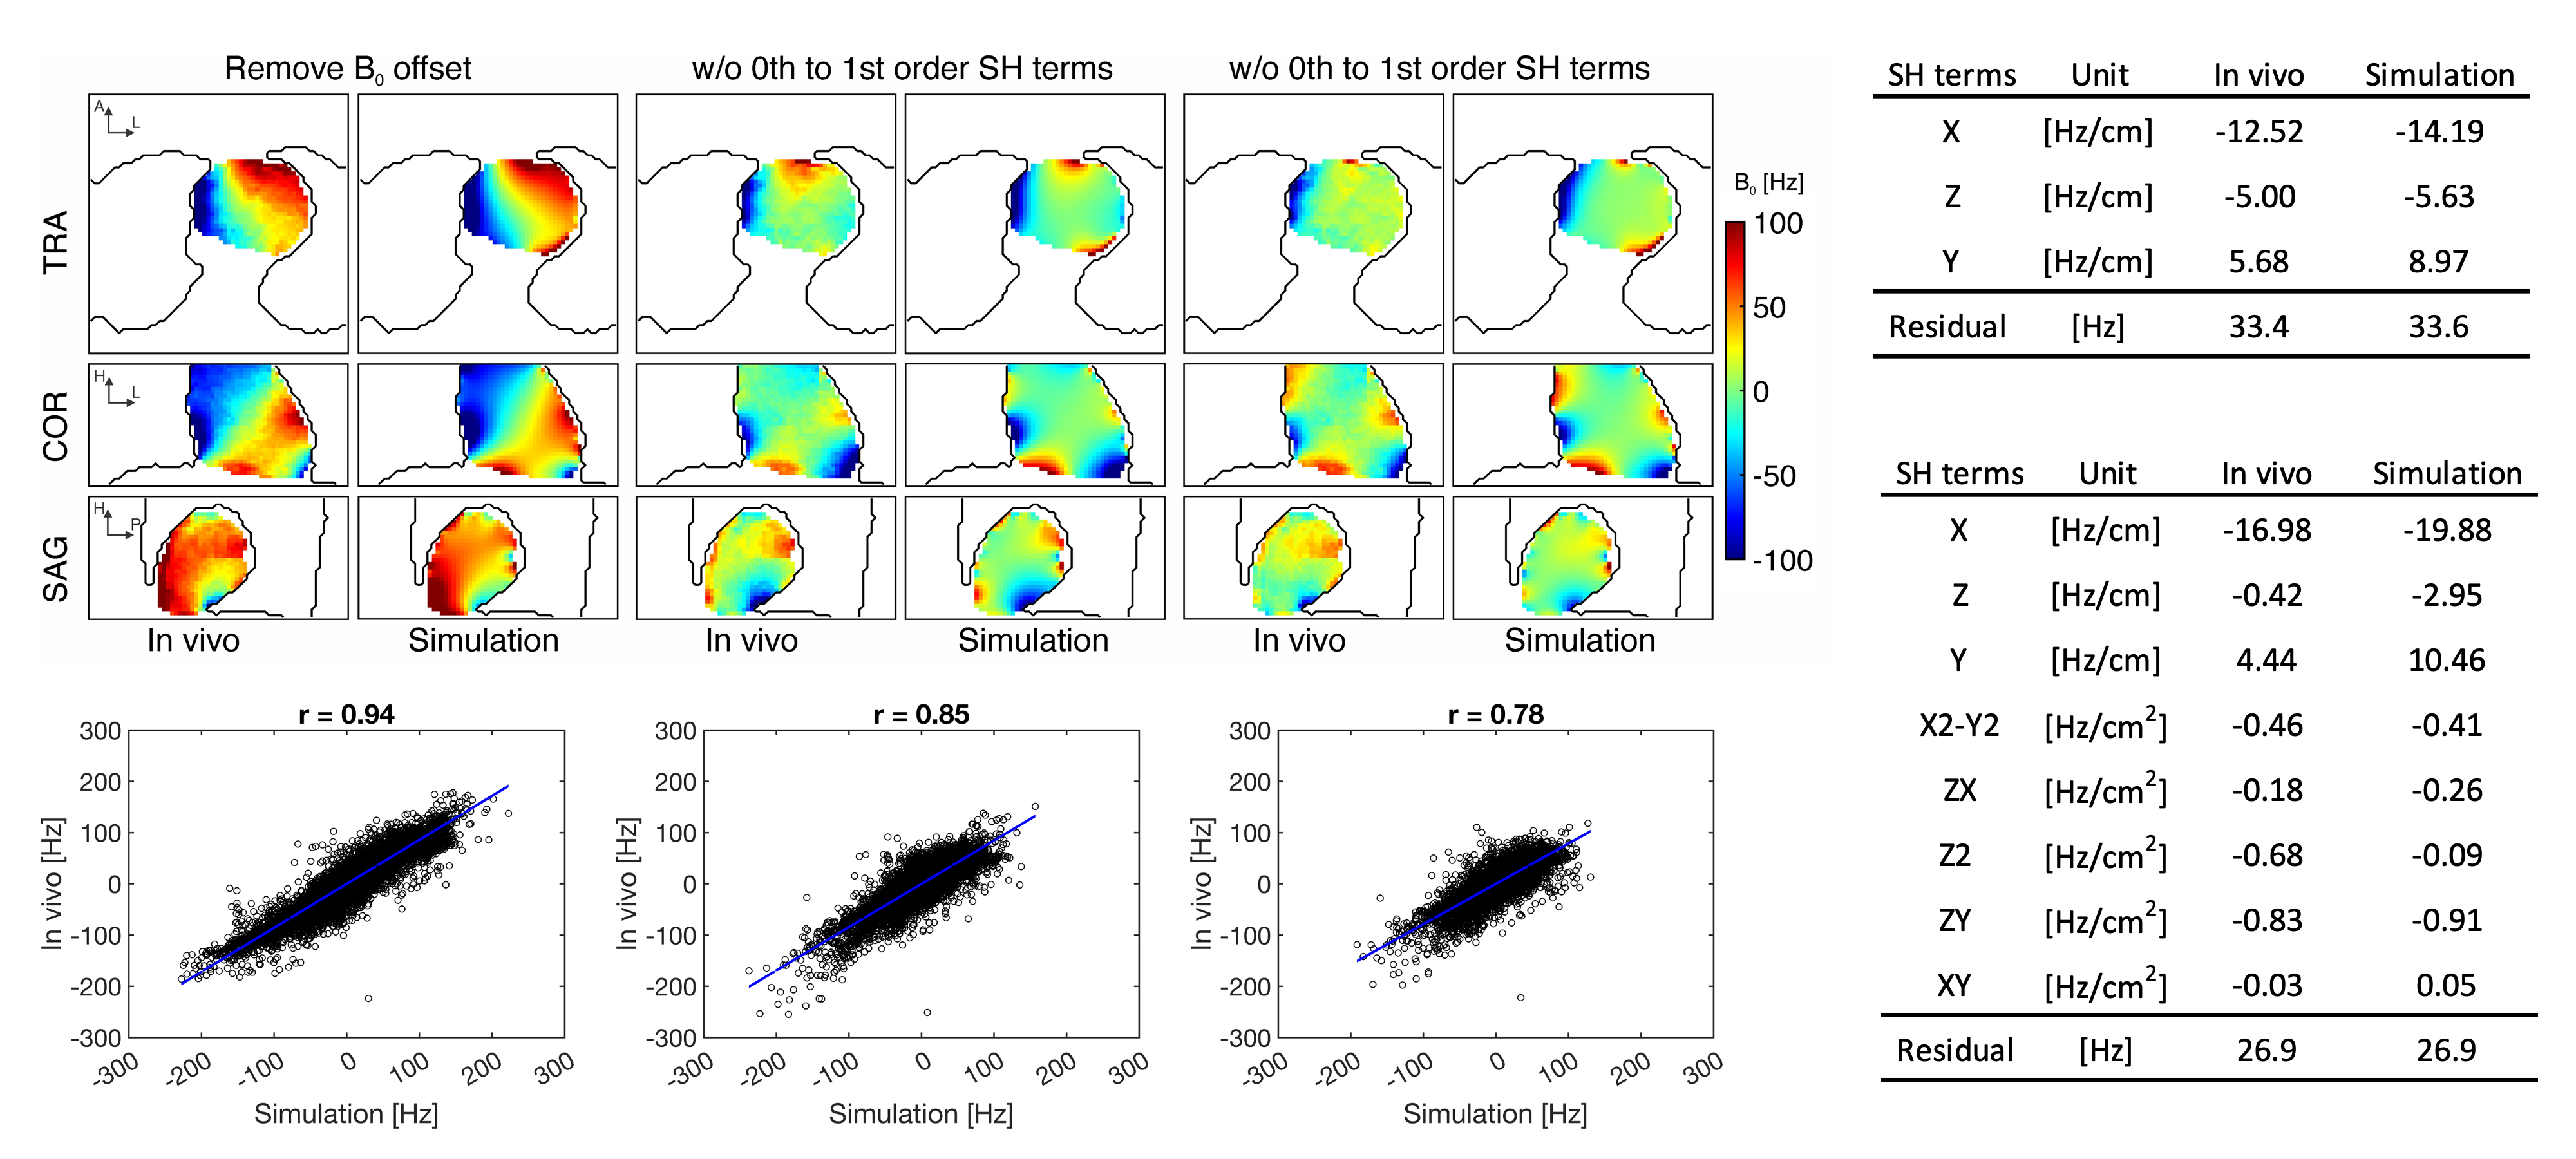
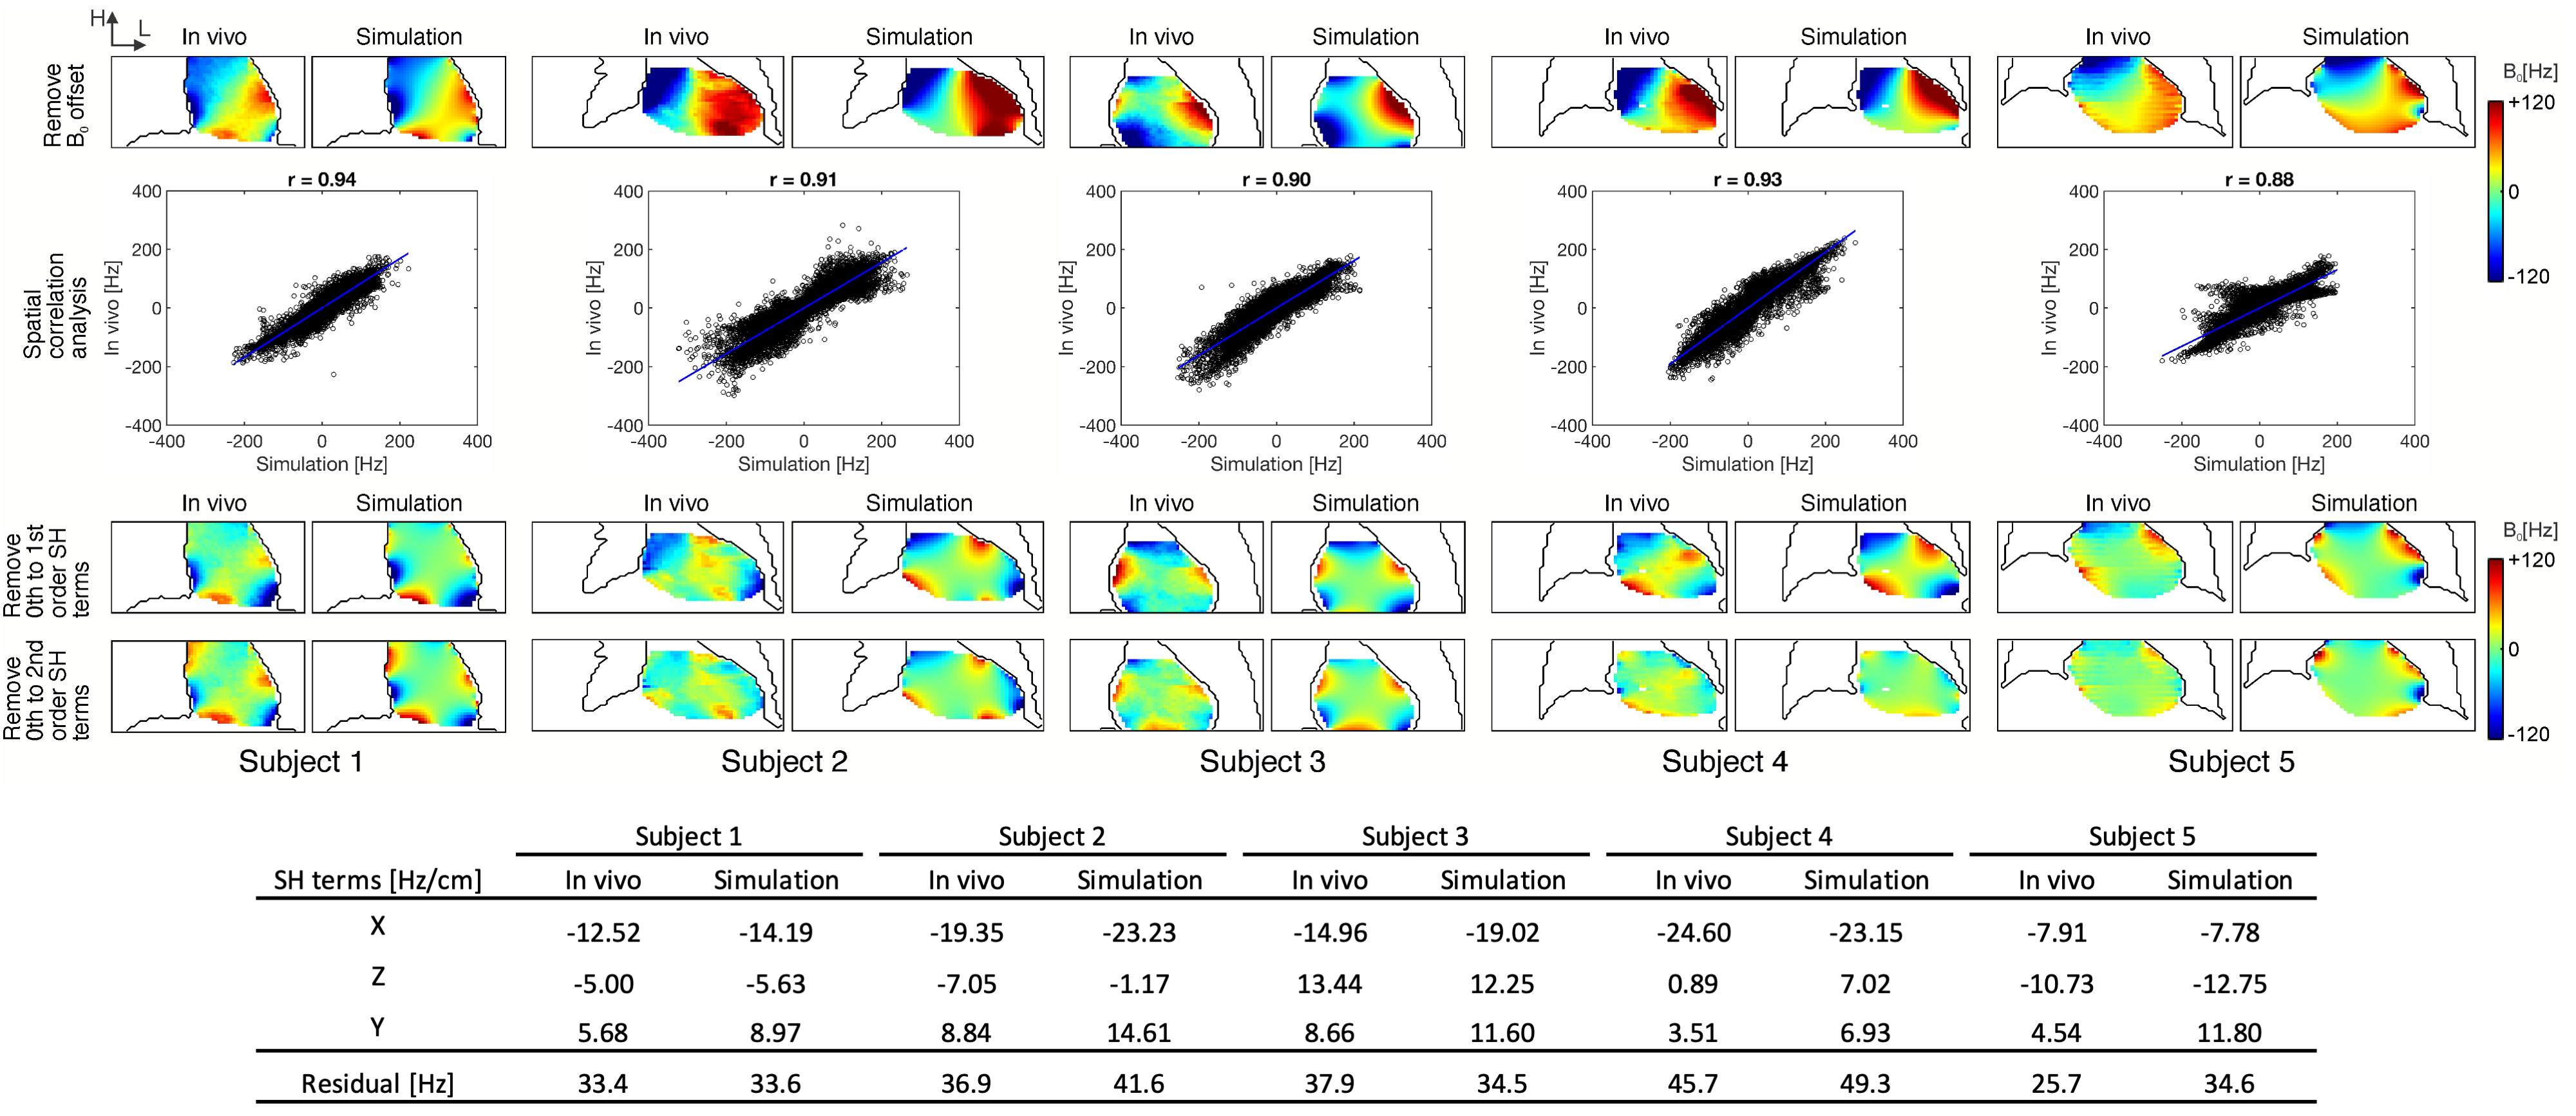
The simulated field maps were resampled to the same resolution and coordinates as the in vivo measurements before comparison. Due to the center frequency adjustment during MR acquisition but not in the simulation, the resultant inconsistent B0 offsets of both field maps were removed for fair comparison. To assess their similarity, a correlation coefficient was calculated from the pairwise field values within the heart between simulation and in vivo measurement8. The similarity of local field patterns was evaluated after linear shim (removing 0th to 1st order spherical harmonic (SH) terms) and 2nd order shim (removing 0th to 2nd order SH terms) analysis. Also, the SH coefficients and standard deviation of the residual field maps after corresponding shim analysis were compared (Figure 4).
Results
Simulated B0 maps show excellent agreement with in vivo measured B0 maps without B0 offsets and the average correlation between them is strong with r = 0.91 (Figure 5). After 1st and 2nd order shim analyses, both field maps show highly similar local B0 field patterns, especially near cardiophrenic angles and in the heart's inferior region, as well as the standard deviations of the residual fields. Across all subjects, both simulations and in vivo measurements indicate the same polarity of the SH coefficients following linear shim analysis, as well as similar inhomogeneity in the residual fields.Discussion
The present study validates the B0 simulation approach in the heart using CT structural images with an excellent agreement between the simulated B0 maps and those acquired in vivo from the same subjects. This high degree of consistency in the fields with and without shim analysis suggests the underlying causes of B0 inhomogeneity within the heart, as well as the feasibility of using simulated B0 maps for shim analysis. It was noted that there were some differences in the fields which could be attributed to the geometry difference due to different respiratory status between CT and MR scan as well as blood flow during the B0 acquisition. On the basis of CT images from a large sample size of subjects, the validated simulation method will be applied to investigate cardiac B0 conditions at a population level. We expect this analysis to shed light on the cardiac B0 conditions across subjects and to provide the basis for the development of optimal cardiac B0 shim techniques.Acknowledgements
We acknowledge seed funding support from Columbia University's Research Initiatives in Science & Engineering (RISE) competition, started in 2004 to trigger high-risk, high-reward, and innovative collaborations in the basic sciences, engineering, and medicine. www.columbia.edu/rise.References
1. Schär M, Kozerke S, Fischer SE, Boesiger P. Cardiac SSFP imaging at 3 Tesla. Magn Reson Med. 2004;51(4):799-806.
2. Jenkinson M, Wilson JL, Jezzard P. Perturbation method for magnetic field calculations of nonconductive objects. Magn Reson Med. Sep 2004;52(3):471-7. doi:10.1002/mrm.20194
3. Salomir R, de Senneville BD, Moonen CT. A fast calculation method for magnetic field inhomogeneity due to an arbitrary distribution of bulk susceptibility. Concepts in Magnetic Resonance Part B. 2003;19(1):26-34.
4. Koch KM, Papademetris X, Rothman DL, de Graaf RA. Rapid calculations of susceptibility-induced magnetostatic field perturbations for in vivo magnetic resonance. Phys Med Biol. Dec 21 2006;51(24):6381-402. doi:10.1088/0031-9155/51/24/007
5. Marques J, Bowtell R. Application of a Fourier‐based method for rapid calculation of field inhomogeneity due to spatial variation of magnetic susceptibility. Concepts in Magnetic Resonance Part B. 2005;25(1):65-78.
6. Shang Y, Theilenberg S, Terekhov M, Mattar W, Peng B, Jambawalikar SR, Schreiber LM, Juchem C. High resolution simulation of B0 field conditions in the human heart from segmented computed tomography Images. NMR Biomed. 2022;35(8):e4739.
7. Shang Y, Theilenberg S, Gajdošík M, Schreiber LM, Juchem C. High resolution simulation and measurement demonstrate oscillatory spatiotemporal B0 fluctuations across the human cardiac cycle. Magn Reson Med. 2023. doi:10.1002/mrm.29831
8. Juchem C, Muller-Bierl B, Schick F, Logothetis NK, Pfeuffer J. Combined passive and active shimming for in vivo MR spectroscopy at high magnetic fields. J Magn Reson. 2006;183(2):278-289.
Figures