3911
MR fingerprinting for quantification of brain amyloid burden: from development to prospective multi-site external validation1Dept. of Radiology, Juntendo University, Tokyo, Japan, 2Dept. of Radiology, The University of Tokyo, Tokyo, Japan, 3Athinoula A. Martinos Center for Biomedical Imaging, Massachusetts General Hospital, Boston, MA, United States, 4Dept. of Radiology, Harvard Medical School, Boston, MA, United States, 5Dept. of Diagnostic Imaging and Nuclear Medicine, Kyoto University, Kyoto, Japan, 6Milliman Inc, Tokyo, Japan, 7Plusman LLC, Tokyo, Japan, 8Siemens Healthcare Japan KK, Tokyo, Japan, 9Siemens Healthcare GmbH, Erlangen, Germany, 10Siemens Medical Solutions, New York, NY, United States, 11Dept. of Neurology, Juntendo University, Tokyo, Japan, 1212. Medical Center for Dementia, Juntendo University, Tokyo, Japan, 13Dept. of Neurosurgery, Juntendo University, Tokyo, Japan, 14Division of Nuclear Medicine, Dept. of Radiology, Juntendo University, Tokyo, Japan, 15Department of Regenerative Systems Neuroscience, Human Brain Research Center, Kyoto University, Kyoto, Japan, 16Dept. of Psychiatry, Kyoto University, Kyoto, Japan, 17Harvard/MIT Health Sciences and Technology, Massachusetts Institute of Technology, Cambridge, MA, United States, 18Dept. of Human Health Sciences, Kyoto University, Kyoto, Japan
Synopsis
Keywords: Alzheimer's Disease, Alzheimer's Disease, Biomarker
Motivation: A non-invasive amyloid beta (Aβ) imaging technique is needed for objective diagnosis and treatment monitoring of Alzheimer’s disease.
Goal(s): To develop and validate an MRF-based method quantifying brain Aβ.
Approach: A framework with efficient MRF data acquisition, neural network decoding, and atlas-based segmentation was implemented. A prospective analysis was conducted on external dataset to evaluate its generalizability, repeatability, and correlation with Aβ-PET measurements and clinical cognitive function tests.
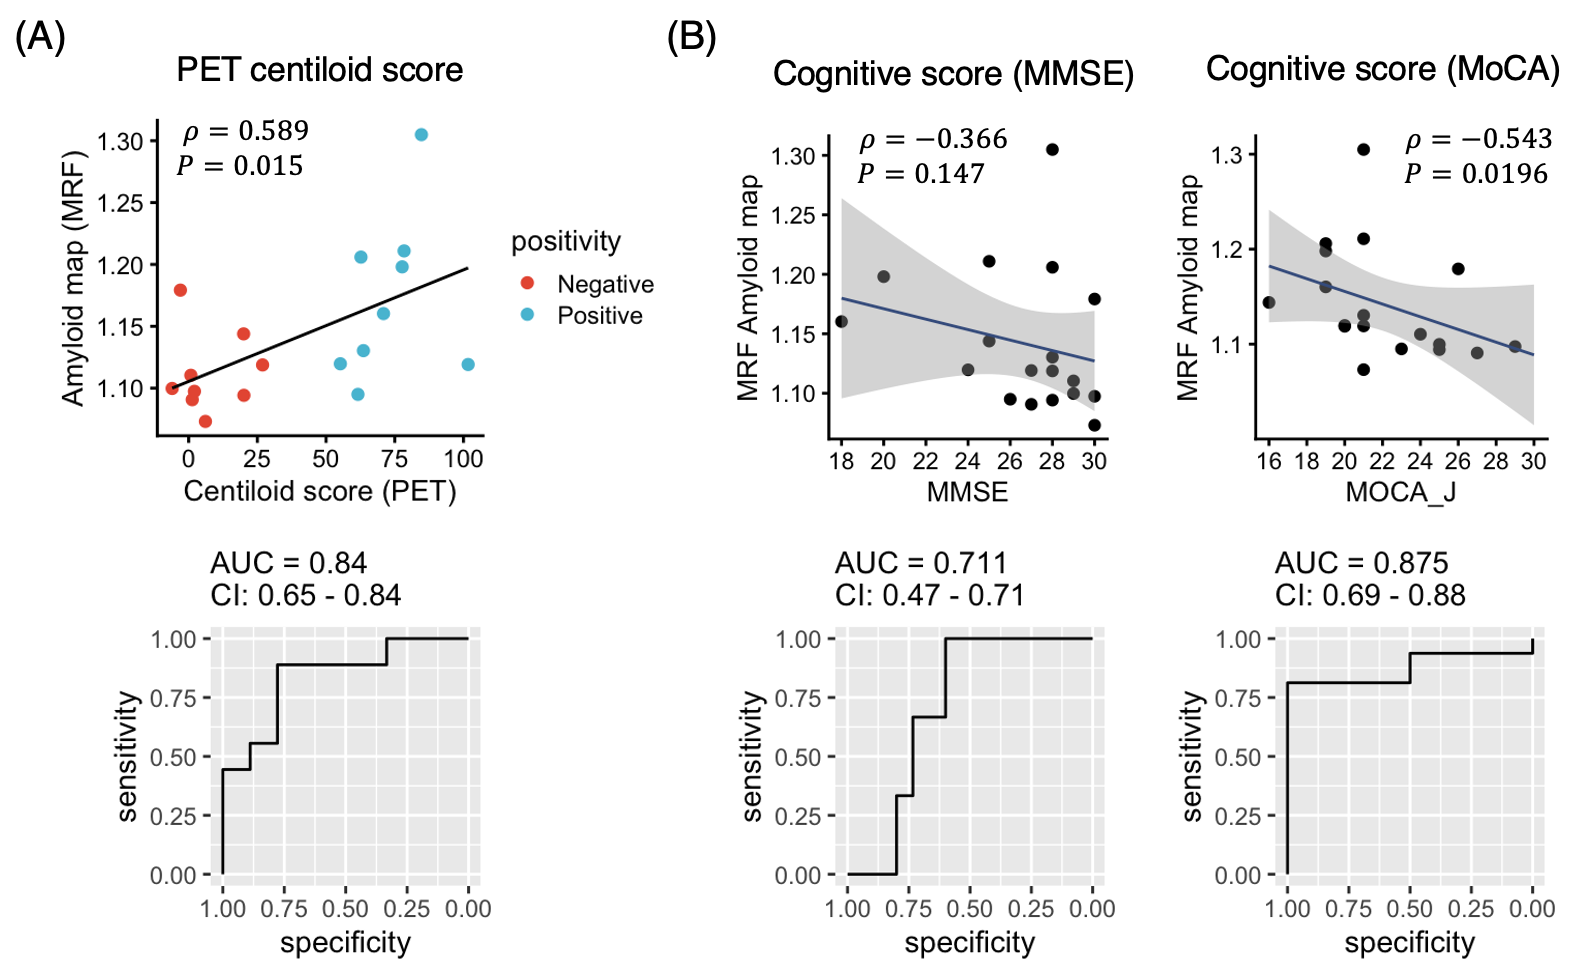
Results: The method showed high repeatability (CV<2%), significant correlation with Aβ-PET measurements and Montreal Cognitive Assessment test (p=0.015 and 0.020, respectively), and discriminated subject-level Aβ positivity with an AUC of 0.84 on external test set.
Impact: The proposed framework is compatible with clinical 3T MRI and offers ‘one-stop’ examination in 10 minutes for patients with cognitive decline by providing structural MRI and Aβ-quantification. Its non-invasive nature facilitates longitudinal evaluation and correlates with Aβ-PET and cognitive function.
Introduction
Amyloid beta (Aβ)-PET is important for objective detection of Aβ deposition and definitive diagnosis of Alzheimer’s disease1, 2. However, limited access, high cost, undesirable injections, and radiation exposure restrict the applicability of Aβ-PET scans. As new amyloid-reducing drugs are being developed, there is a growing need for non-invasive Aβ imaging techniques3.In this proof-of-concept study, we developed a framework that utilizes efficient MR fingerprinting (MRF)4 data acquisition and complex-valued neural network5 based decoding to quantify Aβ in the brain and demonstrated its generalizability and clinical value in a prospective, multi-site setting.
Methods
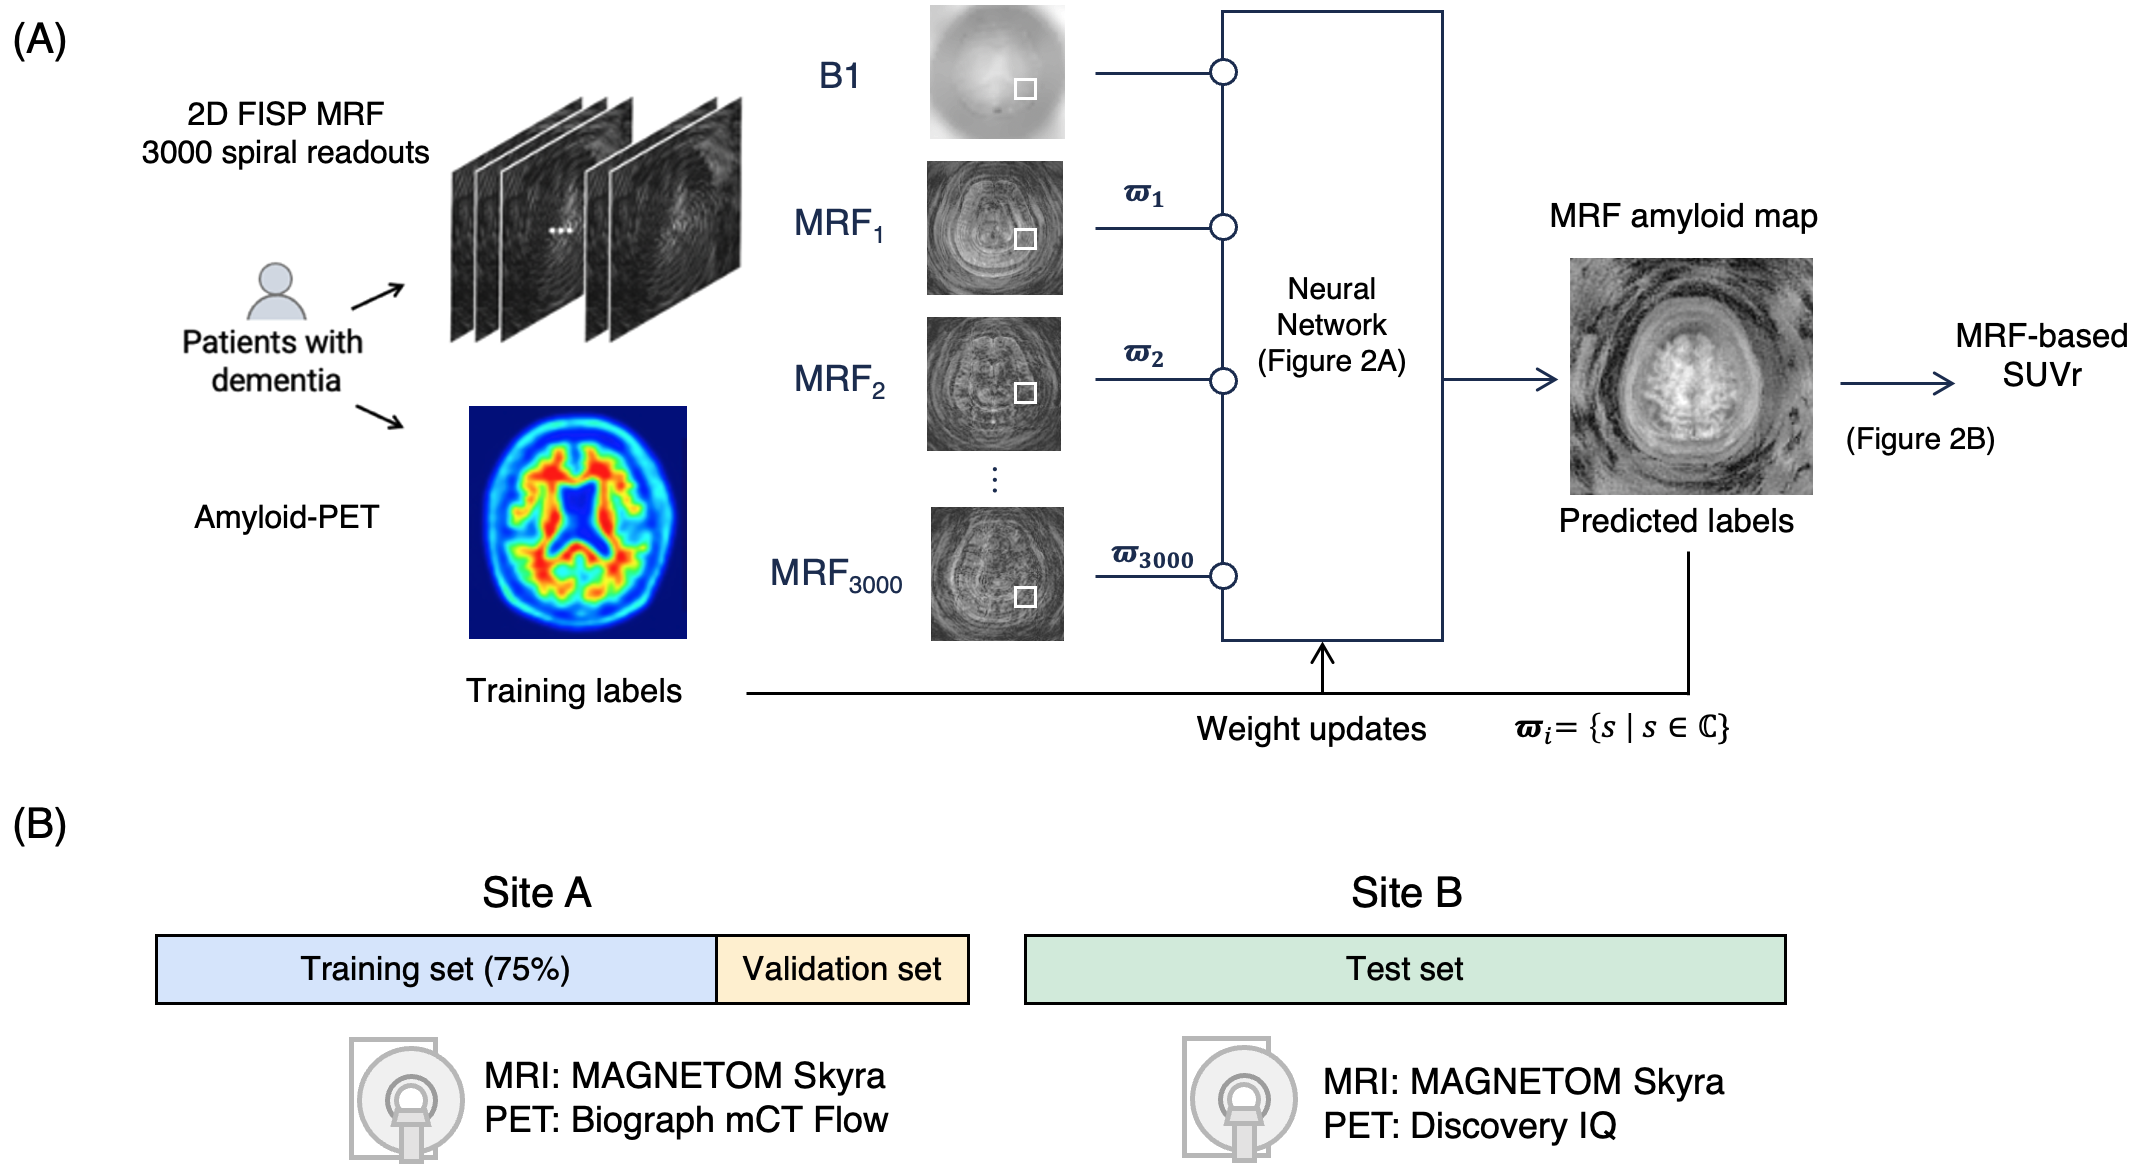
Data acquisitionThe study design and method overview are shown in Figure 1. This prospective multi-site study was approved with each local IRB and included participants who had undergone or will undergo Aβ-PET imaging within a year. Twenty-three (13 men; age, 78.5±4.4; MMSE [Mini-mental state examination], 22.9 ± 3.4) and 21 (12 men; age 68.7±9.7; MMSE, 27.0±3.4) participants were enrolled from site A and B, respectively.
For site A, Aβ-PET scans were performed on a PET-CT scanner (Biograph mCT Flow, Siemens Healthcare, Knoxville/TN, USA) with a standard protocol after 18F-florbetapir injection (Amyvid, PDRadiopharma Inc.)6, 7. For site B, Aβ-PET scans were performed on a PET-CT scanner (Discovery IQ, GE Healthcare, Waukesha/WI, USA) with a standard protocol after 18F-flutemetamol injection (Vizamyl, Nihon Medi-Physics, Inc). At both sites, MRF data were acquired on a 3T MRI system (MAGNETOM Skyra, Siemens Healthcare, Erlangen, Germany) using a 20-channel head coil with a prototype MRF 2D FISP sequence8 with 3000 spiral readouts and B1 correction9. Spatial resolution was matched to Aβ-PET (i.e., 2×2 mm) and the entire brain was covered in 9.5 min.
Image preprocessing
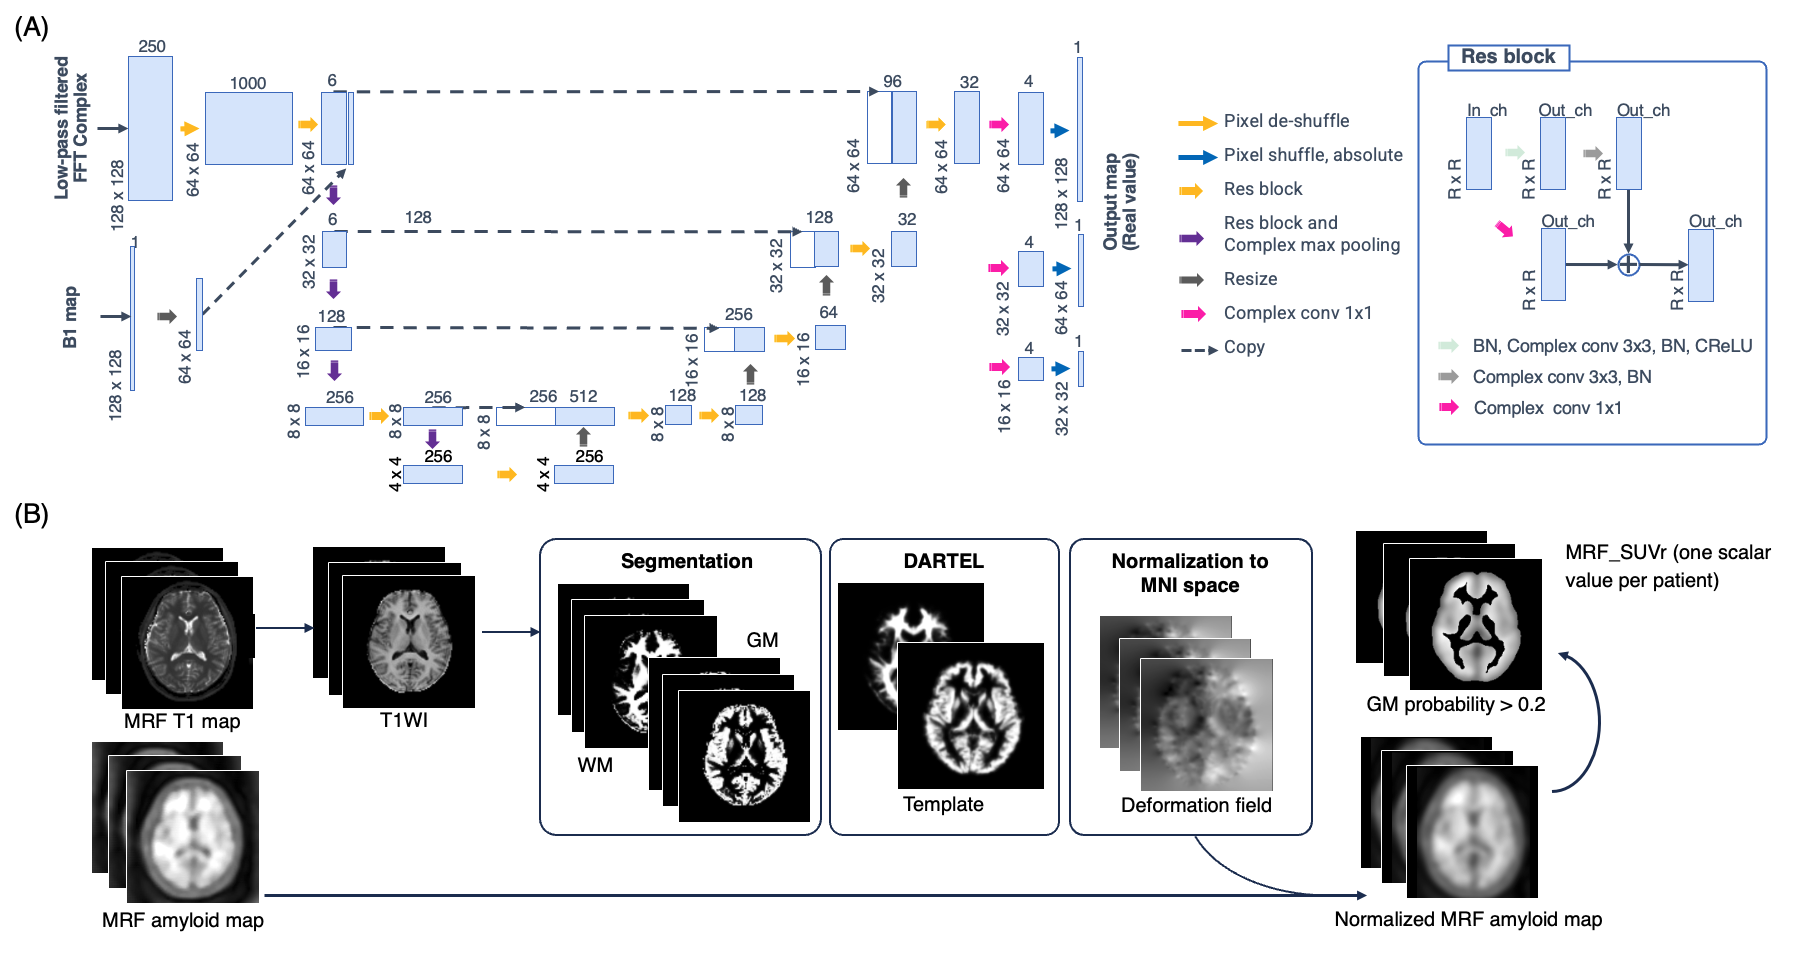
MRF T1, T2, and B1 maps were reconstructed off-line. Aβ-PET images were co-aligned to the MRF space using brain imaging software (SPM12, UCL) in MATLAB (MATLAB2019a, Mathworks, Natick/MA, USA). Brain template registration pipeline for automated calculation of regional amyloid load was implemented (Figure 2), and subject-wiseAβ positivity was determined using predetermined region-of-interests based on Aβ-PET literature10.
Network architecture and Training Procedure
The network architecture is illustrated in Figure 2. We utilized a modified U-net model11 to design an inverse mapping function to convert the MRF signals to their corresponding Aβ burden. Each model was trained by feeding Aβ-PET image slices with the corresponding MRF data from each training subject slice-by-slice using training data from site A. The weighted mean squared error with the corresponding Aβ-PET images was calculated as the loss function. The number of training epochs was 200, and the optimizer was Ada-belief12 with the default parameter set.
Performance evaluation
Site A data was used as training set (75%) and for validation set (25%). Site B data was used as test set (Figure 1). Test-retest repeatability was assessed based on coefficient of variation and intraclass correlation coefficient. Correlation with Aβ-PET-based measurements (i.e., centiloid scale, VIZ Calc, Nihon Medi-Physics, Inc)13 and the clinical cognitive function test including MMSE and MoCA (Montreal Cognitive Assessment) was assessed.
Results
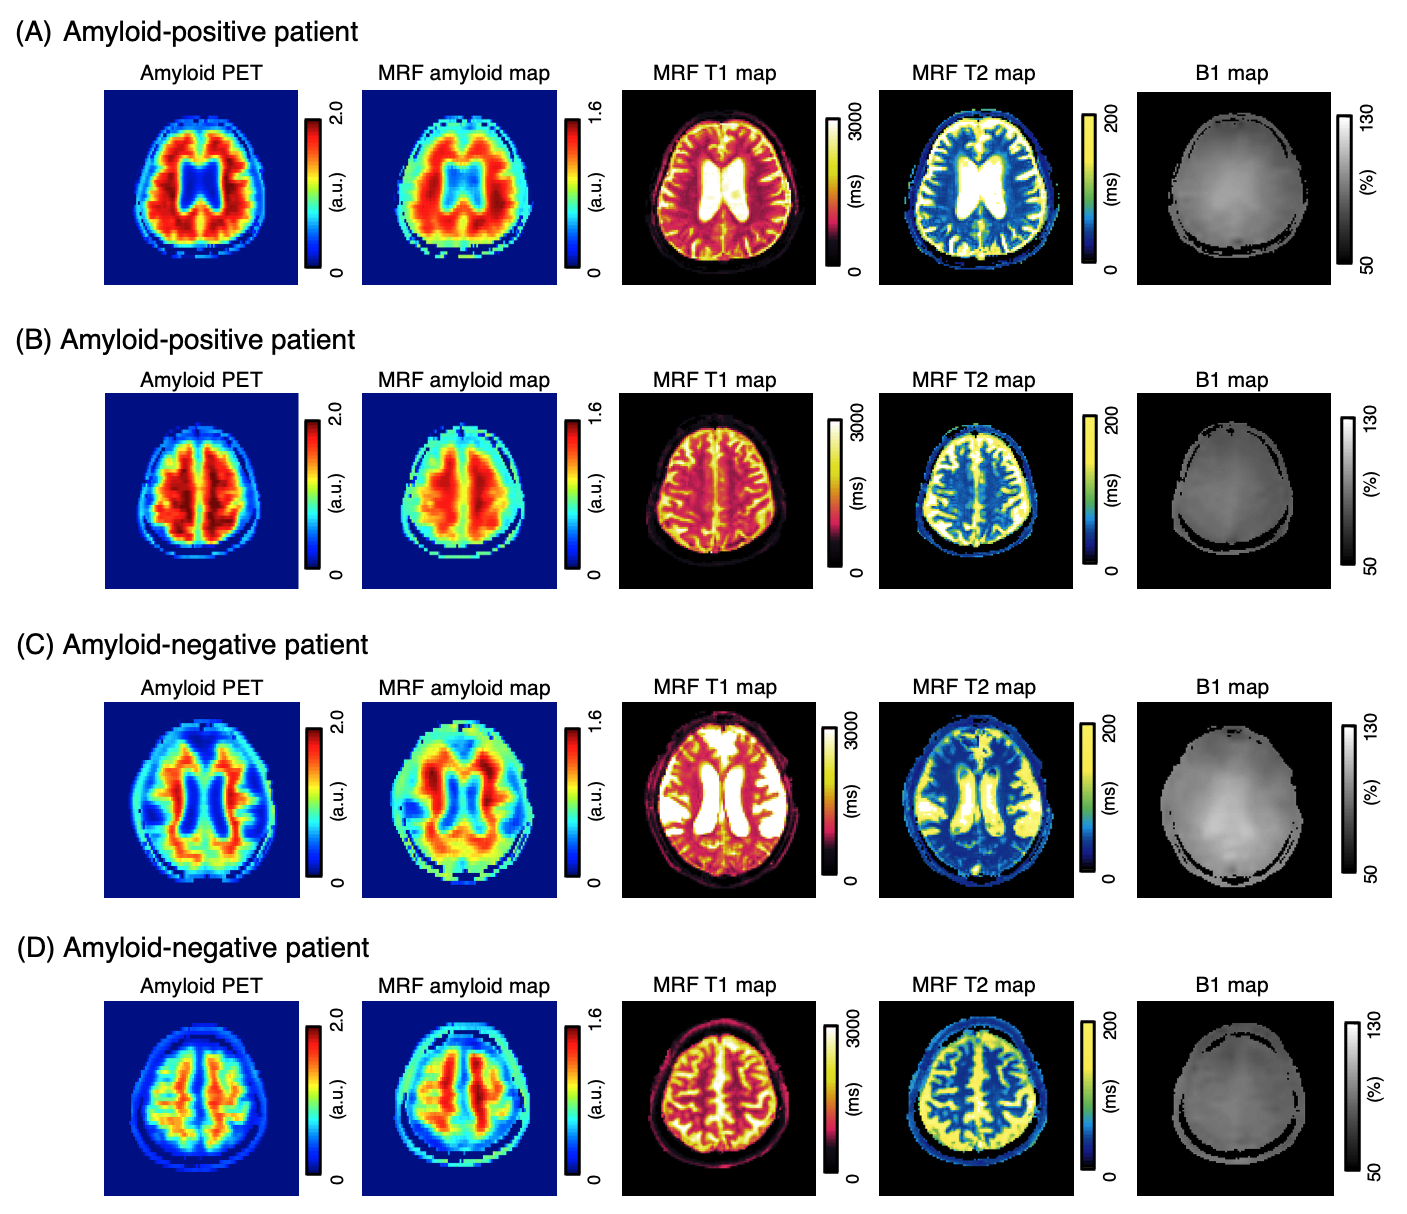
Representative casesRepresentative outputs are shown in Figure 3. The outputs were visually similar to those of the acquired Aβ-PETimages.
Repeatability analysis
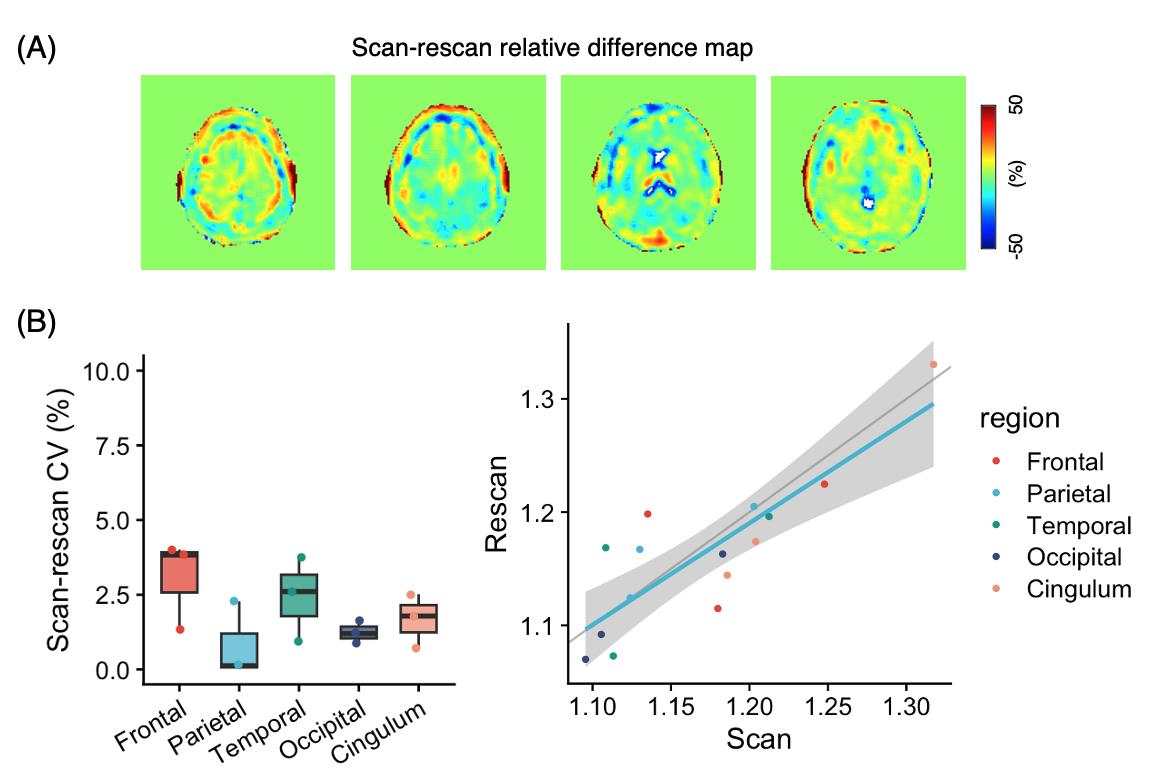
The scan-rescan relative difference maps, linear plots and Bland–Altman plots are shown in Figure 4. The CVs was 1.8 ± 1.3 [0.9–2.6]% and ICC(2,1) was 0.84 (95%CI, 0.60–0.94), indicating high repeatability14.
External validation on test set: Comparison with amyloid PET and cognitive function
Figure 5 shows the correlation of MRF-based measurements against PET-based measurements and cognitive function. Significant correlations were found between MRF SUVr and the Aβ PET centiloid score13 (Spearman rho correlation coefficient = 0.589, p=.015), as well as the MoCA score (-0.543, p=.020).
Discussion
The proposed framework is compatible with a clinical 3T MRI in under 10 minutes. Its non-invasive nature facilitates longitudinal evaluation and correlates with Aβ-PET and cognitive function. It provides structural MRI and amyloid quantification patient stratification and close monitoring of treatment-related hemorrhages, serving as a 'one-stop' examination tool for those undergoing anti-amyloid treatments. Given the risk of hemorrhage from amyloid beta-reducing treatments15, this approach would be suitable for screening and evaluating drug efficacy and side effects.Conclusion
In this proof-of-concept study, we developed a framework that utilizes efficient MRF data acquisition and neural network-based decoding to quantify Aβ in the brain to distinguish Aβ-positivity was developed and demonstrated in a prospective, multi-site setting. This technique is suitable for repeated and longitudinal assessment.Acknowledgements
We acknowledge our funding sources (JSNR, JRS, and JSPS).References
- Jack CR Jr, Knopman DS, Jagust WJ, et al.: Hypothetical model of dynamic biomarkers of the Alzheimer’s pathological cascade. Lancet Neurol 2010; 9:119–128.
- Tosun D, Veitch D, Aisen P, et al.: Detection of β-amyloid positivity in Alzheimer’s Disease Neuroimaging Initiative participants with demographics, cognition, MRI and plasma biomarkers. Brain Commun 2021; 3:fcab008.
- van Dyck CH, Swanson CJ, Aisen P, et al.: Lecanemab in early Alzheimer’s disease. N Engl J Med 2023; 388:9–21.
- Ma D, Gulani V, Seiberlich N, et al.: Magnetic resonance fingerprinting. Nature 2013; 495:187–192.
- Hirose A: Complex-Valued Neural Networks: Advances and Applications. Wiley-IEEE Press; 2013.
- Joshi AD, Pontecorvo MJ, Clark CM, et al.: Performance characteristics of amyloid PET with florbetapir F 18 in patients with alzheimer’s disease and cognitively normal subjects. J Nucl Med 2012; 53:378–384.
- Clark CM, Pontecorvo MJ, Beach TG, et al.: Cerebral PET with florbetapir compared with neuropathology at autopsy for detection of neuritic amyloid-β plaques: a prospective cohort study. Lancet Neurol 2012; 11:669–678.
- Jiang Y, Ma D, Seiberlich N, Gulani V, Griswold MA: MR fingerprinting using fast imaging with steady state precession (FISP) with spiral readout. Magn Reson Med 2015; 74:1621–1631.
- Chung S, Kim D, Breton E, Axel L: Rapid B1+ mapping using a preconditioning RF pulse with TurboFLASH readout. Magn Reson Med 2010; 64:439–446.
- Updated UC Berkeley amyloid PET methods [https://adni.loni.usc.edu/updated-uc-berkeley-amyloid-pet-methods/]
- Ronneberger O, Fischer P, Brox T: U-Net: Convolutional Networks for Biomedical Image Segmentation. arXiv [csCV] 2015.
- Zhuang J, Tang T, Ding Y, et al.: AdaBelief optimizer: Adapting stepsizes by the belief in observed gradients. arXiv [csLG] 2020.
- Klunk WE, Koeppe RA, Price JC, et al.: The Centiloid Project: standardizing quantitative amyloid plaque estimation by PET. Alzheimers Dement 2015; 11:1-15.e1–4.
- Smith EE, Biessels GJ, De Guio F, et al.: Harmonizing brain magnetic resonance imaging methods for vascular contributions to neurodegeneration. Alzheimers Dement (Amst) 2019; 11:191–204.
- Sperling RA, Jack CR Jr, Black SE, et al.: Amyloid-related imaging abnormalities in amyloid-modifying therapeutic trials: recommendations from the Alzheimer’s Association Research Roundtable Workgroup. Alzheimers Dement 2011; 7:367–385.
Figures